Your browser does not fully support modern features. Please upgrade for a smoother experience.
Submitted Successfully!
 +1 credit
Thank you for your contribution! You can also upload a video entry or images related to this topic.
For video creation, please contact our Academic Video Service.
| Version | Summary | Created by | Modification | Content Size | Created at | Operation |
|---|---|---|---|---|---|---|
| 1 | Cristian Villagra | + 2047 word(s) | 2047 | 2021-06-24 10:38:04 | | | |
| 2 | Vicky Zhou | Meta information modification | 2047 | 2021-07-22 14:57:58 | | |
Video Upload Options
We provide professional Academic Video Service to translate complex research into visually appealing presentations. Would you like to try it?
Cite
If you have any further questions, please contact Encyclopedia Editorial Office.
Villagra, C. Agriculture and Pollinator Biodiversity. Encyclopedia. Available online: https://encyclopedia.pub/entry/12322 (accessed on 23 June 2026).
Villagra C. Agriculture and Pollinator Biodiversity. Encyclopedia. Available at: https://encyclopedia.pub/entry/12322. Accessed June 23, 2026.
Villagra, Cristian. "Agriculture and Pollinator Biodiversity" Encyclopedia, https://encyclopedia.pub/entry/12322 (accessed June 23, 2026).
Villagra, C. (2021, July 22). Agriculture and Pollinator Biodiversity. In Encyclopedia. https://encyclopedia.pub/entry/12322
Villagra, Cristian. "Agriculture and Pollinator Biodiversity." Encyclopedia. Web. 22 July, 2021.
Copy Citation
Pollinator biodiversity is greatly affected by industrialized agriculture practices. Agroecological alternatives for food production must be implemented.
agroecology
sacrifice zones
Apoidea
water deficit
pesticides
Food sovereignty
food security
1. Introduction
Industrial agriculture (hereafter “IA”) promoted by the Green Revolution has arguably brought about significant increases in food production globally over the past 70 years [1]. These models involve the use of a «technical package» with strong dependency on fossil fuels, which include large-scale monocrop landscapes of improved/selected seeds, increased mechanization, and the incorporation of “external inputs” to enhance plant growth and yield such as the introduction of managed pollinators, synthetic fertilizers and pesticides [2].
Agroecology (AE) takes advantage of local biotic components and abiotic conditions found in the agricultural landscape, seeking to match crops with local abiotic conditions and promote beneficial associated organisms [3]; highlighting the value of local knowledge and biodiversity that benefits agricultural production [4]. For instance, AE considers available organisms that improve crop productivity such as pollination, biological control, and decomposition as “resource biota” [5][6]. Through this lens, local diversity is regarded as a natural “internal input” (Figure 1; Figure 2), as opposed to “external inputs” required for IA production, enhancing sustainable food production in agroecologically-managed fields. Internal input provides different ecosystem services and ecological interactions [7][8]. The latter includes pollinators, predators, parasites, and herbivores as well as non-crop vegetation, soil invertebrates, and microorganisms, among other components of local biodiversity helping crop yield [9].
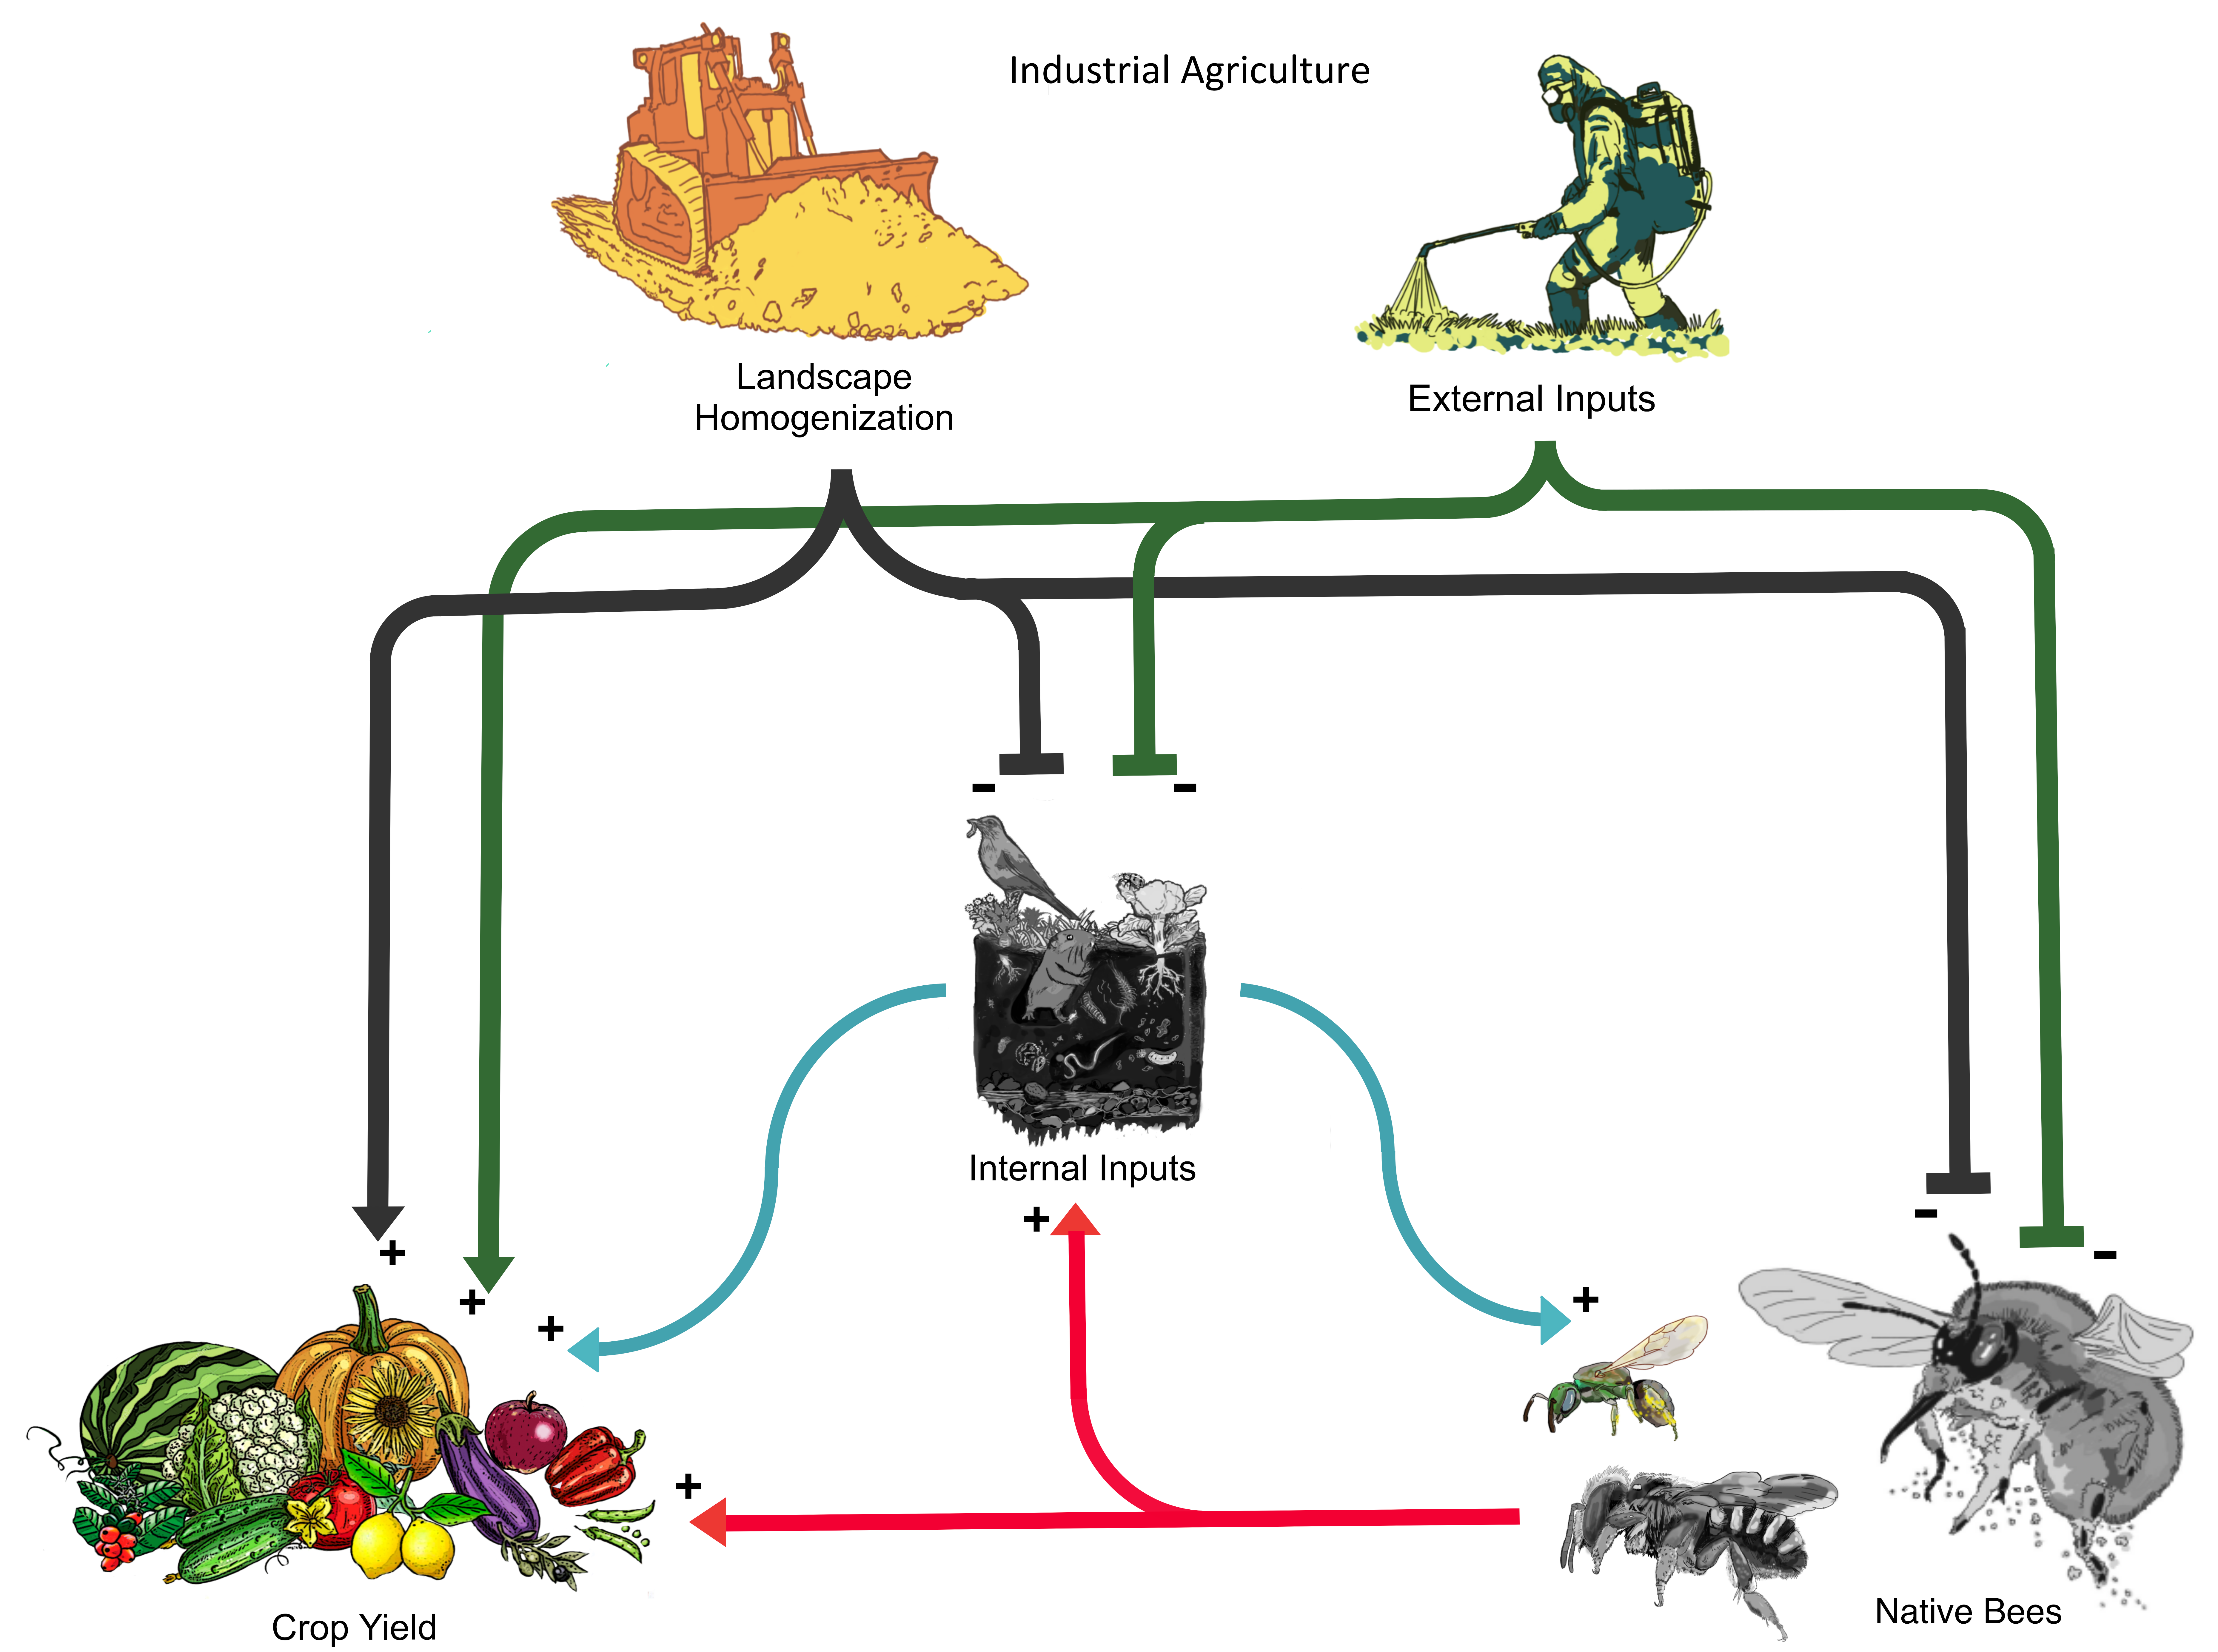 Figure 1. Schematic representation of industrial agriculture intensive management. Arrows and positive sings represent favorable influences between elements depicted by icons and tittles. “T” ending lines and negative signs symbolize unfavorable impacts. Landscape homogenization, the simplification of rural ecosystems that takes place under industrial agriculture, is illustrated with a bulldozer. The application of external inputs such as pesticides, GMOs, and managed exotic biological control agents and pollinators, is shown as an operator spraying agrochemicals. Landscape homogenization and external inputs are used to sustain crop yield production (represented by various fruits) under industrialized schemes. Nonetheless industrial agriculture’s landscape homogenization and external inputs are at the same time causing a decline of local biodiversity (e.g., beneficial microorganisms, plants, and animals), which despite not being recognized by industrial agriculture, are contributing to crop yield as internal inputs (in calypso lines). This component is illustrated by a slide of soil showing different wild lifeforms and their positive influences by calypso color lines. Among beneficial organisms present in agricultural landscapes are wild pollinators, represented by native bees. These are being exemplified in this figure by three specimens (with large to small species) by genera: Bombus, Anthidium, and Lasioglossum native species. Native bees’ positive interactions with crop yield and the remaining internal inputs the other components of this diagram are shown with red lines and arrows. Images in grey highlight detrimental effects on illustrated components (e.g., internal inputs and native bees).
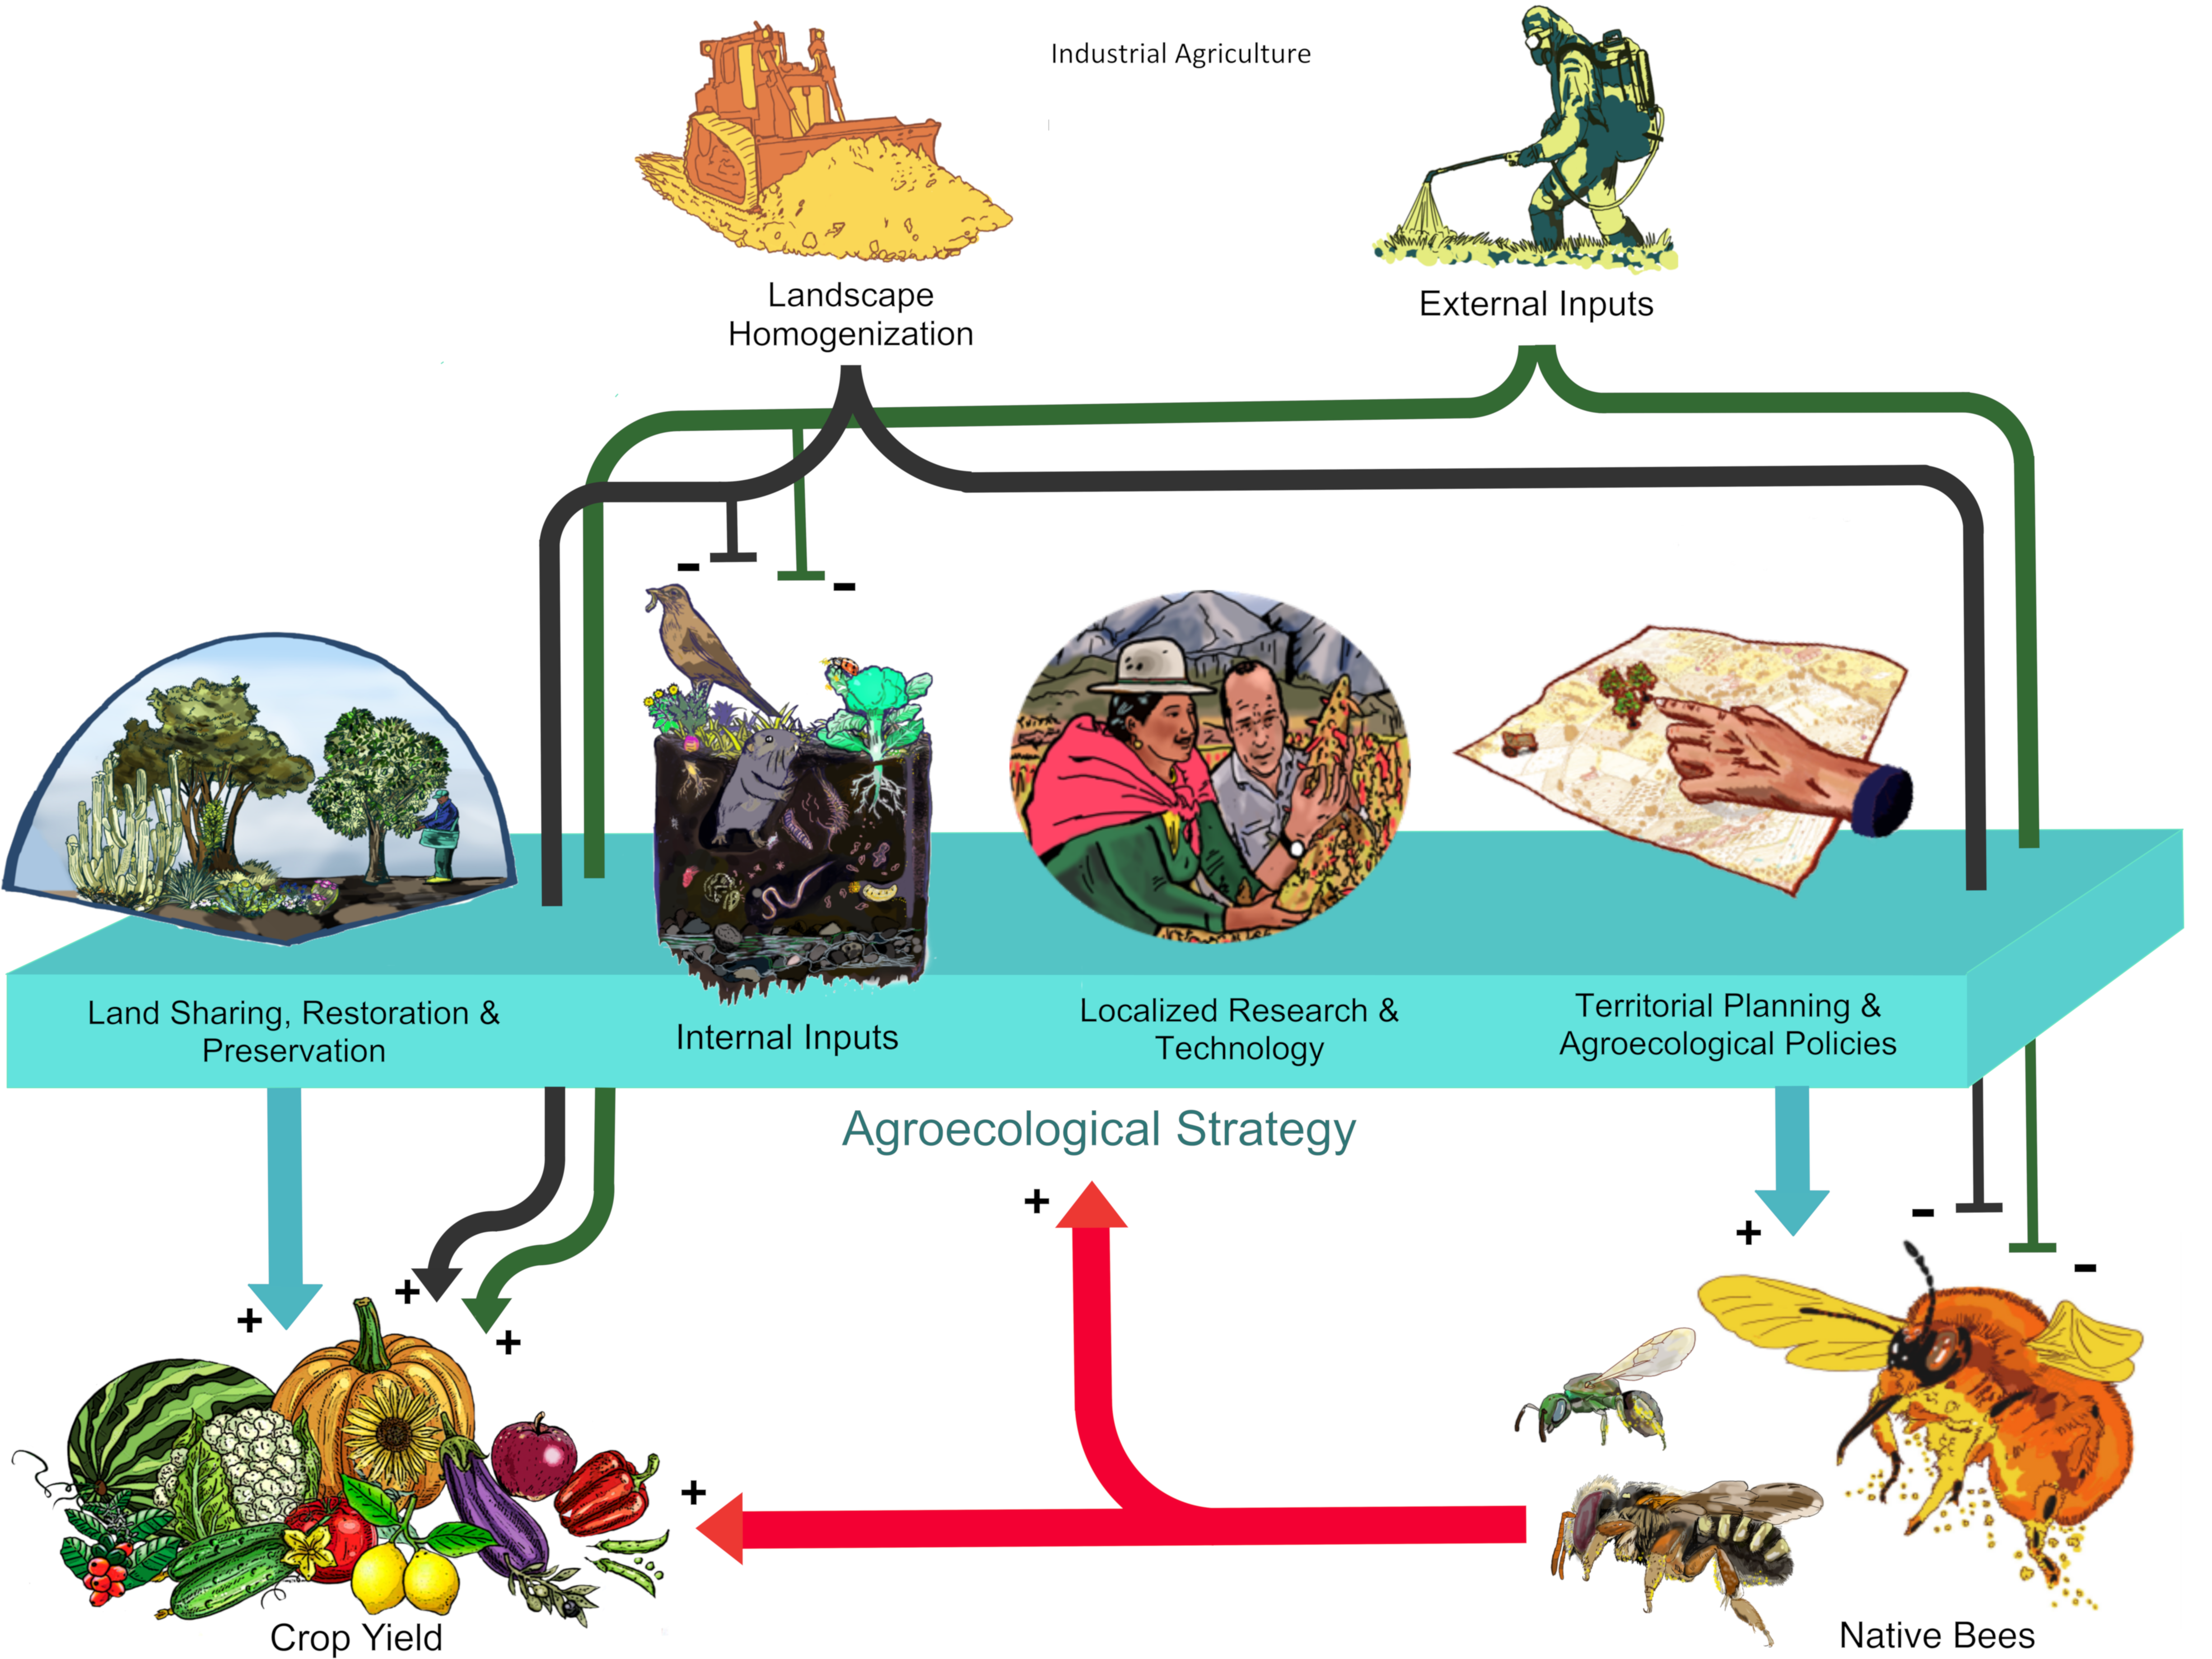
Figure 2. An agroecological strategy (in calypso) to counteract the effects of industrial agriculture managements currently in use for food production at world biodiversity hotspots. This plan is based on four main pillars: (i) Land sharing, restoration and preservation (illustrated by a wild plant community along a fruit orchard), (ii) the conservation and promotion of internal inputs, (iii) the recovery and development of localized research and technology (depicted by a local farmer and a scientist exchanging knowledges), as well as the implementation of (iv) territorial planning and agroecological policies (illustrated by a farm area map and pointing hand). We propose that these agroecological pillars may contribute to the survival and performance of native pollinators such as native bees. These wild pollinators contribute directly to crop yield as well as indirectly by its influences on the agroecological strategy. We suggest agroecological strategy may be able to buffer current LH and EE from IA, as a start point towards a gradual change towards the implementation of an agroecological food production system; not focused on international market needs only, but on food sovereignty and safety as the base for a true global sustainable food production. Illustrations by Cristian Villagra.
2. Protecting Pollination: Strategies for the Future
Human practices, including agriculture, need to return within the limits that keep our planet habitable [10][11], for the sake of our own species and all living organisms [12][13]. Countries with invaluable biodiversity need to rethink critically the way they are doing agriculture and revaluate local and native sustainable practices [14][15]. Understanding that native pollinator species are unique “resource biota” (see Glossary already contributing to current crop yield is to be aware of a strategic advantage compared to agriculture food production in non-WBH regions. Native pollinators are part of AE internal inputs that cannot be replaced by IA technological packages or external inputs [16]. Coexisting with our threatened local biodiversity (i.e., internal inputs) and valuing its cultural and biological wealth within productive ecosystems will protect the future of pollination services as well as contribute to food security and sovereignty. Here we focus on the development of an agriculture schemes in WBHs considering native biodiversity, and compile a strategy summarized in four pillars based on agroecological thinking as well as First Nations’ knowledge: (1) sharing, restoring and protecting the land; (2) local biodiversity as fundamental AE internal inputs contributing to sustainable agriculture food production and pollinator protection; (3) the need for recovering local knowledges and developing localized research and technology; and (4) territorial planning and the implementation of AE policies (Figure 2).
2.1. Sharing, Restoring, and Protecting the Land
Natural ecosystems are far from simple, and to achieve sustainable agriculture there is a need to maintain their complexity [8]. Polycultures and florally diverse environments have been found to support native pollinator diversity due to a continuous supply of food resources [17]. Agricultural practices need to consider that pollinator functional diversity relies on these native habitats and that biodiversity hotspots by definition are already threatened, thus need to be considered with special care when conducting productive and extractive activities. A sustainable complex landscape matrix is needed to protect hotspots and ensure the delivery of pollination services to crops. This pillar should integrate restoration and protection of large areas of natural habitat and restoration of native land patches within agroecosystems to increase habitat quality (i.e., land sharing) [18]. Pollination services delivered by native insects have been shown to rely strongly on their proximity to natural habitats [19][20][21]. Protected natural areas host higher biodiversity [22] but are not enough to sustain ecological stability [23]. To achieve stability, habitats that have been altered by human activities, including urban zones and areas utilized for productive activities, need to be restored as much as possible [24], leading to effective conservation outcomes by assessing their coverage (i.e., the number and types of species included within their limits) and management [25]. Restoring native patches of anthropized land improves habitat quality within agroecosystems, maintaining and securing native insects [26]. Native patches buffer the negative effects of pesticide application on pollinators [27][28], offer greater flower diversity and nesting sites [29] and are correlated with higher pollinator density [30]. In farmlands these patches also serve as wildlife corridors [31][32][33][34][35], promoting heterogeneous landscapes [36] and stabilizing crop pollination [37]. These patches could be implemented at field edges and should have mixed native plants with partial overlap in floral phenology to provide resources for bees during the whole flowering season [29]. Pollinators benefit from florally diverse environments due to a continuous supply of food resources [17], which are critical for ensuring their reproduction [38]. The size of these patches could be dependent on the crop type that they surround, and research should be carried out to define the appropriate cost-effective sizes within specific agroecosystems [39][40].
2.2. AE Internal Inputs for Sustainability and Pollinator Protection
Among the core principles of AE science and practice is the preservation and use of local diversity as natural inputs contributing to crop yield [41]. This approach also advocates for food sovereignty while reducing the negative effects of agriculture on the environment and society [42]. Monocultures, organic or not, reduce the functional diversity of pollinators [43]. Under an agroecological strategy (AES), biodiversity is incorporated into agroecosystems to mimic natural ecological processes [44] (Figure 2). With higher biodiversity, agroecosystem inner complexity grows and reduces the dependence of crops on destructive external inputs, allowing the system to maintain its own soil fertility, productivity, and protect itself from pests [45], benefiting insects and attracting pollinators [39]. All this allows native pollinators to visit crops safely and thrive in an agroecosystem with food and nesting resources free of pesticides. This higher pollinator biodiversity could even reduce the need to incorporate large numbers of managed pollinators within crops as additional external input. Nonetheless, this falls short of defining AE, as not only are academic, political, and cultural perspectives tightly knitted to this model, AE places small farmers and local knowledge as the key for food sovereignty [46] and does not agree with the new Green Revolution approach, which seeks to perpetuate an IA system for food production [47]. Instead, AE focuses on the dissemination of knowledge from farmer to farmer based on their historical backgrounds and on reviving their ancestral farming roots [48], strengthening communities and allowing them to become autonomous, securing local food production [47]. Mexican and Bolivian farmers are examples of how traditional low-intensity agriculture allows native bee species to provide successful pollination service [49][50]. There is no need for a new Green Revolution, as social vulnerability and income inequities are the main cause of hunger [51]. AES, summarized in this review, aim to protects pollinators not only by its effects in agroecosystems, but also by reducing poverty and improving people’s livelihoods, by both recovering local knowledges and developing local research technologies as well as implementing territorial planning and AE policies considering the needs of local communities (explained further in following sections, Figure 2) [52]. People can only protect or be concerned about biodiversity and its conservation once their basic needs have been met. Thus, the world does not need more food commodities to be traded globally; it needs equal access to nutritive food and production not focused only on market and profits [53][54].
2.3. Localized Research and Technology
IA is leading a steady biodiversity decline and exceeding the planetary boundaries that allow humans to survive on Earth [10]. The IA production and market scheme keeps low-income WBH countries of the world relying on the import of technological packages and depending on globalized markets to achieve their productivity goals. Technological packages should not be imported without knowing their consequences to ecosystems, local communities, and economies [55][56]. Critical knowledge gaps still exist regarding taxonomy, ecosystem services, and socio-ecological vulnerability in order to implement production alternatives considering native pollinators [57]. This is especially urgent in WBH countries risking their biodiversity, food sovereignty, and human wellbeing [58].
2.4. Territorial Planning and AE Policies
World biodiversity hotspots are strongly threatened by the loss of their species and resource depletion (e.g., water scarcity) due to IA business, currently representing sacrifice zones that provide food and goods to global markets, so the developed side of the world can “go green” [59]. This needs to change. AE’s local biodiversity “internal inputs” such as native pollination services [60] cannot be labeled as commodities (e.g., “natural capital” [60]), as its “exchange” threatens the sustainability of food production and commerce4. This is likely currently happening in a “Centinelan” pollination consumption (not a “trade”), as native bees cannot be replaced or recovered once species go extinct. Moreover, there is not a fair planetary-level exchange and interdependency between WBH exporters and international food commerce, as the resulting benefits have been demonstrated to be distributed globally in a both socially and economically unequal way [61]. For instance, in Chile IA is coupled with sustained social inequalities and unrest, local communities driven to unsanitary water deficit and unique biomes shrinking as IA expands, leading pollinating species to decline before having a chance to be studied [62][63][64]. These are the challenges policy makers need to face; if we want to keep the remaining biodiversity of native pollinators in food-producing countries, intensive industrialized agriculture schemes must be first buffered by AES and gradually replaced by true sustainable food production [65][66].
3. Conclusions
A new deal considering AE approaches must be implemented globally, considering WBH as key areas both for the preservation of native pollinator biodiversity and rights and wellbeing of local communities. The implementation of agroecological strategies in WBHs as starting point and buffer for IA may facilitate the transition towards a true sustainable food production. AES will improve our understanding of ecological dynamics in agroecosystems, allowing sustainable development over time, ensuring local development and food sovereignty of WBH, for the sake of keeping native pollinator biodiversity and the wellbeing of the whole planet [67][10].
References
- Khush, G.S. Green Revolution: Preparing for the 21st Century. Genome 1999, 42, 646–655.
- Lin, B.B.; Chappell, M.J.; Vandermeer, J.; Smith, G.; Quintero, E.; Bezner-Kerr, R.; Griffith, D.M.; Ketcham, S.; Latta, S.C.; McMichael, P.; et al. Effects of Industrial Agriculture on Climate Change and the Mitigation Potential of Small-Scale Agro-Ecological Farms. CAB Rev. Perspect. Agric. Vet. Sci. Nutr. Nat. Resour. 2011, 6, 1–19.
- Gurr, G.; Wratten, S.; Altieri, M. Ecological Engineering for Pest Management. Advances in Habitat Manipulation for Arthropods; CSIRO: Collingwood, VIC, Canada, 2004.
- González-Chang, M.; Dörner, J.; Zúñiga, F. Agroecología y Sistemas Agrícolas Sustentables. Agro Sur 2018, 46, 1–2.
- Southwood, R.E.; Way, M.J. Ecological Background to Pest Management. In Concepts of Pest Management; Rabb, R.C., Guthrie, F.E., Eds.; North Carolina State University: Raleigh, NC, USA, 1970; pp. 6–29.
- Altieri, M.A. The Ecological Role of Biodiversity in Agroecosystems. Agric. Ecosyst. Environ. 1999, 74, 19–31.
- Maran, A.M.; Weintraub, M.N.; Pelini, S.L. Does Stimulating Ground Arthropods Enhance Nutrient Cycling in Conventionally Managed Corn Fields? Agric. Ecosyst. Environ. 2020, 297, 106934.
- Bommarco, R.; Kleijn, D.; Potts, S.G. Ecological Intensification: Harnessing Ecosystem Services for Food Security. Trends Ecol. Evol. 2013, 28, 230–238.
- Altieri, M.A. Biodiversity and Pest Management in Agroecosystems; Haworth Press: New York, NY, USA, 1994.
- Rockström, J.; Steffen, W.; Noone, K.; Persson, Å.; Chapin, F.S.; Lambin, E.; Lenton, T.M.; Scheffer, M.; Folke, C.; Schellnhuber, H.J.; et al. Planetary Boundaries: Exploring the Safe Operating Space for Humanity. Ecol. Soc. 2009, 14.
- Steffen, W.; Richardson, K.; Rockström, J.; Cornell, S.E.; Fetzer, I.; Bennett, E.M.; Biggs, R.; Carpenter, S.R.; De Vries, W.; De Wit, C.A.; et al. Planetary Boundaries: Guiding Human Development on a Changing Planet. Science 2015, 347.
- Desing, H.; Brunner, D.; Takacs, F.; Nahrath, S.; Frankenberger, K.; Hischier, R. A Circular Economy within the Planetary Boundaries: Towards a Resource-Based, Systemic Approach. Resour. Conserv. Recycl. 2020, 155, 104673.
- Heck, V.; Hoff, H.; Wirsenius, S.; Meyer, C.; Kreft, H. Land Use Options for Staying within the Planetary Boundaries—Synergies and Trade-Offs between Global and Local Sustainability Goals. Glob. Environ. Chang. 2018, 49, 73–84.
- Parraguez-Vergara, E.; Contreras, B.; Clavijo, N.; Villegas, V.; Paucar, N.; Ther, F. Does Indigenous and Campesino Traditional Agriculture Have Anything to Contribute to Food Sovereignty in Latin America? Evidence from Chile, Peru, Ecuador, Colombia, Guatemala and Mexico. Int. J. Agric. Sustain. 2018, 16, 326–341.
- Mickey, S. Learning Native Wisdom: What Traditional Cultures Teach Us About Subsistence, Sustainability, and Spirituality. Worldviews Glob. Relig. Cult. Ecol. 2013, 13, 136–139.
- Grey, S.; Patel, R. Food Sovereignty as Decolonization: Some Contributions from Indigenous Movements to Food System and Development Politics. Agric. Human Values 2015, 32, 431–444.
- Kaluza, B.F.; Wallace, H.M.; Heard, T.A.; Minden, V.; Klein, A.; Leonhardt, S.D. Social Bees Are Fitter in More Biodiverse Environments. Sci. Rep. 2018, 8, 12353.
- Kremen, C. Reframing the Land-sparing/Land-sharing Debate for Biodiversity Conservation. Ann. N. Y. Acad. Sci. 2015, 1355, 52–76.
- Ricketts, T.H.; Regetz, J.; Steffan-Dewenter, I.; Cunningham, S.A.; Kremen, C.; Bogdanski, A.; Gemmill-Herren, B.; Greenleaf, S.S.; Klein, A.M.; Mayfield, M.M.; et al. Landscape Effects on Crop Pollination Services: Are There General Patterns? Ecol. Lett. 2008, 11, 499–515.
- Kremen, C.; Williams, N.M.; Bugg, R.L.; Fay, J.P.; Thorp, R.W. The Area Requirements of an Ecosystem Service: Crop Pollination by Native Bee Communities in California. Ecol. Lett. 2004, 7, 1109–1119.
- Bailey, S.; Requier, F.; Nusillard, B.; Roberts, S.P.M.; Potts, S.G.; Bouget, C. Distance from Forest Edge Affects Bee Pollinators in Oilseed Rape Fields. Ecol. Evol. 2014, 4, 370–380.
- Gray, C.L.; Hill, S.L.L.; Newbold, T.; Hudson, L.N.; Boïrger, L.; Contu, S.; Hoskins, A.J.; Ferrier, S.; Purvis, A.; Scharlemann, J.P.W. Local Biodiversity Is Higher inside than Outside Terrestrial Protected Areas Worldwide. Nat. Commun. 2016, 7.
- Felipe Viana, B. How Well Do We Understand Landscape Effects on Pollinators and Pollination Services? J. Pollinat. Ecol. 2012, 7, 31–40.
- Sobreiro, A.I. Recover and They’ll Come: Flower Visiting Bees Benefit from the Continuous of Micro- Environments Set by Regenerating Forest Fragments. Sociobiology 2021, 68, 1–17.
- Chape, S.; Harrison, J.; Spalding, M.; Lysenko, I. Measuring the Extent and Effectiveness of Protected Areas as an Indicator for Meeting Global Biodiversity Targets. Philos. Trans. R. Soc. B Biol. Sci. 2005, 360, 443–455.
- Steffan-Dewenter, I.; Tscharntke, T. Effects of Habitat Isolation on Pollinator Communities and Seed Set. Oecologia 1999, 121, 432–440.
- Park, M.G.; Blitzer, E.J.; Gibbs, J.; Losey, J.E.; Danforth, B.N. Negative Effects of Pesticides on Wild Bee Communities Can Be Buffered by Landscape Context. Proc. R. Soc. B Biol. Sci. 2015, 282.
- Carrié, R.; Andrieu, E.; Ouin, A.; Steffan-Dewenter, I. Interactive Effects of Landscape-Wide Intensity of Farming Practices and Landscape Complexity on Wild Bee Diversity. Landsc. Ecol. 2017, 32, 1631–1642.
- Morandin, L.A.; Kremen, C. Hedgerow Restoration Promotes Pollinator Populations and Exports Native Bees to Adjacent Fields. Ecol. Appl. 2013, 23, 829–839.
- Blaauw, B.R.; Isaacs, R. Larger Patches of Diverse Floral Resources Increase Insect Pollinator Density, Diversity, and Their Pollination of Native Wildflowers. Basic Appl. Ecol. 2014, 15, 701–711.
- Hopfenmüller, S.; Steffan-Dewenter, I.; Holzschuh, A. Trait-Specific Responses of Wild Bee Communities to Landscape Composition, Configuration and Local Factors. PLoS ONE 2014, 9.
- Alomar, D.; González-Estévez, M.A.; Traveset, A.; Lázaro, A. The Intertwined Effects of Natural Vegetation, Local Flower Community, and Pollinator Diversity on the Production of Almond Trees. Agric. Ecosyst. Environ. 2018, 264, 34–43.
- Riojas-López, M.E.; Díaz-Herrera, I.A.; Fierros-López, H.E.; Mellink, E. The Effect of Adjacent Habitat on Native Bee Assemblages in a Perennial Low-Input Agroecosystem in a Semiarid Anthropized Landscape. Agric. Ecosyst. Environ. 2019, 272, 199–205.
- Burkle, L.A.; Delphia, C.M.; O’Neill, K.M. A Dual Role for Farmlands: Food Security and Pollinator Conservation. J. Ecol. 2017, 105, 890–899.
- Krewenka, K.M.; Holzschuh, A.; Tscharntke, T.; Dormann, C.F. Landscape Elements as Potential Barriers and Corridors for Bees, Wasps and Parasitoids. Biol. Conserv. 2011, 144, 1816–1825.
- Boscolo, D.; Tokumoto, P.M.; Ferreira, P.A.; Ribeiro, J.W.; Santos, J.S. dos. Positive Responses of Flower Visiting Bees to Landscape Heterogeneity Depend on Functional Connectivity Levels. Perspect. Ecol. Conserv. 2017, 15, 18–24.
- Klein, A.M.; Vaissière, B.E.; Cane, J.H.; Steffan-Dewenter, I.; Cunningham, S.A.; Kremen, C.; Tscharntke, T. Importance of Pollinators in Changing Landscapes for World Crops. Proc. R. Soc. B Biol. Sci. 2007, 274, 303–313.
- Williams, N.M.; Kremen, C. Resource Distributions among Habitats Determine Solitary Bee Offspring Production in a Mosaic Landscape. Ecol. Appl. 2007, 17, 910–921.
- Nicholls, C.I.; Altieri, M.A. Plant Biodiversity Enhances Bees and Other Insect Pollinators in Agroecosystems. A Review. Agron. Sustain. Dev. 2013, 33, 257–274.
- Wojtjowsjki, P.A. Agroecological Economics. Sustainability and Biodiversity; Elsevier: London, UK, 2008.
- Nicholls, C.I.; Altieri, M.A.; Vazquez, L. Agroecology: Principles for the Conversion and Redesign of Farming Systems. J. Ecosyst. Ecography 2016, 01.
- Altieri, M.A.; Toledo, V.M. The Agroecological Revolution in Latin America: Rescuing Nature, Ensuring Food Sovereignty and Empowering Peasants. J. Peasant Stud. 2011, 38, 587–612.
- Forrest, J.R.K.; Thorp, R.W.; Kremen, C.; Williams, N.M. Contrasting Patterns in Species and Functional-Trait Diversity of Bees in an Agricultural Landscape. J. Appl. Ecol. 2015, 52, 706–715.
- Altieri, M.A. Agroecology: The Science of Sustainable Agriculture, 2nd ed.; CRC Press Taylor & Francis Group: New York, NY, USA, 2018.
- Altieri, M.A.; Rosset, P. Agroecology and the Conversion of Large-Scale Conventional Systems to Sustainable Management. Int. J. Environ. Stud. 1996, 50, 165–185.
- Jacobi, J.; Mathez-Stiefel, S.L.; Gambon, H.; Rist, S.; Altieri, M. Whose Knowledge, Whose Development? Use and Role of Local and External Knowledge in Agroforestry Projects in Bolivia. Environ. Manage. 2017, 59, 464–476.
- Holt-Giménez, E.; Altieri, M.A. Agroecology, Food Sovereignty, and the New Green Revolution. Agroecol. Sustain. Food Syst. 2013, 37, 90–102.
- Nicholls, C.I.; Altieri, M.A. Pathways for the Amplification of Agroecology. Agroecol. Sustain. Food Syst. 2018, 42, 1170–1193.
- Landaverde-González, P.; Quezada-Euán, J.J.G.; Theodorou, P.; Murray, T.E.; Husemann, M.; Ayala, R.; Moo-Valle, H.; Vandame, R.; Paxton, R.J. Sweat Bees on Hot Chillies: Provision of Pollination Services by Native Bees in Traditional Slash-and-Burn Agriculture in the Yucatán Peninsula of Tropical Mexico. J. Appl. Ecol. 2017, 54, 1814–1824.
- Catacora-Vargas, G.; Piepenstock, A.; Sotomayor, C.; Cuentas, D.; Cruz, A.; Delgado, F. Brief Historical Review of Agroecology in Bolivia. Agroecol. Sustain. Food Syst. 2017, 41, 429–447.
- Tscharntke, T.; Clough, Y.; Wanger, T.C.; Jackson, L.; Motzke, I.; Perfecto, I.; Vandermeer, J.; Whitbread, A. Global Food Security, Biodiversity Conservation and the Future of Agricultural Intensification. Biol. Conserv. 2012, 151, 53–59.
- Altieiri, M.A. Agroecology, Small Farms, and Food Sovereignty. Mon. Rev. 2009, 61.
- Pinstrup-Andersen, P. Food Security: Definition and Measurement. Food Secur. 2009, 1, 5–7.
- Altieri, M.A.; Nicholls, C.I. Agroecology: Challenges and Opportunities for Farming in the Anthropocene. Int. J. Agric. Nat. Resour. 2020, 47, 204–215.
- Matsuda, T.; Wolff, J.; Yanagawa, T. Risk and the Regulation of New Technologies; Unive, K., Yanagawa, T., Eds.; Springer & Kobe University: Kobe, Japan, 2021.
- Shaw, A.; Wilson, K. The Bill and Melinda Gates Foundation and the Necro-Populationism of ‘Climate-Smart’ Agriculture. Gend. Place Cult. 2020, 27, 370–393.
- Shields, M.W.; Johnson, A.C.; Pandey, S.; Cullen, R.; González-Chang, M.; Wratten, S.D.; Gurr, G.M. History, Current Situation and Challenges for Conservation Biological Control. Biol. Control. 2019, 25–35.
- Laterra, P.; Barral, P.; Carmona, A.; Nahuelhual, L. Focusing Conservation Efforts on Ecosystem Service Supply May Increase Vulnerability of Socio-Ecological Systems. PLoS ONE 2016, 11, 100875.
- Wilting, H.C.; Schipper, A.M.; Bakkenes, M.; Meijer, J.R.; Huijbregts, M.A.J. Quantifying Biodiversity Losses Due to Human Consumption: A Global-Scale Footprint Analysis. Environ. Sci. Technol. 2017, 51, 3298–3306.
- Birch, K.; Levidow, L.; Papaioannou, T. Sustainable Capital? The Neoliberalization of Nature and Knowledge in the European “Knowledge-Based Bio-Economy”. Sustainability 2010, 2, 2898–2918.
- Silva, F.; Carvalheiro, L.G.; Aguirre-Gutiérrez, J.; Lucotte, M.; Guidoni-Martins, K.; Mertens, F. Virtual Pollination Trade Uncovers Global Dependence on Biodiversity of Developing Countries. AAAS Sci. Adv. 2021, 7, eabe6636.
- Altieri, M.A.; Rojas, A. Ecological Impacts of Chile’s Neoliberal Policies, with Special Emphasis on Agroecosystems. Environ. Dev. Sustain. 1999, 1, 55–72.
- Kay, C. Chile’s Neoliberal Agrarian Transformation and the Peasantry. J. Agrar. Chang. 2002, 2, 464–501.
- Aitken, D.; Rivera, D.; Godoy-Faúndez, A.; Holzapfel, E. Water Scarcity and the Impact of the Mining and Agricultural Sectors in Chile. Sustainability 2016, 8, 128.
- Freitas, B.M.; Imperatriz-Fonseca, V.L.; Medina, L.M.; Kleinert, A.D.M.P.; Galetto, L.; Nates-Parra, G.; Javier, J. Diversity, Threats and Conservation of Native Bees in the Neotropics. Apidologie 2009, 332–346.
- Pérez-Méndez, N.; Andersson, G.K.S.; Requier, F.; Hipólito, J.; Aizen, M.A.; Morales, C.L.; García, N.; Gennari, G.P.; Garibaldi, L.A. The Economic Cost of Losing Native Pollinator Species for Orchard Production. J. Appl. Ecol. 2020, 57, 599–608.
- Hamilton, C.; Bonneuil, C.; Gemenne, F. The Anthropocene and the Global Environmental Crisis; Hamilton, C., Bonneuil, C., Gemenne, F., Eds.; Routledge, Taylor and Francis Group: London, UK; New York, NY, USA, 2015.
More
Information
Subjects:
Biodiversity Conservation
Contributor
MDPI registered users' name will be linked to their SciProfiles pages. To register with us, please refer to https://encyclopedia.pub/register
:
View Times:
1.9K
Entry Collection:
Environmental Sciences
Revisions:
2 times
(View History)
Update Date:
22 Jul 2021
Table of Contents


Notice
You are not a member of the advisory board for this topic. If you want to update advisory board member profile, please contact office@encyclopedia.pub.
OK
Confirm
Only members of the Encyclopedia advisory board for this topic are allowed to note entries. Would you like to become an advisory board member of the Encyclopedia?
Yes
No
${ textCharacter }/${ maxCharacter }
Submit
Cancel
Back
Comments
${ item }
|
${ item.createdUser.fullName }
${ item.createdAt }
${ item.vote }
${ item.reply }
Delete
${ reply.createdUser.fullName }
${ reply.createdAt }
${ reply.vote }
Delete
There is no reply to this comment~
${ item.replyTextCharacter }/${ item.replyMaxCharacter }
Submit
Cancel
More
No more~
There is no comment~
${ textCharacter }/${ maxCharacter }
Submit
Cancel
${ selectedItem.replyTextCharacter }/${ selectedItem.replyMaxCharacter }
Submit
Cancel
Confirm
Are you sure to Delete?
Yes
No