Your browser does not fully support modern features. Please upgrade for a smoother experience.

Submitted Successfully!
Thank you for your contribution! You can also upload a video entry or images related to this topic.
For video creation, please contact our Academic Video Service.
| Version | Summary | Created by | Modification | Content Size | Created at | Operation |
|---|---|---|---|---|---|---|
| 1 | Giuseppe Guido | + 2624 word(s) | 2624 | 2021-06-23 05:32:42 | | | |
| 2 | Rita Xu | Meta information modification | 2624 | 2021-07-07 09:54:56 | | | | |
| 3 | Rita Xu | Meta information modification | 2624 | 2021-07-07 09:56:54 | | |
Video Upload Options
We provide professional Academic Video Service to translate complex research into visually appealing presentations. Would you like to try it?
Cite
If you have any further questions, please contact Encyclopedia Editorial Office.
Guido, G. Connected Vehicles. Encyclopedia. Available online: https://encyclopedia.pub/entry/11762 (accessed on 07 February 2026).
Guido G. Connected Vehicles. Encyclopedia. Available at: https://encyclopedia.pub/entry/11762. Accessed February 07, 2026.
Guido, Giuseppe. "Connected Vehicles" Encyclopedia, https://encyclopedia.pub/entry/11762 (accessed February 07, 2026).
Guido, G. (2021, July 07). Connected Vehicles. In Encyclopedia. https://encyclopedia.pub/entry/11762
Guido, Giuseppe. "Connected Vehicles." Encyclopedia. Web. 07 July, 2021.
Copy Citation
Connected and autonomous vehicles and cooperative intelligent transportation systems (C-ITSs) are new technologies that will impact traffic control and management.
connected vehicles
traffic signal control
floating car data
1. Introduction
Connected and autonomous vehicles and cooperative intelligent transportation systems (C-ITSs) are new technologies that will impact traffic control and management. Cooperative intelligent transportation systems (C-ITSs) are based on the sharing of information between drivers and road management. Connected vehicles (CAs) will be able to share speeds and positions among many other various useful data. Vehicle speeds and positions can be used to better manage traffic signals in real time. Connected vehicles can become an important part of new C-ITSs. Some of these ideas have been explored in some European-funded projects such as SAFESPOT [1], EuroFOT [2] and DRIVE C2X [3].
One of the main tasks that road managers must deal with in traffic control is the management of signalized intersections. Control operations, unfortunately, very often are not adjusted in real time and sometimes are implemented with out-of-date fixed-time traffic signal settings. Traffic congestion, which can also be caused by traffic signals, is a serious problem in cities and also a great cause of air pollution. For this reason, efforts to solve congestion problems have been centered on attempts to shift demand on transit systems [4] and on better road traffic control, by adopting tools such as traffic simulation [5][6][7][8][9][10] dynamic network loading equilibrium and dynamic models [11][12][13][14] and the study of and attempt to affect user route choice [15][16][17][18][19].
Many large-scale deployments of systems based on floating car data (FCD) are already showing the use of mobile phones [20][21][22][23] and wireless communications [24][25] combined with global navigation satellite system (GNSS) technologies. Cooperative systems based on smartphones are spontaneously spreading in ordinary use (BlaBla Car, Uber, etc.). Cooperative systems based on smartphones have also been proposed for pedestrians and bicycles [26].
Smartphones (and connected vehicles) can obtain location and speed information from GNSS systems such as Galileo, GPS and Glonass. GPS embedded in smartphones produces an economic method to obtain vehicular travel time [27] and to evaluate traffic scenarios [28][29]. Smartphones also allow the estimation of traffic safety parameters [30] and path choice [31]. Mobile devices have also been used to assess safety and risks by insurance companies [32] and for traffic safety [33][34] and fuel consumption estimation [35].
All these concepts have been applied also in the management of signalized intersections: GNSS data coming from private vehicles were useful in the evaluation of adaptive traffic signal systems in [36], and smartphones were useful to gather information on traffic signal timings [37][38][39]; the use of FCD in C-ITSs is discussed in [40], where traffic signal regulation from FCD is achieved. The term “floating car data adaptive traffic lights” (FCDATL) or “floating car data adaptive traffic signals” (FCDATS) was introduced in [41]. The specific use of FCD data coming from smartphones to regulate adaptive traffic signals in real time was also investigated in [42][43][44][45][46]. In some cases, the adaptive traffic signal system is used in combination with driver assistance, so that both driver behavior and traffic signals are adjusted in real time.
Projects such as Colombo [43] have been presented in which the general potential of vehicle communication to other vehicles or infrastructures (V2X) for traffic management is investigated. Some works have also been presented on traffic signal regulation presenting algorithms without a clear definition of the underlying communication and control systems. Among them, [47][48][49] propose the use of game theory in traffic signal regulation, implicitly assuming that information on all vehicle positions is available.
2. Topic Visualization Analysis
To create a profile of the most important issues arising in the field and to perform a visualization of main topics, we carried out a text-mining analysis using the VOSviewer suggested procedure to text-mine the keywords of the papers.
VOSviewer applies natural language calculation methods to analyze the keywords. We followed indications and considerations from [50].
With this procedure, we generated what is called a “concurrence network” (Figure 1).
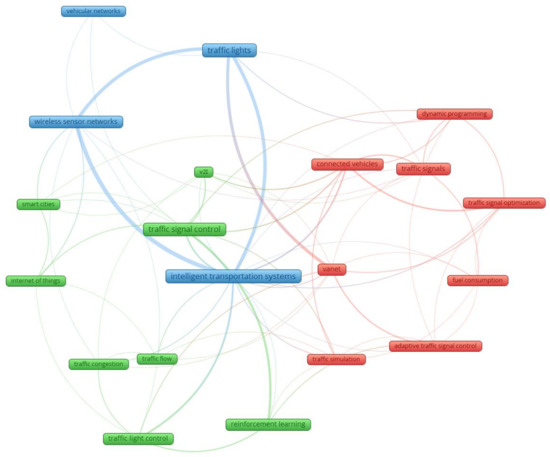
Figure 1. Keywords topic visualization analysis—concurrence network.
In this network, the most relevant terms were highlighted, and a cluster analysis was performed identifying four clusters that theoretically gather themes that share some higher connection. Once the procedure was completed, we gave a title to each cluster in agreement with what seems to be the leading topic. We applied the VOSviewer option of eight for the minimum number of occurrences of a term. From a total of 1524 keyword terms, 20 met the threshold. The selected terms were grouped in four clusters, as shown in Figure 3 and Table 1. It must be noted that the procedure we applied to extract the terms and to create the clusters is completely automatic, the clusters are created according to an algorithm that puts together terms that are not necessarily logically connected. We manually gave a label to each cluster, and some of the terms, thus, might not be connected with the specific topic label we have chosen.
Table 1. Keyword topic visualization clusters.
| ITS | Smart Cities and Traffic | Connected Vehicles and Traffic |
|---|---|---|
| intelligent transportation systems | internet of things | adaptive traffic signal control |
| traffic lights | reinforcement learning | connected vehicles |
| vehicular networks | smart cities | dynamic programming |
| wireless sensor networks | traffic congestion | fuel consumption |
| traffic flow | traffic signal optimization | |
| traffic light control | traffic signals | |
| traffic signal control | traffic simulation | |
| v2I | VANET |
3. Cocitation Analysis: Influential Journals, References and Authors
Following standard VOSviewer suggested procedures, we performed a cocitation analysis to establish the more influential journals and references. Reference cocitation can allow observers to automatically recognize the shape, qualities and scientific progress of a research field. In the same way, journal cocitation analysis can be a useful instrument for assessing the general layout of a scientific field relative to the current theoretical framework of specific journals. The algorithm considers that two references or two journals are more strongly connected when they are more frequently cocited. Again, a clustering algorithm is applied to discover clusters of connected references and journals. In this procedure, we decided to include only references and journal sources with a minimum of three cocitations.
The results show that, with 13,574 cited references, only 67 meet the threshold. For each of the sorted references, the total strength of the cocitation links with other cited references was calculated, and all 67 references are mapped in Figure 2. In an attempt to resolve the poor connection among these 67 references, the largest set of connected references was considered, which consists of 23 items. For each of the 23 sorted references, the total strength of the cocitation links with other cited references was calculated, and all 23 cocited references are listed and mapped in Figure 3. Five dispersed clusters surfaced, and in the visualization, it is still possible to see a poor connection among references. Clusters are differentiated by colors. Larger nodes indicate a higher number of citations, and the different clusters evidence the connection among references. The network of references is not well developed, and this seems to suggest that the specific field of research is in an embryonic stage with a great potential for growth: new findings are possible and new scientific works have the potential to create a more developed research network in the future.
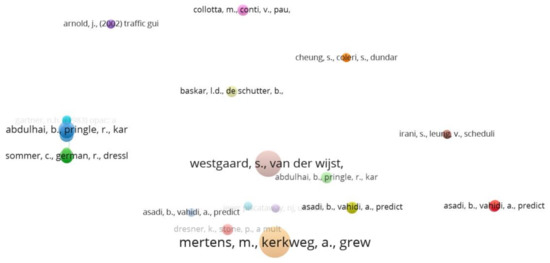
Figure 2. Reference visualization of database list “A”: the resulting network is poorly connected, showing a possible underdeveloped stage for this field of research.

Figure 3. Reference visualization for the 23 connected references resulting from the database of list “A”: the resulting network is still poorly connected.
The largest node is represented by a work from Abdulhai, Pringle and Karakoulas [51], which was not in the original database of 684 works.
This procedure, in fact, is able to find influential documents that might not be present in the database list “A” and that might have received a high number of cocitations in the database.
Among these 67 cocited documents, it is also possible to see general documents that constitute a scientific base for the research field under investigation but do not necessarily specifically pertain to this field of traffic signal control methods and experiments based on CAs and FCD.
In order to consider documents that are influential for the investigated field of research, the 67 documents were manually checked to exclude completely impertinent documents; the following 15 documents listed in Table 2 have been considered as influential and will be added to the final list of influential documents (in case they are not already listed).
Table 2. Most influential documents chosen among the 67 influential references by manually excluding impertinent documents.
| 1 | B. Asadi and A. Vahidi, “Predictive Cruise Control: Utilizing Upcoming Traffic Signal Information for Improving Fuel Economy and Reducing Trip Time”, in IEEE Transactions on Control Systems Technology, May 2011, vol. 19, no. 3, pp. 707–714 [52]. |
| 2 | Y. Chen, D. Zhang and K. Li, “Enhanced eco-driving system based on V2X communication”, 2012, 15th International IEEE Conference on Intelligent Transportation Systems, Anchorage, AK, 2012, pp. 200–205 [53]. |
| 3 | H. Rakha and R. K. Kamalanathsharma, “Eco-driving at signalized intersections using V2I communication”, 2011, 14th International IEEE Conference on Intelligent Transportation Systems (ITSC), Washington, DC, 2011, pp. 341–346 [54]. |
| 4 | U. Kiencke and L. Nielsen, Automotive Control Systems, Springer, 2005 [55]. |
| 5 | S.M. Lavalle, Planning Algorithms, Cambridge University Press, 2006 [56]. |
| 6 | H. Wahl, M. Holzäpfel and F. Gauterin, “Approximate dynamic programming methods applied to far trajectory planning in optimal control”, 2014 IEEE Intelligent Vehicles Symposium Proceedings, Dearborn, MI, 2014, pp. 1085–1090 [57]. |
| 7 | H. Xia, K. Boriboonsomsin, F. Schweizer, A. Winckler, K. Zhou, W-B. Zhang and M. Barth, “Field operational testing of ECO-approach technology at a fixed-time signalized intersection”, 2012 15th International IEEE Conference on Intelligent Transportation Systems, Anchorage, AK, 2012, pp. 188–193 [58]. |
| 8 | Y. Feng, K.L. Head, S. Khoshmagham and M. Zamanipour, “A real-time adaptive signal control in a connected vehicle environment”, Transportation Research Part C: Emerging Technologies, Volume 55, June 2015, pp. 460–473 [59]. |
| 9 | J. Arnold, Traffic guidance system, Mitsubishi International GmbH, US Patent No. US006418371B1; July 2002 [60]. |
| 10 | M.R. Rahman, Method for controlling traffic, USA, Intel corporation, 2002 [61]. |
| 11 | B. Abdulhai, R. Pringle and G. Karakoulas, “Reinforcement learning for true adaptive traffic signal control”, Journal of Transportation Engineering, 129 (3), 2003, pp. 278–285 [51]. |
| 12 | J. Lee and B. Park, “Development and Evaluation of a Cooperative Vehicle Intersection Control Algorithm Under the Connected Vehicles Environment”, in IEEE Transactions on Intelligent Transportation Systems, vol. 13, no. 1, March 2012, pp. 81–90 [62]. |
| 13 | J. Zhao, W. Li, J. Wang and X. Ban, “Dynamic Traffic Signal Timing Optimization Strategy Incorporating Various Vehicle Fuel Consumption Characteristics”, in IEEE Transactions on Vehicular Technology, vol. 65, no. 6, June 2016, pp. 3874–3887 [63]. |
| 14 | C. Diakaki, M. Papageorgiou and K. Aboudolas, “A multivariable regulator approach to traffic-responsive network-wide signal control”, Control Engineering Practice, Volume 10, Issue 2, February 2002, pp. 183–195 [64]. |
| 15 | P. Mirchandani and L. Head, “A real-time traffic signal control system: architecture, algorithms, and analysis”, Transportation Research Part C: Emerging Technologies, Volume 9, Issue 6, December 2001, pp. 415–432 [65]. |
Regarding the analysis of influential journals, we also used VOSviewer to elaborate the journal cocitation network. By establishing a cocitation threshold of 20 citations for a source (default value in VOSviewer), 48 sources were selected from 7641 sources and were grouped in four clusters. Results are shown in Figure 4, where the distance between the nodes shows the cocitation frequency. In other words, a small distance between two nodes shows a high cocitation frequency between the two sources.
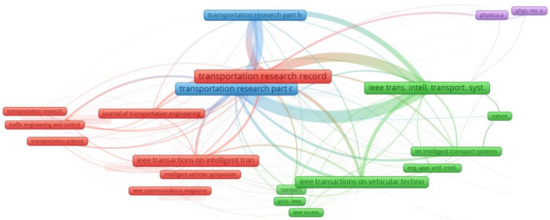
Figure 4. Source visualization of database list “A” obtained by analyzing cocitations.
By manually elaborating the resulting data and considering source duplications due to slight differences in the source name, it was possible to elaborate Table 3, where the most influential sources are ordered with regards to the connection strengths evidenced by the network analysis.
Table 3. Most influential sources after manually resolving name duplications.
| Source | Total Link Strength |
|---|---|
| Transportation Research Part C | 4290 |
| Transportation Research Record | 3678 |
| IEEE Trans. Intell. Transport. Syst. | 2962 |
| Transportation Research Part B | 2151 |
| IEEE Transactions on Vehicular Technology | 1294 |
| IEEE Transactions on Intelligent Transportation Systems | 947 |
| Journal of Transportation Engineering | 750 |
| IET Intelligent Transport Systems | 685 |
| Org. Lett. | 644 |
| Intelligent Transportation Systems (itsc) | 618 |
| J. Am. Chem. Soc. | 579 |
| Chem. Commun. | 530 |
| Physica A | 460 |
| Sensors | 408 |
The cocitation analysis of authors was carried out by establishing a minimum threshold of 20 citations for an author; in this way, 195 authors were selected. The resulting network is visualized in Figure 5, where the dimension of a node shows the total link strength of that node as an index of relevance in the network and the vicinity of two nodes shows the connection in terms of cocitations.
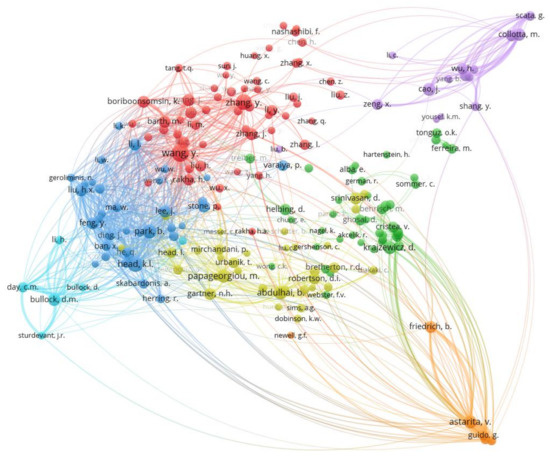
Figure 5. Author visualization of database list “A” obtained by analyzing cocitations.
It must be noted that the cocitation analysis visualization of Figure 7 shows a well-connected network, while the reference analysis reported in Figure 4 and Figure 5 shows a poorly connected network; this means that the main authors in the field are connected in terms of citations among each other, while the specific research papers with high relevance are not connected. This incongruence shows that the more important works have been published without cross-referencing, and this is possibly an indication of a new field of research that might be in an embryonic state.
Table 4 shows the list of most influential authors based on the connection strengths evidenced by the network analysis.
Table 4. Most influential authors after manually resolving name duplications.
| Rank | Author | Weight (Total Link Strength) |
|---|---|---|
| 1 | Brian Park | 5284 |
| 2 | Yibing Wang | 4701 |
| 3 | K. Larry Head | 4089 |
| 4 | Vittorio Astarita | 3255 |
| 5 | Li Li | 3219 |
| 6 | Yiheng Feng | 3123 |
| 7 | Henry Liu | 3018 |
| 8 | Xuegang (Jeff) Ban | 2648 |
| 9 | Joyoung Lee | 2461 |
| 10 | Darcy M. Bullock | 2457 |
| 11 | Markos Papageorgiou | 2411 |
| 12 | Baher Abdulhai | 2221 |
| 13 | Giuseppe Guido | 2187 |
| 14 | Jun Zhang | 2001 |
4. Country Analysis Based on Coauthorship
The dispersed nature of the field of traffic signal control methods and experiments based on CAs and FCD does not make it easy for a single paper or author to establish a definitive result. For this reason, in this section, we investigate potential collaborations among researchers of different countries by using country coauthorship analysis. An assessment of research exchanges and development between countries and the single-country contributions was conducted by setting a minimum number of considered documents from a given country to 10. Among 79 countries, 18 countries meet the threshold; among these 18 countries, 17 countries are connected and shown in Figure 6, where the dimension of the circles represents the number of documents for each given country. In Table 5, the 17 more active countries are listed in order of citations.
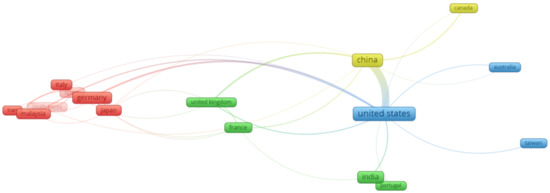
Figure 6. Country visualization of database list “A” obtained by analyzing coauthorship.
Table 5. Most influential countries.
| Rank | Country | Documents | Citations |
|---|---|---|---|
| 1 | United States | 151 | 2639 |
| 2 | China | 123 | 845 |
| 3 | Germany | 56 | 513 |
| 4 | Japan | 34 | 468 |
| 5 | Spain | 22 | 316 |
| 6 | Taiwan | 16 | 278 |
| 7 | Italy | 29 | 268 |
| 8 | United Kingdom | 19 | 260 |
| 9 | India | 85 | 255 |
| 10 | France | 20 | 251 |
| 11 | South Korea | 19 | 131 |
| 12 | Canada | 17 | 119 |
| 13 | Malaysia | 20 | 77 |
| 14 | Iran | 13 | 62 |
| 15 | Australia | 11 | 54 |
| 16 | Portugal | 10 | 45 |
| 17 | Netherlands | 11 | 41 |
5. Trending Topics: Overlay Visualization Analysis
We used the overlay visualization feature of VOSviewer to generate a map of the newest vs. oldest topics. We proceeded by doing a text-mining analysis on all titles and abstract words analogous to the one carried out in the section on topic visualization, but with a threshold of 20 concurrencies for each term; then, for the 148 terms, a relevance score was calculated. Based on this score, only the top 60% of most relevant terms were selected (this is a standard feature of VOSviewer and was adopted in preceding scientific papers, so we adopted this value to conform to what appears to be a de facto standard), resulting in a total of 89 terms that are mapped in Figure 7. In order to identify trending terms, the terms were evaluated on the basis of the publication year of the papers from which they are mined. For every term, an average value of publication year was obtained, and this value is visualized with a blue color for older topics and a red color for trending topics. It must be noted that with this more selective choice of topics, the following three terms resulted as the more relevant: adaptive traffic signal control, smartphone and connected vehicle. Among the trending topics, the following terms were identified as the more trending: connected vehicle, autonomous vehicle, internet, accuracy, traffic system, travel time, experiment, VANET, emission and v2I.
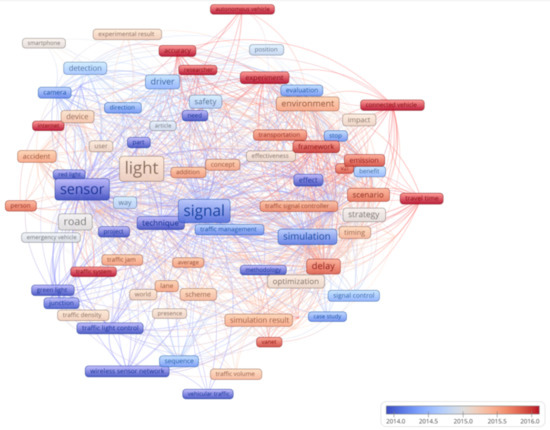
Figure 7. Trending topics (in red) versus old topics (in blue).
These words are just the outcome of a standard VOSviewer overlay visualization analysis and show a tendency of words to appear or disappear among titles and abstracts over time. The trending topics are trending among the selected papers, and the emerging terms such as internet and connected vehicles can be explained with the emerging connectivity that is a recent characteristic of new connected traffic signal systems.
References
- Schubert, R.; Schlingelhof, M.; Cramer, H.; Wanielik, G. Accurate positioning for vehicular safety applications-The SAFESPOT approach. In Proceedings of the 65th IEEE Vehicular Technology Conference (VTC2007-Spring), Dublin, Ireland, 22–25 April 2007.
- Benmimoun, M.; Zlocki, A.; Eckstein, L. Advanced Driver Assistance Systems: Benefit Evaluation Method and User Acceptance for Adaptive Cruise Control and Collision Warning System. In Proceedings of the Transportation Research Board 91st Annual Meeting, Washington DC, USA, 22–26 January 2012.
- Stahlmann, R.; Festag, A.; Tomatis, A.; Radusch, I.; Fischer, F. Starting European Field Tests for Car-2-X Communication: The Drive C2X Framework. In Proceedings of the 18th ITS World Congress and Exhibition, Orlando, FL, USA, 16–20 October 2011.
- Marzano, V.; Tocchi, D.; Papola, A.; Aponte, D.; Simonelli, F.; Cascetta, E. Incentives to freight railway undertakings compensating for infrastructural gaps: Methodology and practical application to Italy. Transp. Res. Part A Policy Pract. 2018.
- Astarita, V.; Florian, M.; Musolino, G. A microscopic traffic simulation model for the evaluation of toll station systems. In Proceedings of the IEEE Conference on Intelligent Transportation Systems, Oakland, CA, USA, 25–29 August 2001.
- Astarita, V.; Giofré, V.; Guido, G.; Vitale, A. Investigating road safety issues through a microsimulation model. Procedia Soc. Behav. Sci. 2011, 20, 226–235.
- Young, W.; Sobhani, A.; Lenné, M.G.; Sarvi, M. Simulation of safety: A review of the state of the art in road safety simulation modelling. Accid. Anal. Prev. 2014.
- Astarita, V.; Giofré, V.P. From traffic conflict simulation to traffic crash simulation: Introducing traffic safety indicators based on the explicit simulation of potential driver errors. Simul. Model. Pract. Theory 2019, 94, 215–236.
- Osorio, C.; Punzo, V. Efficient calibration of microscopic car-following models for large-scale stochastic network simulators. Transp. Res. Part B Methodol. 2019, 119, 156–173.
- Martinez, F.J.; Toh, C.K.; Cano, J.C.; Calafate, C.T.; Manzoni, P. A survey and comparative study of simulators for vehicular ad hoc networks (VANETs). Wirel. Commun. Mob. Comput. 2011, 11, 813–828.
- Gentile, G. New formulations of the stochastic user equilibrium with logit route choice as an extension of the deterministic model. Transp. Sci. 2018, 52, 1531–1547.
- Gentile, G. Solving a Dynamic User Equilibrium model based on splitting rates with Gradient Projection algorithms. Transp. Res. Part B Methodol. 2016, 92, 120–147.
- Cantarella, G.E.; Di Febbraro, A.; Di Gangi, M.; Giannattasio, O. Stochastic Multi-Vehicle Assignment to Urban Transportation Networks. In Proceedings of the 6th International Conference on Models and Technologies for Intelligent Transportation Systems (MT-ITS), Cracow, Poland, 5–7 June 2019.
- Cantarella, G.E.; Watling, D.P. A general stochastic process for day-to-day dynamic traffic assignment: Formulation, asymptotic behaviour, and stability analysis. Transp. Res. Part B Methodol. 2016, 92, 3–21.
- Trozzi, V.; Gentile, G.; Kaparias, I.; Bell, M.G.H. Effects of Countdown Displays in Public Transport Route Choice Under Severe Overcrowding. Networks Spat. Econ. 2015, 15, 823–842.
- Kucharski, R.; Gentile, G. Simulation of rerouting phenomena in Dynamic Traffic Assignment with the Information Comply Model. Transp. Res. Part B Methodol. 2018, 126, 414–441.
- Marzano, V.; Papola, A.; Simonelli, F.; Papageorgiou, M. A Kalman Filter for Quasi-Dynamic o-d Flow Estimation/Updating. IEEE Trans. Intell. Transp. Syst. 2018, 19, 3604–3612.
- Papola, A.; Tinessa, F.; Marzano, V. Application of the Combination of Random Utility Models (CoRUM) to route choice. Transp. Res. Part B Methodol. 2018, 111, 304–326.
- Papola, A. A new random utility model with flexible correlation pattern and closed-form covariance expression: The CoRUM. Transp. Res. Part B Methodol. 2016, 94, 80–96.
- Astarita, V.; Florian, M. The use of mobile phones in traffic management and control. In Proceedings of the IEEE Intelligent Transportation Systems (Cat. No.01TH8585), Oakland, CA, USA, 25–29 August 2001; pp. 10–15.
- Astarita, V.; Bertini, R.L.; d’Elia, S.; Guido, G. Motorway traffic parameter estimation from mobile phone counts. Eur. J. Oper. Res. 2006, 175, 1435–1446.
- Barceló, J.; Montero, L.; Marqués, L.; Carmona, C. Travel Time Forecasting and Dynamic Origin-Destination Estimation for Freeways Based on Bluetooth Traffic Monitoring. Transp. Res. Rec. J. Transp. Res. Board 2010, 2175, 19–27.
- Barceló, J.; Montero, L.; Bullejos, M.; Serch, O.; Carmona, C. A kalman filter approach for exploiting bluetooth traffic data when estimating time-dependent od matrices. J. Intell. Transp. Syst. Technol. Planning Oper. 2013, 17, 123–141.
- Guido, G.; Vitale, A.; Saccomanno, F.F.; Festa, D.C.; Astarita, V.; Rogano, D.; Gallelli, V. Using Smartphones as a Tool to Capture Road Traffic Attributes. Appl. Mech. Mater. 2013, 432, 513–519.
- Guido, G.; Gallelli, V.; Saccomanno, F.; Vitale, A.; Rogano, D.; Festa, D. Treating uncertainty in the estimation of speed from smartphone traffic probes. Transp. Res. Part C Emerg. Technol. 2014, 47, 100–112.
- Salin, H. Gap Analysis in Cooperative Systems within Intelligent Transportation Systems. Master’s Thesis, Royal Institute of Technology, Stockholm, Sweden, 2012.
- Herrera, J.C.; Work, D.B.; Herring, R.; Ban, X.J.; Jacobson, Q.; Bayen, A.M. Evaluation of traffic data obtained via GPS-enabled mobile phones: The Mobile Century field experiment. Transp. Res. Part C Emerg. Technol. 2010, 18, 568–583.
- Chen, W.J.; Chen, C.H.; Lin, B.Y.; Lo, C.C. A traffic information prediction system based on Global Position System-equipped probe car reporting. Adv. Sci. Lett. 2012, 16, 117–124.
- Zhou, X.; Wang, W.; Yu, L.; Zhou, X.; Yu, Á.L.; Wang, W.; Lu, W. Traffic Flow Analysis and Prediction Based on GPS Data of Floating Cars. In Lecture Notes in Electrical Engineering, Proceedings of the 2012 International Conference on Information Technology and Software Engineering, Beijing, China, 8–10 December 2012; Springer: Berlin/Heidelberg, Germany, 2012; pp. 497–508.
- Guido, G.; Vitale, A.; Astarita, V.; Saccomanno, F.; Giofré, V.P.; Gallelli, V. Estimation of Safety Performance Measures from Smartphone Sensors. Procedia Soc. Behav. Sci. 2012, 54, 1095–1103.
- Bierlaire, M.; Chen, J.; Newman, J.P. Modeling Route Choice Behavior from Smartphone GPS Data; Report TRANSP-OR 101016; Transport and Mobility Laboratory: Lausanne, Switzerland, 16 October 2010.
- Händel, P.; Ohlsson, J.; Ohlsson, M.; Skog, I.; Nygren, E. Smartphone-based measurement systems for road vehicle traffic monitoring and usage-based insurance. IEEE Syst. J. 2014, 8, 1238–1248.
- Astarita, V.; Caruso, M.V.; Danieli, G.; Festa, D.C.; Giofrè, V.P.; Iuele, T.; Vaiana, R. A Mobile Application for Road Surface Quality Control: UNIquALroad. Procedia Soc. Behav. Sci. 2012, 54, 1135–1144.
- Vaiana, R.; Iuele, T.; Astarita, V.; Caruso, M.V.; Tassitani, A.; Zaffino, C.; Giofrè, V.P. Driving behavior and traffic safety: An acceleration-based safety evaluation procedure for smartphones. Mod. Appl. Sci. 2014, 8, 88.
- Astarita, V.; Guido, G.; Mongelli, D.; Giofrè, V.P. A co-operative methodology to estimate car fuel consumption by using smartphone sensors. Transport 2015, 30, 307–311.
- Hu, J.; Fontaine, M.D.; Park, B.B.; Ma, J. Field evaluations of an adaptive traffic signal—using private-sector probe data. J. Transp. Eng. 2015, 142, 04015033.
- Axer, S.; Pascucci, F. Estimation of traffic signal timing data and total delay for urban intersections based on low frequency floating car data. In Proceedings of the 6th TUM 2015 International Scientific Conference on Mobility and Transport, Technologies, Solutions and Perspectives for Intelligent Transport Systems, Munich, Germany, 30 June–1 July 2015.
- Axer, S.; Friedrich, B. Estimating signal phase and timing for traffic actuated intersections based on low frequency floating car data. In Proceedings of the 19th IEEE International Conference on Intelligent Transportation Systems (ITSC), Rio de Janeiro, Brazil, 1–4 November 2016.
- Axer, S.; Friedrich, B. Level of service estimation based on low-frequency floating car data. Transp. Res. Procedia 2014, 3, 1051–1058.
- Saust, F.; Bley, O.; Kutzner, R.; Wille, J.M.; Friedrich, B.; Maurer, M. Exploitability of vehicle related sensor data in cooperative systems. In Proceedings of the 13th IEEE Conference on Intelligent Transportation Systems, Funchal, Portugal, 19–22 September 2010.
- Astarita, V.; Giofrè, V.P.; Guido, G.; Vitale, A. The use of adaptive traffic signal systems based on floating car data. Wirel. Commun. Mob. Comput. 2017, 2017, 1–13.
- Bellavista, P.; Foschini, L.; Zamagni, E. V2X Protocols for low-penetration-rate and cooperative traffic estimations. In Proceedings of the 2014 IEEE 80th Vehicular Technology Conference, Vancouver, BC, Canada, 14–17 September 2014.
- Krajzewicz, D.; Heinrich, M.; Milano, M. COLOMBO: Investigating the Potential of V2X for Traffic Management Purposes assuming low penetration Rates. In Proceedings of the 9th ITS European Congress, Dublin, Ireland, 4–7 June 2013.
- Astarita, V.; Vincenzo Pasquale, G.; Guido, G.; Vitale, A. A Single Intersection Cooperative-Competitive Paradigm in Real Time Traffic Signal Settings Based on Floating Car Data. Energies 2019, 12, 409.
- Astarita, V.; Festa, D.C.; Vincenzo, G. Cooperative-competitive paradigm in traffic signal synchronization based on floating car data. In Proceedings of the 2018 IEEE International Conference on Environment and Electrical Engineering and 2018 IEEE Industrial and Commercial Power Systems Europe (EEEIC/I&CPS Europe), Palermo, Italy, 12–15 June 2018; pp. 1–6.
- Gradinescu, V.; Gorgorin, C.; Diaconescu, R.; Cristea, V.; Iftode, L. Adaptive traffic lights using car-to-car communication. In Proceedings of the IEEE 65th Vehicular Technology Conference (VTC2007-Spring), Dublin, Ireland, 22–25 April 2007; pp. 21–25.
- Alvarez, I.; Poznyak, A.; Malo, A. Urban traffic control problem a game theory approach. In Proceedings of the IEEE Conference on Decision and Control, Coral Beach, Cancun, Mexico, 9–11 December 2008; pp. 2168–2172.
- Tan, L.; Zhao, X.; Hu, D.; Shang, Y.; Wang, R. A study of single intersection traffic signal control based on two-player cooperation game model. In Proceedings of the 2010 WASE International Conference on Information Engineering, Beidai, China, 14–15 August 2010.
- Abdelghaffar, H.M.; Yang, H.; Rakha, H.A. Isolated traffic signal control using a game theoretic framework. In Proceedings of the 2016 IEEE 19th Conference on Intelligent Transportation Systems (ITSC), Rio de Janeiro, Brazil, 1–4 November 2016; pp. 1496–1501.
- Van Eck, N.J.; Waltman, L.; Noyons, E.C.M.; Buter, R.K. Automatic term identification for bibliometric mapping. Scientometrics 2010, 82, 581–596.
- Abdulhai, B.; Pringle, R.; Karakoulas, G. Reinforcement learning for true adaptive traffic signal control. J. Transp. Eng. 2003, 129, 278–285.
- Asadi, B.; Vahidi, A. Predictive Cruise Control: Utilizing Upcoming Traffic Signal Information for Improving Fuel Economy and Reducing Trip Time. IEEE Trans. Control. Syst. Technol. 2011, 19, 707–714.
- Chen, Y.; Zhang, C.; Li, K. Enhanced eco-driving system based on V2X communication. In Proceedings of the 15th International IEEE Conference on Intelligent Transportation Systems, Anchorage, AK, USA, 16–19 September 2012; pp. 200–205.
- Rakha, H.; Kamalanathsharma, R.K. Eco-driving at signalized intersections using V2I communication. In Proceedings of the 14th International IEEE Conference on Intelligent Transportation Systems (ITSC), Washington, DC, USA, 5–7 October 2011; pp. 341–346.
- Kiencke, U.; Nielsen, L. Automotive Control Systems; Springer: Berlin/Heidelberg, Germany, 2005.
- Lavalle, S.M. Planning Algorithms; Cambridge University Press: Cambridge, UK, 2006.
- Wahl, H.; Holzäpfel, M.; Gauterin, F. Approximate dynamic programming methods applied to far trajectory planning in optimal control. In Proceedings of the 2014 IEEE Intelligent Vehicles Symposium, Dearborn, MI, USA, 8–11 June 2014; pp. 1085–1090.
- Xia, H.; Boriboonsomsin, K.; Schweizer, F.; Winckler, A.; Zhou, K.; Zhang, W.-B.; Barth, M. Field operational testing of ECO-approach technology at a fixed-time signalized intersectio. In Proceedings of the 2012 15th International IEEE Conference on Intelligent Transportation Systems, Anchorage, AK, USA, 16–19 September 2012; pp. 188–193.
- Feng, Y.; Head, K.L.; Khoshmagham, S.; Zamanipour, M. A real-time adaptive signal control in a connected vehicle environment. Transp. Res. Part C Emerg. Technol. 2015, 55, 460–473.
- Arnold, J. Traffic Guidance System, Mitsubishi International GmbH. U.S. Patent No. US006418371B1, 9 July 2002.
- Rahman, M.R. Method for controlling traffic, Intel Corporation. U.S. Patent No US-0129285, 5 August 1998.
- Lee, J.; Park, B. Development and Evaluation of a Cooperative Vehicle Intersection Control Algorithm Under the Connected Vehicles Environment. IEEE Trans. Intell. Transp. Syst. 2012, 13, 81–90.
- Zhao, J.; Li, W.; Wang, J.; Ban, X. Dynamic Traffic Signal Timing Optimization Strategy Incorporating Various Vehicle Fuel Consumption Characteristics. IEEE Trans. Veh. Technol. 2016, 65, 3874–3887.
- Diakaki, C.; Papageorgiou, M.; Aboudolas, K. A multivariable regulator approach to traffic-responsive network-wide signal control. Control. Eng. Pract. 2002, 10, 183–195.
- Mirchandani, P.; Head, L. A real-time traffic signal control system: Architecture, algorithms, and analysis. Transp. Res. Part C: Emerg. Technol. 2001, 9, 415–432.
More
Information
Subjects:
Engineering, Civil
Contributor
MDPI registered users' name will be linked to their SciProfiles pages. To register with us, please refer to https://encyclopedia.pub/register
:
View Times:
1.2K
Revisions:
3 times
(View History)
Update Date:
07 Jul 2021
Notice
You are not a member of the advisory board for this topic. If you want to update advisory board member profile, please contact office@encyclopedia.pub.
OK
Confirm
Only members of the Encyclopedia advisory board for this topic are allowed to note entries. Would you like to become an advisory board member of the Encyclopedia?
Yes
No
${ textCharacter }/${ maxCharacter }
Submit
Cancel
Back
Comments
${ item }
|
More
No more~
There is no comment~
${ textCharacter }/${ maxCharacter }
Submit
Cancel
${ selectedItem.replyTextCharacter }/${ selectedItem.replyMaxCharacter }
Submit
Cancel
Confirm
Are you sure to Delete?
Yes
No


