 +1 credit
| Version | Summary | Created by | Modification | Content Size | Created at | Operation |
|---|---|---|---|---|---|---|
| 1 | Kenta Watanabe | + 5414 word(s) | 5414 | 2020-06-15 05:24:38 | | | |
| 2 | Camila Xu | -2 word(s) | 5412 | 2020-06-15 10:00:39 | | | | |
| 3 | Camila Xu | -2 word(s) | 5412 | 2020-06-15 10:15:30 | | | | |
| 4 | Camila Xu | -375 word(s) | 5037 | 2020-10-29 06:42:46 | | |
Video Upload Options
Sugarcane is a glycophyte, which is fairly sensitive to salt stress, and it is known that applications of saline water adversely affect sugarcane yields and qualities.
1. Introduction
Salt stress is a major factor limiting crop productivity in arid and semi-arid regions. Most crops are sensitive to salinity that is caused by high concentrations of salts in the soil [1]. Apart from natural salinity, a significant proportion of newly cultivated agricultural land has become saline due to inappropriate irrigation, which causes water tables to rise and salt to build up in the root zone [2]. According to the Food and Agriculture Organization (FAO), 45 million ha, which accounts for 19.5% of global irrigated lands, are salt-affected soils [3]. The cost of soil salinization on agriculture is estimated to be US$ 12 billion per year, and this value is expected to further increase [4].
In Japan, sugarcane is only commercially cultivated on the Nansei Islands in southwestern Japan. The islands are located at 24–31 °N latitude and 123–131 °E longitude and mostly belong to a subtropical climate zone [5]. Although the Japanese sugar industry is considered small with an annual sugarcane production of 1.2 million tons, when compared to global sugarcane production which is 1.9 billion tons in total [6], it is one of the most important agricultural products in this region due to its great impact on the economy. The sugarcane yield in the region fluctuates year by year due to summer typhoons that could bring certain amounts of rainfall but seriously damage the sugarcane. Furthermore, since precipitation is concentrated in the rainy season and at typhoons, water resources are relatively scarce on the islands. The sugarcane is also frequently exposed to drought in the summer, thereby resulting in substantial yield reductions. Given that sugarcane is a high biomass-yielding crop that requires a considerable amount of water, efficient irrigation management is essential for successful and sustainable sugarcane production.
Sugarcane is a glycophyte, which is fairly sensitive to salt stress [7], and it is known that applications of saline water adversely affect sugarcane yields and qualities. For instance, yield reduction by salt stress was found to be up to nearly 50% at soil electrical conductivity (EC) of 7 dS m−1 [8]. In terms of quality, each dS mm−1 increase in soil EC decreased Brix and Pol in juice by about 0.6% [9]. Response to increased salinity also involved physiological changes such as reductions of net photosynthetic rate and maximum quantum yield of photosystem II in leaves treated with 200 mM NaCl [10][11]. Whereas various studies have been conducted under field and pot conditions in countries overseas, few studies regarding the effects of salt stress on sugarcane have been conducted in Japan, since salinity is not considered to be a serious problem. However, our previous survey demonstrated that Na+ and Cl− were the primary salts present in irrigation waters collected from Japanese sugarcane growing areas and the total salt concentrations ranged widely from below 100 to above 2500 mg L−1 [12]. Waters containing 1500 to 7000 mg salt L−1 are classified as moderately saline [3], indicating that the observed salt concentrations are not high enough to cause fatal damage to sugarcane, but the yield and quality along with photosynthetic efficiency may become reduced to some extent due to salt stress. Considering the increasing demand for irrigation in sugarcane production, further study on the effects of salt on sugarcane in Japan is becoming increasingly imperative.
Another factor to consider regarding salt stress is its effect on nutrient compositions in sugarcane. Under salt stress, plants maintain a high concentration of K+ and a low concentration of Na+ in the cytosol [13], and the ability to maintain a high cytosolic K+/Na+ ratio enhances salinity tolerance in plants [14][15]. In sugarcane, the addition of potassium to saline growth medium has significantly improved dry matter production [16]. However, Watanabe et al. reported that sugarcane production areas with high K+ concentrations in sugarcane juice tended to have low sucrose concentrations [17]. This difference may be partially explained by variations in irrigation water quality which also affects juice nutrient components including both Na+ and K+.
In this entry, sugarcane was grown with saline irrigation waters differing in NaCl concentration levels under pot conditions to examine the effects of saline on the growth and juice quality and find an applicable salinity range of irrigation water. Additionally, photosynthesis processes, including gas exchange and chlorophyll fluorescence parameters, as well as sugar and nutrient compositions in leaf and juice, were analyzed to observe the physiological changes in response to salt stress and their relationships with the agronomic traits.
2. Materials and Methods
2.1. Growth Conditions
This study comprised two experiments (Exp. 1: November 1, 2015–July 14, 2016; Exp. 2: August 5, 2016–March 15, 2017) which were conducted in greenhouses at the University of the Ryukyus in Okinawa, Japan (26°25’ N, 127°77’ E, 125 m a.s.l). The most common sugarcane cultivar (Saccharum spp. cv. NiF8) [18,19] was used for the experiments. Stalks of NiF8 were collected from an experimental field of the university and cut into single bud seedlings. The seedlings were grown in containers for about a month. After the first leaves were fully expanded, the seedlings were transplanted into 1/5000a Wagner pots filled with a soil mixture composed of red dark clay soil (Shimajiri mahji), sea sand, and peat moss (1:1:1 on a volume basis). Irrigation was performed when the pot-soil surface became dry so that plants showed no symptoms of drought stress. Until saline irrigation water treatments were initiated, all plants were irrigated with equal amounts of tap water (Na+, 19; K+, 1; Mg2+, 3; Ca2+, 9; Cl−, 29; PO43−, 0; SO42−, 8 mg L−1). Fertilization was performed once a week after transplantation using a modified Hoagland solution containing 6 mM Ca(NO3)2, 4 mM KNO3, 2 mM KH2PO4, 2 mM MgSO4, 100 mM C10H12FeN2NaO8, 25 mM H 3BO3, 10 mM MnSO4, 2 mM ZnSO4, 0.5 mM CuSO4, and 0.5 mM H2MoO4.
2.2. Saline Irrigation Water Treatment
The sugarcane plants were treated with saline irrigation water from April 27, 2016, in Exp. 1 and from November 1, 2016, in Exp. 2 until termination of the experiments. Six groups treated with 0, 200, 500, 1000, 2000, and 3000 mg NaCl L−1 were established, and four plants were prepared for each group. Irrigation was performed based on the dryness of the 0 mg NaCl L−1 group, and all the groups were supplied with equal amounts of water. The Hoagland solution was continuously applied once a week but using the saline irrigation waters. The total amounts of water applied during the treatment periods were 32 L in Exp. 1 and 18.5 L in Exp. 2, respectively. The mean values of air temperature, relative humidity, and solar radiation during the treatment periods were 28.85 °C, 79.42%, and 9.84 MJ m−2 day−1 in Exp. 1 and 21.35 °C, 69.20%, and 4.91 MJ m−2 day−1 in Exp. 2, respectively. Additionally, solely in Exp. 1, EC of pot soil for each group was recorded with soil sensors (5TE, Decagon Devices Inc.) from June 7 to July 6, 2016.
2.3. Photosynthesis Measurement
In Exp. 1, gas exchange measurements were performed on the top visible dewlap leaves via a portable photosynthesis system (LI-6400XT, Li-Cor Inc.) equipped with a 2 × 3 cm leaf chamber (Li-Cor Inc.). Flow rate, atmospheric CO2 concentration, and photosynthetic photon flux density were set at 400 mmol s−1, 400 mmol mol−1, and 2000 mmol m−2 s−1, respectively. Calculated leaf temperature and vapor pressure deficit based on leaf temperature were regulated to be within the ranges of 35.0 ± 2.0 °C and 2.2 ± 0.5 kPa, respectively. CO2 assimilation rate (A), transpiration rate (E), photosynthetic water use efficiency (PWUE, A/E), and stomatal conductance (gs) were recorded when steady-state photosynthesis was obtained. Then, the CO2 assimilation rate at an elevated atmospheric CO2 concentration of 2000 mmol mol−1 (A2000) was measured to calculate stomatal limitation, (A2000−A)/A2000, by referring to Long and Bernacchi [20].
Chlorophyll fluorescence measurements were performed with a leaf chamber fluorometer (Li-Cor Inc.). Minimum fluorescence (Fo) and maximum fluorescence (Fm) in the dark-adapted state were recorded before dawn, and the maximum photochemical quantum yield of photosystem II, (Fm−Fo)/Fm, was calculated. All these gas exchange and chlorophyll fluorescence measurements were conducted on April 28 (before treatment, BT), June 1–4 (one month after treatment, 1 MAT), and July 2–4 (2 months after treatment, 2 MAT).
In addition, other fluorescence parameters were measured on July 11 and 12, using the same configuration as the gas exchange measurements at 400 mmol CO2 mol−1. Minimum fluorescence (F’o) and maximum fluorescence (F’m) in the light-adapted state were recorded when a steady-state fluorescence (Fs) was obtained. Photochemical quenching (qP), non-photochemical quenching (qN), and effective photochemical quantum yield of photosystem II (ΦII) were calculated following the formulas below.
|
qP = (F’m − Fs)/(F’m − F’o), |
(1) |
|
qN = 1 – (F’m – F’o)/(Fm – Fo), |
(2) |
|
ΦII = 1 – Fs/F’m, |
(3) |
2.4. Plant Sampling
Sugarcane plants were harvested on July 14, 2016, in Exp. 1 and March 15, 2017, in Exp. 2. The plants were separated into leaf and culm with leaf sheath; thereafter, leaf area, culm height, and culm weight were measured. In Exp. 1, soil–plant analysis development (SPAD) values of the top visible dewlap leaves were recorded with a SPAD meter (SPAD-502, Minolta), and the leaves were taken around noon and oven-dried at 80 °C. Culms were squeezed with a small three-roll mill, and the obtained juices were subsequently stored in a freezer.
2.5. Juice Analysis
After thawing the juices, EC was measured with a portable conductivity meter (LAQUAtwin EC-33B, Horiba). The juice samples were then diluted 100-fold with extra-pure water and passed through 0.45 mm membrane filters (Advantec) for ion and sugar analyses. The concentrations of the major ions present in sugarcane juice (i.e., Na+, K+, Mg2+, Ca2+, Cl−, PO43−, and SO42−) were determined by ion chromatographs (ICS−1600, Thermo Fisher Scientific). The columns and eluents used for cation analysis were Ion Pac CS12 and 20 mM methane sulfonic acid solution; and those used for anion analysis were Ion Pac AS22 and a mixed solution of 4.5 mM sodium carbonate and 1 mM sodium hydrogen carbonate, respectively. Sucrose, glucose, and fructose concentrations were determined via high-pressure liquid chromatography (Shimadzu) composed of a liquid chromatograph (LC-20AD), a column oven (CTO-20A), a refractive index detector (RID−10A), and an autosampler (SIL-20A). The column and eluent used were SCR 101-H and degassed extra-pure water, respectively.
2.6. Leaf Analysis
The dried leaves were ground, and 250 mg of each sample was extracted with 50 mL of extra-pure water at 80 °C overnight. Filtrates passed through 0.45 mm membrane filters (Advantec) were used for ion and sugar analyses following the same procedures as the juice analysis.
2.7. Statistical Analysis
All statistical analyses were performed using the software R [21]. The means and standard errors (SE) of each group were calculated, and data were subjected to a one-way analysis of variance between the groups. When significances were found, the Tukey test was applied. Pearson’s correlation analysis was used to determine the significance of the relationships between parameters. Results with a p-value < 0.05 were considered significant.
3. Results
3.1. Soil EC
Soil EC was markedly increased by the saline irrigation water treatments, although the differences between the 0 and 200 mg NaCl L−1 groups and between the 2000 and 3000 mg NaCl L−1 groups were comparably small (Figure 1). The mean values of soil EC during the measurement period were, in ascending order of NaCl levels, 28, 53, 172, 252, 337, and 327 mS m−1, respectively.
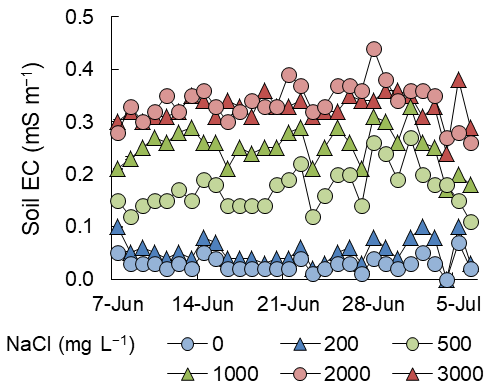
Figure 1. Changes in soil EC from June 7 to July 6, 2016, in Exp. 1 (n = 1).
3.2. Photosynthesis
A was 33.3 mmol m−2 s−1 before initiating the saline irrigation water treatments and increased to 40 mmol m−2 s−1 at 1 MAT, except in the 2000 and 3000 mg NaCl L−1 groups (Figure 2). At 2 MAT, A showed a decreasing trend with increasing NaCl levels in irrigation water. Whereas the 0 mg NaCl L−1 group maintained a relatively high A, the 3000 mg NaCl L−1 group exhibited a low rate of around 20 mmol m−2 s−1. Similar tendencies were observed in E and gs; however, the differences among the treatments were greater than in A, and the 3000 mg NaCl L−1 group showed distinctly low values. PWUE, calculated based on A and E, was high in the 3000 mg NaCl L−1 group and low in the 0 mg NaCl L−1 group at both 1 and 2 MAT. The treatment effects on stomatal limitation were not very clear as compared to those on the above-mentioned parameters, but the groups irrigated with low NaCl levels (i.e., the 0 mg NaCl L−1 group) tended to have small values. (Fm – Fo)/Fm was not significantly different among the treatments.
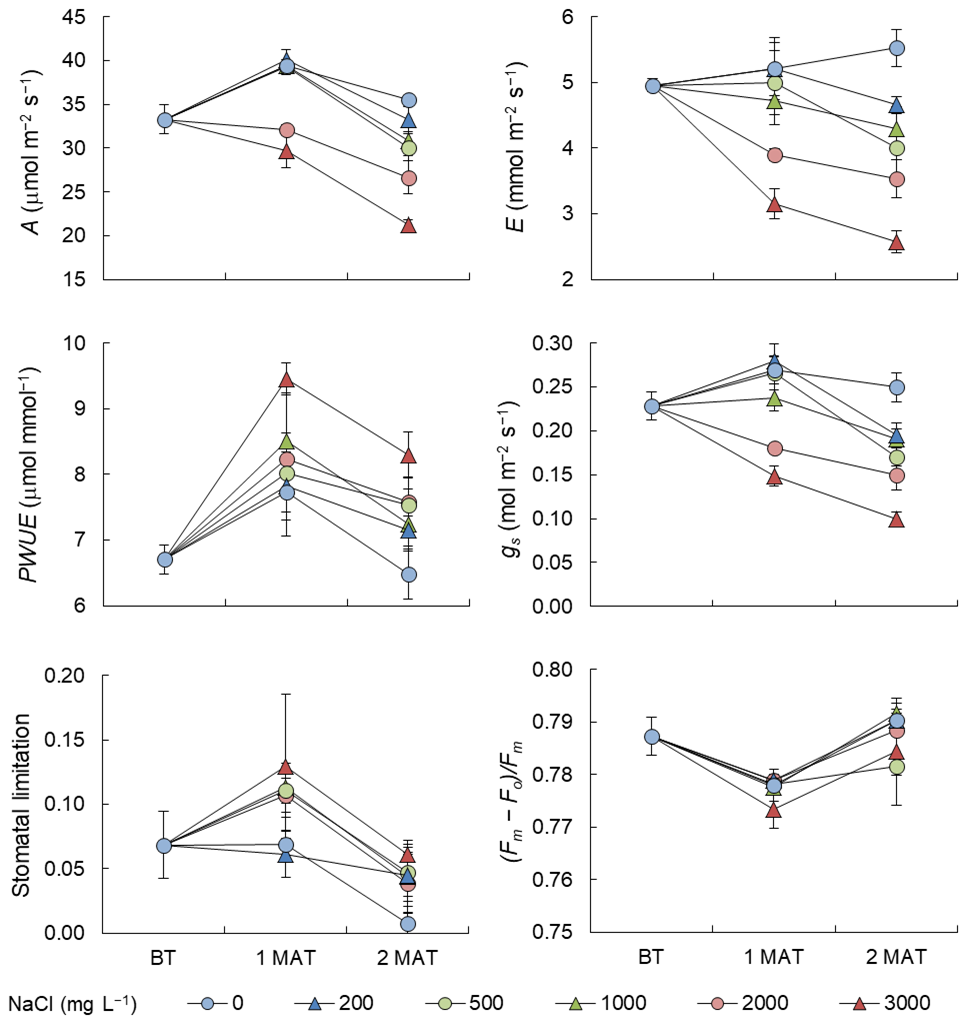
Figure 2. Changes in photosynthetic parameters at each stage (before treatment, BT; one month after treatment, 1 MAT; 2 months after treatment, 2 MAT) in Exp. 1. Bars represent SE of the means (n = 4).
Figure 3 illustrates the relationship between gs ranging from 0.08 to 0.32 mol m−2 s−1, and A ranging from 19.2 to 43.2 mmol m−2 s−1. Irrespective of the growth stages, these two parameters were highly positively correlated, and the relationship for the overall samples was significant at the 0.1% level with a correlation coefficient (r) of 0.898.
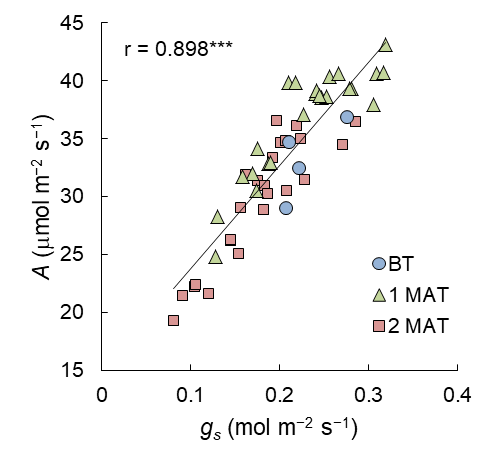
Figure 3. Relationship between gs and A at each stage (before treatment, BT; one month after treatment, 1 MAT; 2 months after treatment, 2 MAT) in Exp. 1. The linear trendline and r value for the overall samples are shown in the graph. *** denotes significance at the 0.1% level.
The saline irrigation water treatments also tended to decrease some fluorescence parameters. qP and ΦII in the 2000 and 3000 mg NaCl L−1 groups were particularly lower as compared to the other groups, while qN was not distinctly changed (Table 1).
Table 1. Effects of NaCl levels in irrigation water on chlorophyll fluorescence parameters in Exp. 1.
|
NaCl |
qP |
qN |
ΦII |
|||
|
(mg L−1) |
||||||
|
0 |
0.392 |
a |
0.789 |
a |
0.162 |
a |
|
200 |
0.364 |
ab |
0.775 |
a |
0.159 |
a |
|
500 |
0.365 |
ab |
0.792 |
a |
0.153 |
ab |
|
1000 |
0.382 |
ab |
0.798 |
a |
0.160 |
a |
|
2000 |
0.316 |
bc |
0.766 |
a |
0.138 |
ab |
|
3000 |
0.283 |
c |
0.778 |
a |
0.121 |
b |
Values with different letters in each column are significantly different (n = 4, Tukey, p < 0.05).
3.3. Growth
In Exp. 1, the 2000 and 3000 mg NaCl L−1 groups had lower culm heights than the others, and a significant difference was confirmed between the 200 and 3000 mg NaCl L−1 groups (Table 2). Culm weight was highest in the 0 mg NaCl L−1 group and low in the 2000 and 3000 mg NaCl L−1 groups. The increasing NaCl levels linearly decreased the leaf area from 3396 cm2 in the 0 mg NaCl L−1 group to 2216 cm2 in the 3000 mg NaCl L−1. In Exp.2, greater effects of the irrigation salinity were attained, reducing culm height by 30% and reducing culm weight and leaf area nearly by half between the 0 and 3000 mg NaCl L−1 groups. The groups treated with 1000 mg NaCl L−1 or higher had significantly lower culm weights than the 0, 200, and 500 mg NaCl L−1 groups.
Table 2. Effects of NaCl levels in irrigation water on growth parameters.
|
Exp. |
NaCl |
Culm Height |
Culm Weight |
Leaf Area |
|||
|
(mg L−1) |
(cm) |
(g) |
(cm2) |
||||
|
1 |
0 |
111 |
ab |
397 |
a |
3396 |
a |
|
200 |
113 |
a |
391 |
a |
3182 |
ab |
|
|
500 |
112 |
ab |
389 |
a |
2871 |
bc |
|
|
1000 |
110 |
ab |
367 |
ab |
2729 |
d |
|
|
2000 |
101 |
ab |
303 |
bc |
2580 |
cd |
|
|
3000 |
94 |
b |
261 |
c |
2216 |
d |
|
|
2 |
0 |
71 |
a |
212 |
a |
2191 |
a |
|
200 |
68 |
a |
211 |
a |
2303 |
a |
|
|
500 |
69 |
a |
206 |
a |
1774 |
ab |
|
|
1000 |
64 |
a |
169 |
b |
1472 |
bc |
|
|
2000 |
53 |
b |
140 |
bc |
1521 |
bc |
|
|
3000 |
50 |
b |
113 |
c |
1228 |
c |
|
Values with different letters in each column within each experiment are significantly different (n = 4, Tukey, p < 0.05).
3.4. Juice Sugar and Ion Compositions
In Exp. 1, the sucrose concentration in juice increased from 12.4% in the 0 mg NaCl L−1 group to 14.3% in the 500 mg NaCl L−1 group but decreased to 11.6% in the 3000 mg NaCl L−1 group due to further additions of NaCl in irrigation water (Table 3). The sucrose concentrations in the 500 and 1000 mg NaCl L−1 groups were significantly higher than in the other groups, excluding the 200 mg NaCl L−1 group. Meanwhile, glucose and fructose concentrations were highest in the 0 mg NaCl L−1 group. The greatest total sugar concentration was recorded in the 500 mg NaCl L−1 group. In Exp. 2, on the other hand, the 0 mg NaCl L−1 group possessed the highest sucrose, glucose, and fructose concentrations and, accordingly, the highest total sugar concentration. Total sugar concentration tended to decline as the irrigation NaCl levels were raised.
Table 3. Effects of NaCl levels in irrigation water on juice sugar composition.
|
Exp. |
NaCl |
Sucrose |
Glucose |
Fructose |
Total Sugar |
||||
|
(mg L−1) |
(%) |
||||||||
|
1 |
0 |
12.40 |
bc |
0.65 |
a |
0.49 |
a |
13.54 |
bcd |
|
200 |
13.54 |
ab |
0.47 |
b |
0.38 |
ab |
14.38 |
abc |
|
|
500 |
14.30 |
a |
0.34 |
b |
0.30 |
b |
14.94 |
a |
|
|
1000 |
13.96 |
a |
0.36 |
b |
0.31 |
b |
14.63 |
ab |
|
|
2000 |
12.41 |
bc |
0.33 |
b |
0.30 |
b |
13.03 |
cd |
|
|
3000 |
11.56 |
c |
0.37 |
b |
0.36 |
ab |
12.30 |
d |
|
|
2 |
0 |
14.13 |
a |
0.48 |
a |
0.40 |
a |
15.01 |
a |
|
200 |
13.62 |
a |
0.27 |
a |
0.22 |
a |
14.12 |
ab |
|
|
500 |
12.63 |
ab |
0.32 |
a |
0.28 |
a |
13.23 |
bcd |
|
|
1000 |
11.02 |
bc |
0.19 |
a |
0.18 |
a |
11.40 |
d |
|
|
2000 |
11.31 |
bc |
0.21 |
a |
0.19 |
a |
11.71 |
cd |
|
|
3000 |
10.08 |
c |
0.27 |
a |
0.26 |
a |
10.60 |
d |
|
Values with different letters in each column within each experiment are significantly different (n = 4, Tukey, p < 0.05).
In both experiments, the saline irrigation water treatments significantly altered the ion compositions of sugarcane juice. Most ion concentrations were amplified by the treatments, with Na+, K+, and Cl− being the most significantly affected among these (Table 4). In Exp. 1, the Na+ concentration in juice markedly increased, and the 3000 mg NaCl L−1 group had a concentration ten times higher than the 0 mg NaCl L−1 group. The Cl− concentration was much higher than the Na+ concentration but similarly increased as the irrigation NaCl levels were raised. Although the same amount of K+ was provided through irrigation, the K+ concentration was also influenced and considerably increased from 2591 mg L−1 in the 0 mg NaCl L−1 group to 4495 mg L−1 in the 3000 mg NaCl L−1 group. The PO43− concentration also noticeably increased, but the differences were not significant. Because of the increments in these ions, the total ion concentration nearly doubled between the 0 and 3000 mg NaCl L−1 groups. In Exp. 2, greater treatment effects were observed in these ions, increasing Na+ from 30 to 728 mg L−1, K+ from 3151 to 5854 mg L−1, Cl− from 1075 to 5248 mg L−1, and consequently the total ion concentration from 6.5 to 14.8 g L−1. EC was also linearly elevated with increasing NaCl levels in both experiments.
Table 4. Effects of NaCl levels in irrigation water on juice ion composition.
|
Exp. |
NaCl |
Na+ |
K+ |
Mg2+ |
Ca2+ |
Cl− |
PO43− |
SO42− |
Total Ion |
EC |
|||||||||
|
(mg L−1) |
(mg L−1) |
(g L−1) |
(mS m−1) |
||||||||||||||||
|
1 |
0 |
40 |
c |
2591 |
e |
352 |
a |
319 |
a |
1216 |
e |
154 |
a |
1295 |
a |
6.0 |
d |
635 |
e |
|
200 |
91 |
bc |
3413 |
de |
423 |
a |
375 |
a |
2128 |
d |
209 |
a |
1332 |
a |
8.0 |
c |
758 |
d |
|
|
500 |
102 |
bc |
3718 |
cd |
507 |
a |
468 |
a |
2544 |
c |
246 |
a |
1465 |
a |
9.1 |
bc |
830 |
cd |
|
|
1000 |
123 |
bc |
3900 |
bc |
490 |
a |
460 |
a |
2708 |
bc |
351 |
a |
1588 |
a |
9.6 |
b |
878 |
c |
|
|
2000 |
273 |
b |
4230 |
ab |
483 |
a |
404 |
a |
3012 |
ab |
349 |
a |
1542 |
a |
10.3 |
b |
993 |
b |
|
|
3000 |
490 |
a |
4495 |
a |
495 |
a |
402 |
a |
3401 |
a |
768 |
a |
1629 |
a |
11.7 |
a |
1073 |
a |
|
|
2 |
0 |
30 |
b |
3151 |
e |
445 |
c |
359 |
ab |
1075 |
e |
457 |
b |
960 |
a |
6.5 |
e |
643 |
e |
|
200 |
90 |
b |
4037 |
d |
544 |
ab |
398 |
a |
2883 |
d |
860 |
a |
908 |
a |
9.7 |
d |
778 |
d |
|
|
500 |
133 |
b |
4585 |
cd |
527 |
abc |
366 |
ab |
3285 |
cd |
1167 |
a |
940 |
a |
11.0 |
c |
833 |
d |
|
|
1000 |
272 |
b |
5050 |
bc |
552 |
a |
401 |
a |
3748 |
c |
1011 |
a |
954 |
a |
12.0 |
bc |
913 |
c |
|
|
2000 |
555 |
a |
5279 |
ab |
466 |
bc |
319 |
b |
4379 |
b |
1004 |
a |
928 |
a |
12.9 |
b |
988 |
b |
|
|
3000 |
728 |
a |
5854 |
a |
475 |
abc |
323 |
b |
5248 |
a |
1118 |
a |
1022 |
a |
14.8 |
a |
1058 |
a |
|
Values with different letters in each column within each experiment are significantly different (n = 4, Tukey, p < 0.05).
3.5. Leaf Sugar and Ion Compositions
In addition to juice sugar composition, the saline irrigation water treatments influenced leaf sugar composition (Table 5). The maximum sucrose concentration of 52.1 mg g−1 in the 0 mg NaCl L−1 group and the minimum of 33.7 mg g−1 in the 2000 mg NaCl L−1 group were obtained. Likewise, glucose and fructose concentrations were highest in the 0 mg NaCl L−1 group and lowest in the 2000 mg NaCl L−1 group. The total sugar concentration step wisely declined with increasing NaCl levels, varying from 38.4 mg g−1 in the 2000 mg NaCl L−1 group to 61.1 mg g−1 in the 0 mg NaCl L−1 group.
Table 5. Effects of NaCl levels in irrigation water on leaf sugar composition.
|
NaCl |
Sucrose |
Glucose |
Fructose |
Total Sugar |
||||
|
(mg L−1) |
(mg g−1) |
|||||||
|
0 |
52.12 |
a |
4.79 |
a |
4.22 |
a |
61.13 |
a |
|
200 |
48.10 |
a |
4.25 |
ab |
3.46 |
a |
55.80 |
a |
|
500 |
45.50 |
ab |
2.63 |
ab |
2.64 |
a |
50.77 |
ab |
|
1000 |
42.66 |
ab |
2.50 |
ab |
3.08 |
a |
48.23 |
ab |
|
2000 |
33.68 |
b |
2.14 |
b |
2.59 |
a |
38.41 |
b |
|
3000 |
33.93 |
b |
2.51 |
ab |
2.72 |
a |
39.16 |
b |
Values with different letters in each column within each experiment are significantly different (n = 4, Tukey, p < 0.05).
A linear positive correlation was observed between A and total leaf sugar concentrations (Figure 4). The r-value was 0.734, and the relationship was determined to be statistically significant at the 0.1% level.
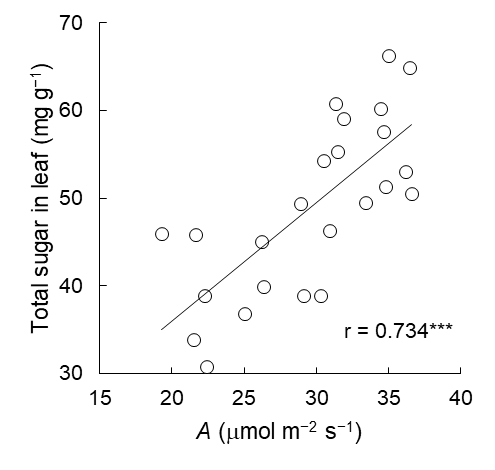
Figure 4. Relationship between A and total sugar concentration in leaf at 2 months after treatment in Exp. 1. The linear trendline and r value are shown in the graph. *** denotes significance at the 0.1% level.
As compared to the juice ion composition, the leaf ion composition was not noticeably changed by the treatments (Table 6). The Na+, Mg2+, and SO42− concentrations were not significantly different among the groups. K+ and PO43− showed upward trends with increasing NaCl levels in irrigation water, while Ca2+ showing a downward trend. The Cl− concentration in the 0 mg NaCl L−1 group was significantly lower than those in the 200, 500, and 1000 mg NaCl L−1 groups, but was not statistically different from the 2000 and 3000 mg NaCl L−1 groups. The total ion concentration was highest in the 0 mg NaCl L−1 group and lowest in the 3000 mg NaCl L−1 group, and the 0 mg NaCl L−1 group had a significantly lower concentration than the other groups. SPAD, an indicator of leaf nitrogen concentration, rose as the irrigation NaCl levels were raised.
Table 6. Effects of NaCl levels in irrigation water on leaf ion composition.
|
NaCl |
Na+ |
K+ |
Mg2+ |
Ca2+ |
Cl− |
PO43− |
SO42− |
Total Ion |
SPAD |
||||||||||
|
(mg L−1) |
(mg g−1) |
||||||||||||||||||
|
0 |
0.22 |
a |
6.83 |
c |
1.73 |
a |
2.46 |
a |
6.86 |
b |
1.01 |
c |
0.90 |
a |
20.0 |
b |
33.8 |
b |
|
|
200 |
0.22 |
a |
7.80 |
bc |
1.54 |
a |
2.25 |
ab |
8.49 |
a |
1.29 |
c |
0.77 |
a |
22.4 |
a |
35.3 |
b |
|
|
500 |
0.21 |
a |
8.03 |
bc |
1.49 |
a |
2.12 |
ab |
8.27 |
a |
1.65 |
bc |
0.71 |
a |
22.5 |
a |
37.4 |
ab |
|
|
1000 |
0.18 |
a |
7.95 |
bc |
1.71 |
a |
2.13 |
ab |
8.11 |
a |
2.39 |
ab |
1.05 |
a |
23.5 |
a |
37.5 |
ab |
|
|
2000 |
0.25 |
a |
9.59 |
ab |
1.33 |
a |
1.54 |
b |
7.32 |
ab |
2.21 |
a |
0.91 |
a |
23.1 |
a |
37.5 |
ab |
|
|
3000 |
0.20 |
a |
9.90 |
a |
1.37 |
a |
1.54 |
b |
7.46 |
ab |
2.48 |
a |
0.92 |
a |
23.9 |
a |
40.1 |
a |
|
Values with different letters in each column within each experiment are significantly different (n = 4, Tukey, p < 0.05).
3.6. Relationships between Juice EC and Growth and Quality Parameters
Juice EC was distributed from approximately 600 to 1100 mS m−1 and negatively correlated with culm weight in both experiments (Figure 5). The trendlines show that culm weight linearly decreased as juice EC increased. On the other hand, the relationships between juice EC and total sugar concentration in juice differed to some extent between Exp. 1 and 2. Even though the relationship was proved to be significantly negative, there seemed to be a peak of total sugar concentration with EC between 800 and 900 mS m−1 in Exp. 1. In contrast, increasing EC sharply reduced total sugar concentration in Exp. 2.
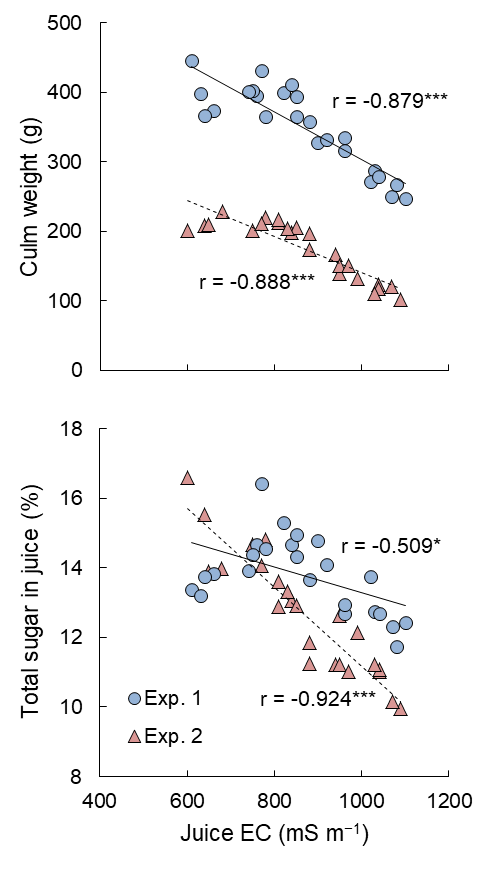
Figure 5. Relationships of juice EC with culm weight and total sugar concentration in juice. The linear trendlines for Exp.1 (solid) and Exp. 2 (broken) and r values are shown in the graphs. * and *** denote significance at the 5% and 0.1% levels, respectively.
4. Discussion
4.1. Growth and Juice Quality
In this entry, the saline irrigation water treatments lowered leaf area; however, the NaCl levels up to 500 mg L−1 did not greatly reduce culm weight and juice sugar concentration. It is likely that there is a threshold of lowered leaf area index that does not significantly affect biomass production since defoliation resulted in only small differences in total dry mass [22] and agronomic parameters [23]. Namely, the observed reduction of leaf area in the 500 mg L−1 group did not reach below the critical level to decrease the yield and quality. On the other hands, the 1000 mg NaCl L−1 group showed a statistically lower culm weight and juice sugar concentration in Exp. 2, and NaCl levels exceeding 1000 mg L−1 significantly reduced culm weight in Exp. 1 and reduced both culm weight and juice sugar concentration in Exp. 2. From these, it is suggested that sugarcane growth and quality are impaired when sugarcane is grown with 1000 mg NaCl L−1 or higher. This finding is, however, only applicable for the tested cultivar (i.e., NiF8) because there are genetic variations in the response to salinity and the critical salt concentration may differ depending on used cultivars. For instance, Wahid et al. reported that salt tolerance limit (soil EC level at which growth or yield is reduced 50%) varied considerably amongst cane lines from 8.63 dS m−1 to 15.51 dS m−1 [24]. Meanwhile, according to other literatures, Lingle et al. revealed that irrigation water EC over 2.93 dS m−1 (1370 mg salt L−1, calculated referring to Watanabe et al. [12]) caused significant reductions in sugarcane yield and juice quality [25]. Similarly, Wiedenfeld reported that sugarcane yield significantly declined using well water with an EC of 3.4 dS m−1 (1600 mg salt L−1) under field conditions [26]. Although different sugarcane cultivars and salt concentrations were used in these experiments, the findings are mostly consistent with the results of the present study. On the other hand, Mekaru et al. revealed that field-grown sugarcane irrigated with 0 to 2000 mg salt L−1 showed similar growths and yields and thus concluded that the maximum salt concentration in irrigation water is 2000 mg L−1 [27]. Moreover, Thomas et al. mentioned that, in spite of the fact that they confirmed significantly negative relationships between EC of irrigation water and sugarcane growth and yield parameters, underground water with an EC of 4 dS m−1 (1890 mg salt L−1) is readily available for irrigation since rainfall leaches salts from the ground [28]. In fields, it is difficult to control environmental factors and results may vary depending on weather and soil conditions; hence, field experiments applying different salt concentrations in irrigation water must be continuously conducted in each region.
As mentioned above, the treatment effects on juice quality differed between the two experiments, causing greater impacts on juice sugar concentration in Exp. 2. This may have resulted from the different treatment periods and the physiological characteristics of sugarcane. The plants were treated with the saline irrigation waters from April to June in Exp. 1 and from November to next March in Exp. 2 where the temperature and light intensity were much lower. Generally, photosynthetic assimilates produced in young sugarcane leaves are consumed for leaf expansion and elongation of the culm and roots, whereas photosynthates are stored in the culm in the form of sucrose when vegetative growth is suppressed by environmental factors (e.g., low temperature) [29]. Consequently, the juice quality was more severely affected by the saline irrigation water treatments in Exp. 2.
4.2. Photosynthesis
In the present study, photosynthetic efficiency including both gas exchange and chlorophyll fluorescence was significantly impaired by the saline irrigation water treatments. The 2000 and 3000 mg NaCl L−1 groups were most greatly affected, resulting in considerable reductions of A by 7.3 and 9.6 mmol m−2 s−1 at 1 MAT and by 8.8 and 14.3 mmol m−2 s−1 at 2 MAT as compared to the 0 mg NaCl L−1 group, respectively. Similar changes in CO2 assimilation rates by salt stress have been documented by several researchers [30][31][32]. The relationships between gs and A were linearly positive irrespective of growth stage, and the groups treated with high levels of NaCl showed larger stomatal limitations. Furthermore, the treatments lowered qP and ΦII but not the other fluorescence parameters. According to Cruz et al., however, the maximum photochemical quantum yield of photosystem II was significantly lower in stressed plants grown with 2.032 g NaCl kg−1 soil [33]. It has been also reported that, in leaves exposed to 200 mM NaCl, non-photochemical quenching was enhanced as a result of reduced carotenoids that play a key role for protection against photo-oxidative damage [10][11]. These imply that the salt stress in the present study was not so severe that the functions of photosystem II were still maintained. Taking these into account, CO2 assimilation was most probably inhibited by the treatments through stomatal closure rather than the alteration of photosystem II activity. As A declined with raising NaCl levels, leaf sugar concentration was also inversely affected, which suggests that the stressed plants produced fewer carbohydrate sources available for their growth and ripening. Moreover, the salt stress significantly decreased leaf area as well as CO2 assimilation rate per unit leaf area. Taken together, it is implied that the negative impacts of the saline irrigation water treatments regarding photosynthesis were the main cause of diminished culm elongation and juice quality.
4.3. Leaf and Juice Ion Compositions
Unexpectedly, the increasing NaCl levels did not significantly increase Na+ concentration in leaf. Likewise, the increments of Cl− in the leaves of the stressed groups were relatively small. These results differed from the results of previous studies which found that Na+ and Cl− concentrations in the leaves were significantly increased by salt stress [34][35][36]. Meanwhile, Gandonou et al. stated that a salt-tolerant cultivar accumulated more Na+ in leaf than a salt-sensitive cultivar under salt stress [37]. Taking the negative effects of salt stress into account, the tested cultivar was likely to be salt-sensitive so that distinct differences were not seen in leaf ion composition between the 0 mg NaCl L−1 group and the stressed groups.
Despite slight treatment effects on leaf ion composition, the saline irrigation water treatments significantly augmented accumulation of Na+ and Cl− in juice. It should be noted that the salt stress also involved substantial increments of juice K+, and the concentration was nearly twice as high in the 3000 mg NaCl L−1 group as in the 0 mg NaCl L−1 group. In other words, juice K+ concentration could also vary in the presence of NaCl even if the same amount of K+ is supplied through irrigation. This indicates that saline water may have been extensively used in Japanese sugarcane production areas where high K+ and low sucrose concentrations in juice have been reported. These drastic changes in juice ion composition due to salt stress accompanied increasing juice EC representing a material’s ability to allow the transport of an electric charge. EC is measured easily and quickly without any sample preparation and has been known to be strongly associated with total ion concentration in liquid [12]; thereby, it can be a useful tool to indicate the salinization status of sugarcane. Referring to Table 4 and Figure 4, sugarcane grown with 1000 mg NaCl L−1 had an EC of about 900 mS m−1, and total sugar concentration in juice tended to decline as juice EC exceeded 900 mS m−1 in Exp. 1. This value is therefore considered to be the threshold for juice EC to cause significant damages to the growth and quality of cultivar NiF8.
5. Conclusions
Our study demonstrates that salt concentration in irrigation water is desired to be kept lower than 1000 mg L−1 to prevent any loss in sugar yield by salt stress; however, the threshold salinity level may be variable among cultivars and thus other major cultivars in Japan must also be tested for resistance to salt stress. Besides, it should be acknowledged that not all growers can obtain good quality water for irrigation; in fact, some may inevitably have to use saline irrigation water, knowing the possible risks of salt stress. Whether application of saline irrigation water should be refrained from or it can also alleviate water-deficit stress is to be studied under drought conditions. As well as salt concentration in irrigation water itself, cultural practices are other factors to be concerned. For instance, use of drainage stabilizes the water table and avoids the impact of long-term salinity build-up [38]. It also enables salts accumulated in the soil to be properly leached through the profile by adequate amounts of rainfall [39]. Therefore, effective salinity control including the combination of water quality management and appropriate cultural practices could diminish detrimental effects of saline irrigation water. From the present study, sugarcane plants of NiF8 possessing juice EC above 900 mS m−1 at harvest could be regarded as salt-stressed via irrigation where there is a concern about water salinity. As a future perspective, surveys to investigate the relationships between the salinity of irrigation water and sugarcane and to evaluate its impact based on EC need to be carried out at the field scale.
References
- Pitman, M.G.; Läuchli, A. Chapter 1. Global impact of salinity and agricultural ecosystems. In Salinity: Environment–Plants–Molecules; Läuchli, A., Lüttge, U., Eds.; Kluwer Academic Publishers: Dordrecht, The Netherlands, 2002; pp. 3–20.
- Munns, R.; Tester, M. Mechanism of salinity tolerance. Annu. Rev. Plant Biol. 2008, 59, 651–681.
- FAO. FAO Soils Portal, Management, Salt-Affected Soils. Available online: http://www.fao.org/soils-portal/soil-management/management-of-some-problem-soils/salt-affected-soils/more-information-on-salt-affected-soils/en/ (accessed on 31 March 2020).
- Murad, A.M.; Molinari, H.B.C.; Magalhães, B.S.; Franco, A.C.; Takahashi, F.S.C.; de Oliveira, N.G.; Franco, O.L.; Quirino, B.F. Physiological and proteomic analyses of Saccharum spp. grown under salt stress. PLoS ONE 2014, 9, e98463.
- Matsuoka, M. Sugarcane cultivation and sugar industry in Japan. Sugar Tech 2006, 8, 3–9.
- FAO. FAOSTAT, Crops. Available online: http://www.fao.org/faostat/en/#data/QC (accessed on 31 March 2020).
- Patade, V.Y.; Suprasanna, P.; Bapat, V.A. Effects of salt stress in relation to osmotic adjustment on sugarcane (Saccharum officinarum L.) callus cultures. Plant Growth Regul. 2008, 55, 169–173.
- Gomathi, R.; Thandapani, P. Influence of salinity stress on growth parameters and yield of sugarcane. J. Pharm. Biol. Sci. 2014, 9, 28–32.
- Lingle, S.E.; Wiegand, C.L. Soil salinity and sugarcane juice quality. Field Crops Res. 1997, 54, 259–268.
- Cha-um, S.; Chuencharoen, S.; Mongkolsiriwatana, C.; Ashraf, M.; Kridmanee, C. Screening sugarcane (Saccharum sp.) genotypes for salt tolerance using multivariate cluster analysis. Plant Cell Tissue Organ Cult. 2012, 110, 23–33.
- Poonsawat, W.; Theerawitiya, C.; Suwan, T.; Mongkolsiriwatana, C.; Samphumphuang, T.; Cha-um, S.; Kridmanee, C. Regulation of some salt defense-related genes in relation to physiological and biochemical changes in three sugarcane genotypes subjected to salt stress. Protoplasm 2015, 252, 231–243.
- Watanabe, K.; Takaragawa, H.; Kawamitsu, Y. Studies of the irrigation water salinity in sugarcane production areas and the effects of sodium chloride concentrations in irrigation water on growth and sugar accumulation of sugarcane in Japan. Res. Tropic. Agric. 2019, 12, 65–72, (In Japanese with English abstarct).
- Zhu, J.-K. Regulation of ion homeostasis under salt stress. Curr. Opin. Plant Biol. 2003, 6, 441–445.
- Shabala, S.; Cuin, T.A. Potassium transport and plant salt tolerance. Physiol. Plant. 2007, 133, 651–669.
- Chao, D.Y.; Dilkes, B.; Luo, H.; Douglas, A.; Yakubova, E.; Lahner, B.; Salt, D.E. Polypoids exhibit higher potassium uptake and salinity tolerance in Arabidopsis. Science 2013, 341, 658–659.
- Ashraf, M.; Shahzad, S.M.; Arif, M.S.; Riaz, M.; Ali, S.; Abid, M. Effects of potassium sulfate on adaptability of sugarcane cultivars to salt stress under hydroponic conditions. J. Plant Nutr. 2015, 38, 2126–2138.
- Watanabe, K.; Nakabaru, M.; Taira, E.; Ueno, M.; Kawamitsu, Y. Relationships between nutrients and sucrose concentrations in sugarcane juice and use of juice analysis for nutrient diagnosis in Japan. Plant Prod. Sci. 2016, 19, 215–222.
- Okinawa Prefecture. 2014/15 Annual Report of Sugarcane and Cane Sugar Production; Okinawa Prefecture: Naha, Japan, 2015; p. 38. (In Japanese)
- Kagoshima Prefecture. 2014/15 Annual Report of Sugarcane and Cane Sugar Production; Kagoshima Prefecture: Kagoshima, Japan, 2015; p. 17. (In Japanese)
- Long, S.P.; Bernacchi, C.J. Gas exchange measurements, what can they tell us about the underlying limitations to photosynthesis? Procedures and sources of error. J. Exp. Bot. 2003, 54, 2393–2401.
- R Core Team. R: A Language and Environment for Statistical Computing; R Foundation for Statistical Computing: Vienna, Austria, 2018.
- Pamenter, N.W.; Allison, J.C.S. Effects of treatments potentially influencing the supply of assimilate on its partitioning in sugarcane. J. Exp. Bot. 2002, 53, 123–129.
- Gutiérrez-Miceli, F.A.; Morales-Torres, R.; Espinosa-Castañeda, Y.J.; Rincón-Rosales, R.; Montes-Molina, J.; Oliva-Liave, M.A.; Dendooven, L. Effects of partial defoliation on sucrose accumulation, enzyme activity and agronomic parameters in sugarcane. J. Agron. Crop Sci. 2004, 190, 250–261.
- Wahid, A.; Rao, A.R.; Rasul, E. Identification of salt tolerance traits in sugarcane lines. Field Crops Res. 1997, 54, 9–17.
- Lingle, S.E.; Wiedenfeld, R.P.; Irvine, J.E. Sugarcane response to saline irrigation water. J. Plant Nutr. 2000, 23, 469–486.
- Wiedenfeld, B. Effects of irrigation water salinity and electrostatic water treatment for sugarcane production. Agric. Water Manag. 2008, 95, 85–88.
- Mekaru, T.; Kuninaka, S.; Dana, K. Saline water irrigation for sugarcane. 1. Effects on growth and yield. Abs. Ann. Meet. Jpn. Soc. Soil Sci. Plant Nutr. 1982, 28, 314. (In Japanese)
- Thomas, J.R.; Salinas, F.G.; Oerrther, G.F. Use of saline water for supplemental irrigation of sugarcane. Agron. J. 1981, 73, 1011–1017.
- O’Shea, M. Sugar Accumulation. In Manual of Cane Growing; Hogarth, D.M., Allsopp, P.G., Eds.; Fergies Printers: Brisbane, Australia, 2007; pp. 82–89.
- Meinzer, F.C.; Plaut, Z.; Saliendra, Z. Carbon isotope discrimination, gas exchange, and growth of sugarcane cultivars under salinity. Plant Physiol. 1994, 104, 521–526.
- Cha-um, S.; Kridmanee, C. Proline accumulation, photosynthetic abilities and growth characters of sugarcane (Saccharum officinarum L.) plantlets in response to iso-osmotic salt and water-deficit stress. Agric. Sci. China 2009, 8, 51–58.
- Vasantha, S.; Venkataramana, S.; Gururaja Rao, P.N.; Gomathi, R. Long term salinity effect on growth, photosynthesis and osmotic characteristics in sugarcane. Sugar Tech 2010, 12, 5–8.
- Cruz, F.J.R.; Júnior, D.C.F.; Santos, D.M.M. Low salt stress affects physiological parameters and sugarcane plant growth. Aust. J. Crop Sci. 2018, 12, 1272–1279.
- Gomathi, R.; Thandapani, T.V. Salt stress in relation to nutrient accumulation and quality of sugarcane genotypes. Sugar Tech 2005, 7, 39–47.
- Plaut, Z.; Meinzer, F.C.; Federman, E. Leaf development, transpiration and ion uptake and distribution in sugarcane cultivars under salinity. Plant Soil 2000, 218, 59–69.
- Medeiros, C.D.; Ferreira, J.R.C.; Oliveira, M.T.; Rivas, R.; Pandolfi, V.; Kido, É.A.; Baldani, J.I.; Santos, M.G. Photosynthesis, antioxidant activities and transcriptional responses in two sugarcane (Saccharum officinarum L.) cultivars under salt stress. Acta Physiol. Plant. 2014, 36, 447–459.
- Gandonou, C.B.; Bada, F.; Gnancadja, S.L.; Abrini, J.; Skali-Senhaji, N. Effects of NaCl on Na, Cl and K ions accumulation in two sugarcane (Saccharum sp.) cultivars differing in their salt tolerance. Int. J. Plant Physiol. Biochem. 2011, 3, 155–162.
- Ayers, R.; Westcot, D.W. 2.4 Management of salinity problems. In Water Quality for Agriculture, FAO Irrigation and Drainage Paper 29 Rev. 1; FAO: Rome, Italy, 1985.
- Ham, G.; McGuire, P.; Kingston, G. Chapter 10. Irrigation of Sugarcane. In Manual of Cane Growing; Hogarth, D.M., Allsopp, P.G., Eds.; Fergies Printers: Brisbane, Australia, 2007; pp. 194–225.

