 +1 credit
| Version | Summary | Created by | Modification | Content Size | Created at | Operation |
|---|---|---|---|---|---|---|
| 1 | Nadia El-Mabrouk | + 2785 word(s) | 2785 | 2021-05-27 09:01:16 | | | |
| 2 | Peter Tang | Meta information modification | 2785 | 2021-06-02 04:57:35 | | |
Video Upload Options
Syntenies are genomic segments of consecutive genes identified by a certain conservation in gene content and order. The notion of conservation may vary from one definition to another, the more constrained requiring identical gene contents and gene orders, while more relaxed definitions just require a certain similarity in gene content, and not necessarily in the same order. Regardless of the way they are identified, the goal is to characterize homologous genomic regions, i.e., regions deriving from a common ancestral region, reflecting a certain gene co-evolution that can enlighten important functional properties.
1. Introduction
Although mutations modifying genomic contents (gene gain and loss) and rearrangements modifying gene orders play a concerted role in shaping gene families, they are usually considered separately: gene gain and loss in the context of inferring the evolution of a given gene family, and rearrangements in the context of understanding genome evolution. In other words, in contrast to rearrangements, gain and loss events are usually considered to be single gene events.
For a given gene family Γ with gene copies located in a set Σ of genomes, a gene tree T for Γ (representing the evolution of the gene sequences through nucleotide or amino acid mutations) and a species tree S for Σ, the reconciliation approach [2] consists of inferring the evolution of Γ
by embedding T into S and explaining the incongruence between the two trees from duplications, losses or HGT events that would have obscured the speciation scenario. Reconciliation is based on the assumption that each gene family evolves independently. Although this hypothesis holds for genes that are far apart in the genome, it is clearly too restrictive for those grouped into syntenies, i.e., forming a set of homologous chromosomal regions, meaning that they are deriving from a common ancestral interval, with approximately the same gene content and order. Although convergent evolution should not be excluded, such co-linear sequences of genes are more plausibly the result of a concerted evolution from a common ancestral region, rather than of an independent set of gene duplications that would have generated the same gene organization in different genomic regions.
The neuropeptide Y-family receptors [3], the Homeobox gene clusters [4,5,6], the FGFR fibroblast growth factor receptors [7,8], the genes of the opioid system [9,10,11] or the major histocompatibility complex encoding numerous immunologically vital genes playing an imperative role in controlling the vertebrate adaptive immunity [12], are a few examples of genes organized in syntenies in human, as well as in numerous vertebrate genomes. Many of these gene families, appearing in potentially quadruplicated regions in human and other mammalian genomes, have been considered to be evidence of the “2R hypothesis” [13] assessing two rounds of whole genome duplication events in the evolution leading to the contemporary vertebrate genomes. Transposed duplications copying genes or chromosomal segments from an original locus to a new one also play an important role in the evolution of syntenies. Being able to make the difference between the two modes of evolution is also important [14].
Operons in bacteria, containing adjacent genes that are transcribed together into a single mRNA sequence, is another example of genes organized in syntenies [15]. This organization provides a valuable source of information. For example, genes belonging to the same metabolic pathway were found to be organized in similar operons in microorganisms of different phylogenetic lineages, such as Escherichia coli and the Gram-positive Bacillus subtilis [16]. Notice that as horizontal transfers between bacteria of the same or different proteobacterial branches play a major role in shaping bacterial operons, an evolutionary model for studying the origin and evolution of operons cannot avoid considering transfer events.
From an algorithmic point of view, research has focused mainly on the evolution of single-gene families based on sequence divergence and single-gene gain/loss on one side [17], and on the inference of ancestral genomes based on gene content and order of extant genomes on the other side [18]. For the latter branch of research, the considered methods can be grouped into distance-based methods labeling ancestral nodes in a way minimizing total branch length over the phylogeny, and synteny-based (or mapping) methods first inferring a collection of relations between ancestral genes in terms of adjacencies, and then assembling this collection into Contiguous Ancestral regions (CARs) [19]. This latter method can be seen as generating ancestral syntenies (conserved regions) from a set an extant genomes.
2. Syntenies Defined as Gene Orders
The term “synteny”, first introduced in 1971 [22], arose from the need to refer to Human genes located on the same chromosome, but with a genetic distance that could not be determined by the frequency of recombination inferred from the new gene mapping methods. As recalled in [23], synteny means “same thread” (or ribbon), a state of being together in location, as synchrony means being together in time. Thus, according to the original definition, saying that two genes are syntenic only means that they are located on the same chromosome. Today however, the term is largely used by biologists in an evolutionary meaning to design genes or chromosomal segments with a common evolutionary ancestry, i.e., homologous genes, or regions of contiguous genes.
For example, CoGe (https://genomevolution.org/wiki/index.php/Synteny (accessed on 8 April 2021)), a platform for performing comparative genomics research, defines a synteny as a valid deduction that two or more genomic regions derived from a single ancestral region. Inferring “syntenic blocks” usually relies on inferring pairs of chromosomal regions with a similar gene content and order. The SynMap tool of CoGe identifies such blocks by finding sets of homologous gene pairs and merging them into regions.
Such synteny blocks or regions that are more conserved than average in the genomes can reveal regulatory or functional interactions between the involved genes, or combination of alleles that are advantageous when inherited together. Conversely, breakage of conservation in gene order or gene content is an important footprint of the evolution of genomes through global rearrangements [24,25,26] that can be used to infer phylogenetic trees [27].
Two chromosomal regions with identical gene content and order can clearly be labeled as syntenic. However, because syntenic regions are largely remodeled during evolution, it is usually necessary to relax this strict conservation requirement, allowing for a certain gene content or gene order disruption. Notice that genes are usually represented as signed (“+” for the 5′→3′ strand and “–” for the 3′→5′ strand) units, where the sign or orientation of a gene indicates on which of the two complementary DNA strands the gene is located.
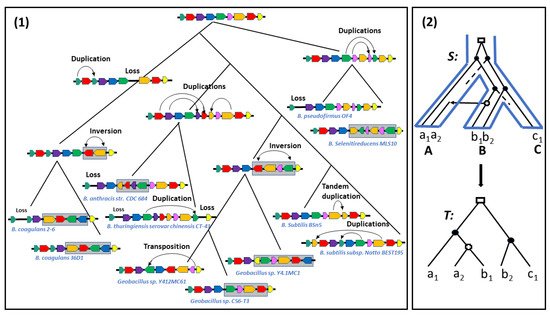
Thus, ranging from a strict definition in terms of conserved segments with identical gene content, order and orientation [25] to the most relaxed one in terms of being located on the same chromosome, the notion of two regions being syntenic has been defined in several ways, also depending on the evolutionary events being considered. In fact, during evolution, syntenic regions evolve independently through local gene rearrangements or local events modifying their gene content, such as tandem duplications adding genes or, conversely, losses removing genes. They also evolve collectively through transpositions and translocations splitting a single synteny into two syntenies, or conversely joining two syntenies into one; new syntenies are created through transposed duplications [28] or whole genome duplication, or conversely lost [29]. They are also passed to organisms through speciation or HGTs (see Figure 1).
From a combinatorial point of view, various formal definitions of synteny blocks, also called gene clusters have been introduced to allow identifying them in a set of genomes [20,30] (see Figure 2). Notice first that although we define syntenies as sequences of genes, from a combinatorial or an algorithmic point of view, any other marker or unit can be considered instead of genes. The notion of common intervals [31,32,33] refers to conserved segments in which we relax the conditions that genes appear in the same order or the same orientation. Formally, given K genomes represented as permutations on an alphabet Σ, a common interval is a subset S of Σ such that in each genome, all the genes in S are contiguous, i.e., grouped together with no other gene in between them, but not necessarily in the same order. In particular, strong common intervals, defined as common intervals that do not overlap with any other common interval [34], have rich combinatorial properties [30]. A more relaxed definition of synteny blocks account for possible gaps between genes. A first formal model of max-gap clusters was introduced in [35] under the name of gene teams: Given K genomes, a gene team is a maximum subset A of a set of genes Γ such that in each genome, any gene in A is separated by at most δ genes from another gene of A. Common intervals and max-gap clusters completely ignore gene orders. A compromise between gene content and gene order conservation is given in [36,37] where two genes adjacent in one genome are required to be separated by at most δ genes in another genome.
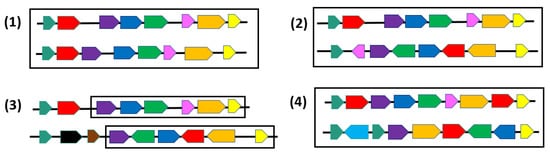
Figure 2. Pairs of regions where genes (or blocks) of the same family are represented by the same color. (1) Two identical permutations; (2) Two common intervals; (3) A δ-team (maximum chain of common genes separated by at most δ foreign genes) with δ=1; (4) Two gene orders on different alphabets and with gene duplicates.
3. The Sorting by Rearrangement Problem
4. Accounting for Gene Gain and Loss
5. Accounting for Gene Trees
References
- Tremblay-Savard, O.; Benzaid, B.; Lang, B.F.; El-Mabrouk, N. Evolution of tRNA Repertoires in Bacillus Inferred with OrthoAlign. Mol. Biol. Evol. 2015, 32, 1643–1656.
- Pevzner, P.; Tesler, G. Genome rearrangements in mammalian evolution: Lessons from human and mouse genomic sequences. Genome Res. 2003, 13, 13–26.
- Pham, S.; Pevzner, P. DRIMM-Synteny: Decomposing genomes into evolutionary conserved segments. Bioinformatics 2010, 26, 2509–2516.
- Bader, D.; Moret, B.; Yan, M. A Linear-Time Algorithm for Computing Inversion Distance between Signed Permutations with an Experimental Study. J. Comput. Biol. 2001, 8, 483–491.
- Bergeron, A.; Mixtacki, J.; Stoye, J. Reversal Distance without Hurdles and Fortresses. In Combinatorial Pattern Matching; Lecture Notes in Computer Science; Sahinalp, S., Muthukrishnan, S., Dogrusoz, U., Eds.; Springer: Berlin/Heidelberg, Germnay, 2004; Volume 3109, pp. 388–399.
- Tesler, G. Efficient algorithms for multichromosomal genome rearrangements. J. Comput. Syst. Sci. 2002, 65, 587–609.
- Feijao, P.; Meidanis, J. SCJ: A breakpoint-like distance that simplifies several rearrangement problem. IEEE/ACM Trans. Comput. Biol. Bioinform. 2011, 8, 1318–1329.
- Yancopoulos, S.; Attie, O.; Friedberg, R. Efficient sorting of genomic permutations by translocation, inversion and block interchange. Bioinformatics 2005, 21, 3340–3346.
- Bulteau, L.; Fertin, G.; Rusu, I. Sorting by transpositions is difficult. SIAM J. Discret. Math. 2012, 26, 1148–1180.
- Silva, L.; Kowada, L.; Rocco, N.; Walter, M. An Algebraic 1.375-Approximation Algorithm for the Transposition Distance Problem; Elsevier: Amsterdam, The Netherlands, 2021; Submitted.
- Shao, M.; Lin, Y. Approximating the edit distance for genomes with duplicate genes under DCJ, insertion and deletion. BMC Bioinform. 2012, 13, S13.
- Willing, E.; Zaccaria, S.; Braga, M.; Stoye, J. On the inversion-indel distance. BMC Bioinform. 2013, 14, S3.
- Braga, M.; Willing, E.; Stoye, J. Double cut and join with insertions and deletions. J. Comput. Biol. 2011, 18, 1167–1184.
- Compeau, P. DCJ-indel sorting revisited. Algorithms Mol. Biol. 2013, 8, 1–9.
- Avdeyev, P.; Jiang, S.; Aganezov, S.; Hu, F.; Alekseyev, M. Reconstruction of Ancestral Genomes in Presence of Gene Gain and Loss. J. Comput. Biol. 2016, 23, 150–164.
- Lyubetsky, V.; Gershgorin, R.; Gorbunov, K. Chromosome structures: Reduction of certain problems with unequal gene content and gene paralogs to integer linear programming. BMC Bioinform. 2017, 18, 1–8.
- Fertin, G.; Labarre, A.; Rusu, I.; Tannier, E.; Vialette, S. Combinatorics of Genome Rearrangements; Istrail, S., Pevzner, P., Waterman, M., Eds.; The MIT Press: Cambridge, MA, USA; London, UK, 2009.
- Bryant, D. Comparative Genomics; Chapter the Complexity of Calculating Exemplar Distances; Kluwer Academic: Dordrecht, The Netherlands, 2000; pp. 207–211.
- Bulteau, L.; Jiang, M. Inapproximability of (1,2)-exemplar distance. In IEEE/ACM Transactions on Computational Biology and Bioinformatics; Institute of Electrical and Electronics Engineers and Association for Computing Machinery: New York City, NY, USA, 2013; pp. 1384–1390.
- Sankoff, D. Genome rearrangement with gene families. Bioinformatics 1999, 15, 909–917.
- Yin, Z.; Tang, J.; Schaeffer, S.; Bader, D. Exemplar or matching: Modeling DCJ problems with unequal content genome data. J. Comb. Optim. 2016, 32, 1165–1181.
- Lorespi, D.; Tomkins, A. Block edit models for approximate string matching. Theor. Comput. Sci. 1997, 181, 159–179.
- Dondi, R.; El-Mabrouk, N. Aligning and Labeling Genomes Under the Duplication-Loss Model. In Computability in Europe (CiE); Lecture Notes in Computer Science; IOS Press: Amsterdam, The Netherlands, 2013; Volume 7921, pp. 97–107.
- Holloway, P.; Swenson, K.; Ardell, D.; El-Mabrouk, N. Ancestral Genome Organization: An Alignment Approach. J. Comput. Biol. 2013, 20, 280–295.
- Andreotti, S.; Reinert, K.; S, S.C. The Duplication-Loss Small Phylogeny Problem: From Cherries to Trees. J. Comput. Biol. 2013, 20, 643–659.
- Benzaid, B.; Dondi, R.; El-Mabrouk, N. Duplication-Loss Genome Alignment: Complexity and Algorithm. In Proceedings of the 13th International Conference, LATA 2019, Petersburg, Russia, 26–29 March 2019.
- Bohnenkamper, L.; Braga, M.; Doerr, D.; Stoye, J. Computing the Rearrangement Distance of Natural Genomes. J. Comput. Biol. 2021, 28, 1–22.
- Shao, M.; Lin, Y.; Moret, B. An exact algorithm to compute the double-cut-and-join distance for genomes with duplicate genes. J. Comput. Biol. 2015, 22, 425–435.
- Rubert, D.; Feijao, P.; Braga, M.; Stoye, J.; Martinez, F.V. Approximating the DCJ distance of balanced genomes in linear time. Algorithms Mol. Biol. 2017, 12, 1–13.
- Ma, J.; Ratan, A.; Raney, B.; Suh, B.; Miller, W.; D, D.H. The infinite sites model of genome evolution. Proc. Natl. Acad. Sci. USA 2008, 105, 14254–14261.
- Paten, B.; Zerbino, D.; Hickey, G.; Haussler, D. A unifying model of genome evolution under parsimony. BMC Bioinform. 2014, 15, 1–31.
- Guindon, S.; Gascuel, O. A simple, fast and accurate algorithm to estimate large phylogenies by maximum likelihood. Syst. Biol. 2003, 52, 696–704.
- Stamatakis, A. RAxML-VI-HPC: Maximum likelihood-based phylogenetic analysis with thousands of taxa and mixed models. Bioinformatics 2006, 22, 2688–2690.
- Ronquist, F.; Huelsenbeck, J. MrBayes3: Bayesian phylogenetic inference under mixed models. Bioinformatics 2003, 19, 1572–1574.
- Schreiber, F.; Patricio, M.; Muffato, M.; Pignatelli, M.; Bateman, A. TreeFam v9: A new website, more species and orthology-on-the-fly. Nucleic Acids Res. 2013.
- Boussau, B.; Szöllősi, G.; Duret, L.; Gouy, M.; Tannier, E.; Daubin, V. Genome-scale coestimation of species and gene trees. Genome Res. 2013, 23, 323–330.
- Szöllősi, G.J.; Rosikiewicz, W.; Boussau, B.; Tannier, E.; Daubin, V. Efficient exploration of the space of reconciled gene trees. Syst. Biol. 2013, 62, 901–912.
- Vilella, A.; Severin, J.; Ureta-Vidal, A.; Heng, L.; Durbin, R.; Birney, E. EnsemblCompara gene trees: Complete, duplication-aware phylogenetic trees in vertebrates. Genome Res. 2009, 19, 327–335.
- Huerta-Cepas, J.; Capella-Gutierrez, S.; Pryszcz, L.; Denisov, I.; Kormes, D.; Marcet-Houben, M.; Gabald’on, T. PhylomeDB v3.0: An expanding repository of genome-wide collections of trees, alignments and phylogeny-based orthology and paralogy predictions. Nucleic Acids Res. 2011, 39, D556–D560.
- Mi, H.; Muruganujan, A.; Thomas, P. PANTHER in 2013: Modeling the evolution of gene function, and other gene attributes, in the context of phylogenetic trees. Nucleic Acids Res. 2012, 41, D377–D386.

