 +1 credit
| Version | Summary | Created by | Modification | Content Size | Created at | Operation |
|---|---|---|---|---|---|---|
| 1 | Alexander Harrison | + 1054 word(s) | 1054 | 2020-10-07 01:33:04 | | | |
| 2 | Alexander Harrison | -3 word(s) | 1051 | 2020-10-08 08:16:57 | | | | |
| 3 | Alexander Harrison | -3 word(s) | 1051 | 2020-10-08 08:20:01 | | | | |
| 4 | Alexander Harrison | -3 word(s) | 1051 | 2020-10-08 08:22:02 | | | | |
| 5 | Alexander Harrison | -3 word(s) | 1051 | 2020-10-08 08:25:25 | | | | |
| 6 | Alexander Harrison | -3 word(s) | 1051 | 2020-10-08 09:16:49 | | | | |
| 7 | Alexander Harrison | Meta information modification | 1051 | 2020-10-08 09:34:31 | | | | |
| 8 | Catherine Yang | Meta information modification | 1051 | 2020-10-09 05:51:05 | | | | |
| 9 | Alexander Harrison | + 6 word(s) | 1057 | 2020-10-13 23:06:19 | | | | |
| 10 | Alexander Harrison | + 10 word(s) | 1061 | 2020-10-13 23:10:53 | | | | |
| 11 | Alexander Harrison | + 88 word(s) | 1149 | 2020-10-27 09:48:48 | | | | |
| 12 | Alexander Harrison | Meta information modification | 1149 | 2020-12-16 22:59:59 | | |
Video Upload Options
Modulated recurrence model predicts Covid-19 trajectory in multiple countries. Wave action at 14-week intervals correlates with case numbers, while predicting future growth rate surges.
Graphs of total Covid-19 case numbers in many countries now show long-period wave action. Simulations using a sine modulated time-delay recurrence equation not only correlate with case data but also proves a π-commensurate wave period of 26 weeks. When the slope of geometric growth exceeds arithmetic growth, a periodic wave launches in the population with all the dynamics of a damped oscillation. Recursive simulation generates trajectories that predict future wave peak times and amplitudes. Data from USA, Canada, UK, Germany, India and Australia are studied in this research. In all cases, Covid-19 trajectories around the world show the common feature of periodic oscillations as case numbers increase. Discovery of repeatable Covid-19 growth dynamics suggests a common invariant mechanism of virus propagation, irrespective of country.
1. Introduction
Recent studies of Covid-19 using various logistic models have not managed to describe dynamics that correlate with active case trajectories [1]. Verhulst [2] derived equations for the maximum impacted population in relation to growth of a species or contagion. May [3] studied predator-prey systems using recurrence equations to examine chaos and instabilities of the logistic equation. Logistic equations simply predict an upper limit to the infected population.
Graphs of Covid-19 total cases for USA data [4] from early May 2020 predicted that discretised arithmetic recurrence relations apply after an initial geometric growth phase [5][6]. Observation from published graphs of the total cases in any given country [4] provides evidence of lulls and surging in growth rate, resembling elastic waves in the starting velocity curves of long elastic belts [7]. Introduction of a contagion into a mobile population may be considered analogous to the application of a force applied to start a long elastic belt, where wave action occurs when an applied stress exceeds the propagation losses.
2. Recursion Model
Continuous differential equations of the form dN(t)/dt = β.N(t) define geometric growth with exponential solutions. Symbols used have their usual meaning in mathematics, with N as the population of infected persons and t is time. An equivalent recurrence relation would be N(T+1) = β.N(T), where T is a discrete domain interval (T=1 week) and β is a growth factor. For the recurrence method, an initial value of N(0) at T=0 is applied so that the next value at interval T=1 is N(1)= β.N(0), and so on, in a recursive calculation. Equations defining Covid-19 curves are:
Equation (1):
N(T+1) = β.N(T) + X(T)
X(T) = δ(t).A.m(T).P(T)
P(T) = 1-N(T-1) / V
Equation (2):
m(T) = B.sin(π(T+n)/W).Y(T)
Y(T) = exp(-(T-k)/d) + C ; (T>=Δ)
where symbols have values given in Table 1. Kronecker delta δ(t) is a modulation control function at t = T; (i) δ(t)=0, T<Δ and (ii) δ(t)=1, β=1 T>=Δ. Parameter Δ is the discrete delay interval (in weeks) where wave action commences. Values applied to the modulated delay recursion equation (1) produce curves described in Figures 1 to 3. Function m(T) represents a damped modulation function. Function P(T) defines a time-delayed population with V the Verhulst population limit [2]. Equation (1) represents a time-delay recurrence where the population multiplier P(T) is delayed by 2 weeks relative to N(T+1).
3. Prediction Curves Compared with Actual Data
Table 1 shows values that produce correlation between the general delay recursion model of Equation (1) and actual published case numbers for 6 countries. Figures 1 and 2 show actual and predicted curves for UK, Germany, Canada, USA and India. Figure 3 shows a separate graph for Australian data curves to highlight the curve trajectory. A weekly rate of change of case number N(T) is defined by dN(T)/dT (acceleration). Wave surge is initiated when dN/dT reaches 40,000/week. In all countries studied, wave action begins when N(Δ) = Nc and when the growth “velocity” ratio M > [Nc-N(Δ-1)]/Nc, i.e. M > 0.46.
Accelerated growth in case number initiates a large "second-wave" surge, observed in countries with prolonged lockdown prior to 5-September-2020. Modulation values B and C in Table 1 increase up to 6 times their initial values under post lockdown conditions. UK and European countries are experiencing rapid acceleration of a large second wave in late October 2020. A plausible explanation for the new second wave may stem from a higher widespread level the virus in each country, compared to initial outbreak levels. By way of analogy, if the degree of community "damping" to virus transmission is less after a lockdown, propagation will be more rapid as indicated by the data after the 15-September date.
India’s curve is geometric up to T=32 with δ(t)=0 and β approximately 1.27. Data for India follows a recurrence curve N(T+1) = N(T) [1 + m(T)] P(T). For completeness, the Verhulst logistic equation [2] is N(T+1) = N(T) [ 1-N(T)/P) where P is the maximum affected population. In past pandemics, between 14% and 20% of the given population became infected. Wave action is just beginning in India, as of October 2020.
Table 1. List of parameters and values used in Equation (1) for each country in the model analysis.
|
Country |
A |
B |
C |
Δ |
β |
w |
n |
k |
d |
V |
Nc |
M |
|
USA |
13.4 |
16,000 |
24,000 |
9 |
3.2 |
13 |
6 |
1 |
100 |
33 m |
186,700 |
0.687 |
|
UK |
24 |
900 |
900 |
9 |
3.2 |
15 |
0 |
8 |
50 |
1.7 m |
54,980 |
0.687 |
|
Germany |
25 |
800 |
520 |
8 |
3.4 |
15 |
3 |
8 |
20 |
1.4 m |
48,500 |
0.706 |
|
Canada |
8 |
950 |
950 |
10 |
2.7 |
15 |
0 |
0 |
80 |
1.09 m |
15,260 |
0.629 |
|
Australia |
10 |
160 |
160 |
6 |
2.8 |
13 |
6 |
0 |
100 |
43 k |
1140 |
0.70 |
|
India |
n/a |
50 |
0.4 |
16 |
~1.27 |
14 |
0 |
0 |
1.73 |
185 m |
2.5 m |
0.46 |
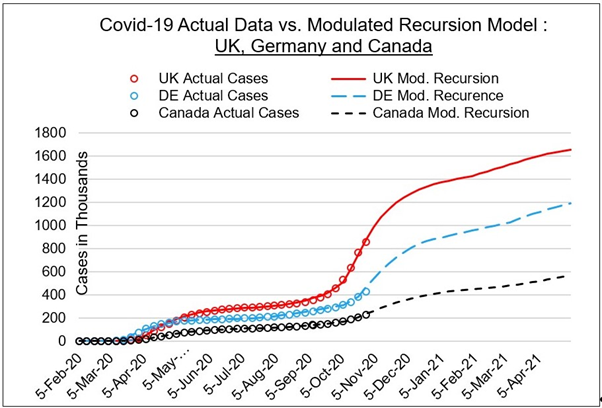
Figure 1. Curve predictions for UK, Canada, Germany.
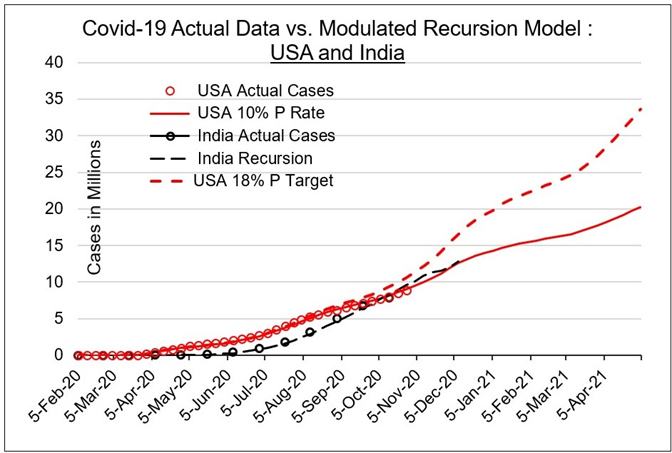
Figure 2. Curve predictions for USA and India.
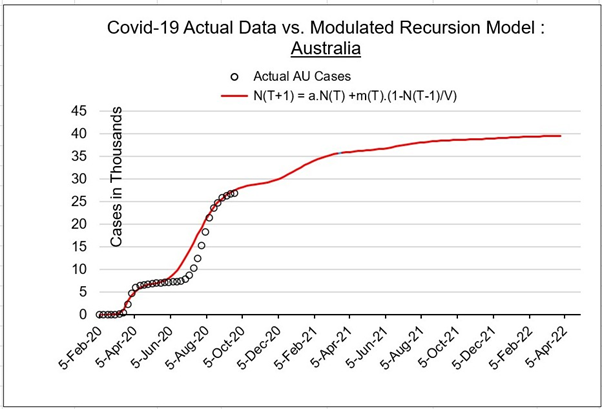
Figure 3. Curve predictions for Australia.
4. Discussion
Variations in the trajectory of total cases can be explained using a modulated recursion method. Agreement with actual case numbers for six countries discussed in this short paper suggests that a common mechanism exists for Covid-19 propagation, independent of the particular country. India is at the beginning of a wave cycle, as is Brazil and other countries not covered. Wave surging with half-periods of 13 to 15 weeks exists in the data. A wave in total case numbers is initiated when the rate M exceeds the background infection level. In general, M > 0.5 and surges occur with an average 14-week interval.
Table 1 shows how the amplitudes of growth differ in each country. For the initial geometric growth period, the β value is in a range 2.7 < β < 3.2. After community spread exceeds the Nc value, the recursion model containing a modulation function applies. Maximum infection asymptotes V in Table 1 give the expected number of cases that each country could reach by 2022.
5. Conclusion
Describing the trajectory of Covid-19 cases in multiple countries led to a simulation method using delayed and modulated recursion. All six countries studied show oscillatory growth with similar wave periods and amplitudes. Agreement between model and actual data is strong, indicating a common mechanism of propagation. The interval between lulls and peaks in total cases is 14 weeks +/- 1 week for all countries investigated. Case surge induces a periodic wave when infections pass a critical value Nc where the change ratio M > 0.46. Further research is required to investigate Covid-19 infected populations to determine how surging is related to social isolation methods.
References
- Ui-QuanSun.; Transmission dynamics of covid-19 : Mathematical Modelling and Data Fitting. Encyclopedia Journal, 2020, Covid-19 Encyclopedia.pub
- F. Verhulst.; Recherches mathématiques sur la loi d'accroissement de la population. Nouv. mém. de l'Academie Royale des Sci. et Belles-Lettres de Bruxelles. 1895, 18, 1-41.
- M. May.; Chaos and the Dynamics of Biological Populations. Proc. of the Royal Society of London, Dynamical Chaos, 1987, Chapter 4, 27-44.
- ; www.worldometers.info>Coronavirus_update
- Harrison.; US CV-19 Watcher Updated Graph. LinkedIn Online Post, 4-May-2020
- Harrison.; Predictive Modelling of US Covid-19 Growth Rate. Quora, CoronaVirus Watch Space, Post published 27-June-2020.
- Harrison.; Dynamics of High Modulus Belts with Distributed Mass and Elasticity. Journal of Advanced Research in Applied Mechanics 2015, 15/1, 10-19, ISSN (online) 2289-7895


