Submitted Successfully!
To reward your contribution, here is a gift for you: A free trial for our video production service.
Thank you for your contribution! You can also upload a video entry or images related to this topic.
Version Summary Created by Modification Content Size Created at Operation
1 + 2878 word(s) 2878 2021-10-25 10:33:27 |
2 format corrected. + 1151 word(s) 4029 2021-11-03 04:58:06 |

Video Upload Options

Do you have a full video?

Confirm

Are you sure to Delete?
Cite
If you have any further questions, please contact Encyclopedia Editorial Office.
Tosello, B. School-Aged Extremely Preterm (EPT) Children. Encyclopedia. Available online: https://encyclopedia.pub/entry/15628 (accessed on 20 April 2024).
Tosello B. School-Aged Extremely Preterm (EPT) Children. Encyclopedia. Available at: https://encyclopedia.pub/entry/15628. Accessed April 20, 2024.
Tosello, Barthelemy. "School-Aged Extremely Preterm (EPT) Children" Encyclopedia, https://encyclopedia.pub/entry/15628 (accessed April 20, 2024).
Tosello, B. (2021, November 02). School-Aged Extremely Preterm (EPT) Children. In Encyclopedia. https://encyclopedia.pub/entry/15628
Tosello, Barthelemy. "School-Aged Extremely Preterm (EPT) Children." Encyclopedia. Web. 02 November, 2021.
School-Aged Extremely Preterm (EPT) Children
Edit

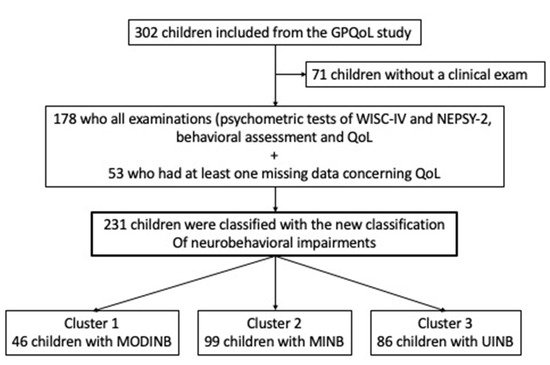
School-aged extremely preterm (EPT) children have multiple specific neurocognitive/behavioral disorders that are often associated with other disorders; this manifests a true neurobehavioral “phenotype” of prematurity. To determine a profile of cognitive/behavioral impairments in a population of school-aged EPT children (7–10 years-old) without major disabilities, a cross-sectional study was conducted in five medical centers. An algorithm distributed the study population according to four WISC-IV subtests, five NEPSY-2 subtests, and two variables of figure of Rey.

extremely pre-term children neurocognitive/behavioral disorders quality of life anxiety

1. Introduction

There is a remarkable consistency in outcomes over time and between countries, cultures, and healthcare systems, which provides evidence for a universal “preterm phenotype” associated with the neurodevelopmental immaturity conferred by a VP birth [1]. Relative to those born at term, very preterm (VP) children are at an increased risk for cognitive impairments, attention deficits, and social–emotional problems. However, there is no increased risk for disruptive or oppositional behavioral problems [2]. Moreover, developmental coordination disorders (DCD) are associated with behavioral, cognitive, and/or attention disorders [3][4] in EPT school-aged children who are free from severe deficiencies. In addition, two meta-analyses confirm a high prevalence of psychiatric disorders in children and adults born prematurely as compared to a population born at term. These VP children have a high risk of attention disorders with or without hyperactivity, autism spectrum, and anxiety disorders [1][5]. However, these disorders are always accompanied by cognitive, neurological, and learning comorbidities [6].

As traditionally seen in the literature in cohort populations, the cognitive fate of premature children is usually classified into four groups: (1) absence of incapacity, (2) minor disability, (3) moderate disability, and (4) severe disability, based on data from the total Full Scale Intelligent Quotient (FSIQ) scores. A threshold of ≥89 is considered normal, which is a low average [4][7]. However, the performances observed with a total FSIQ are the result of a complex processes involving multiple intellectual and non-intellectual characteristics (attention, emotions, motivation, movement planning, etc.) [8]. Furthermore, for infants born prematurely, the FSIQ is most often calculated on a dissociated subtest value that is not necessarily reflective of the child’s cognitive function and thus constitutes a false methodology [8]. The analysis of the subtests’ dispersions aims to highlight those that deserve a thorough interpretation. Indeed, a child considered “normal” is likely to have impairments such as a dysexecutive syndrome and/or impaired behavior and/or DCD that could disrupt brain function.

Therefore, most longitudinal studies focus on general mental health classifications rather than individual clinical diagnostic criteria and comorbidity profiles (motor and behavior). Since some outcomes may be deteriorating rather than improving over time, knowledge of all comorbidities may be useful in improving an early identification of the highest risk children in order to address their clinical needs. Inclusion of behavioral difficulties and developmental coordination disorders with the definition of mild neurodevelopmental disabilities describes, in more depth, the complexity of those difficulties faced by these preterm children [9].

In fact, there have been few studies directed on individual clinical descriptions in which discrete or non-specific signs of psychiatric disorders and/or subtle impairments of executive functions occur together and/or are associated with cognitive and/or neurological impairments in school-aged VP children. To our knowledge, only one study of these children who share similar profiles within a group on measurements of intelligence and executive functions does not take into account behavior [8]. The assessment of a true neurobehavioral “phenotype” (NBP) of prematurity, which takes into account not only the FSIQ but also executive functions, neurologic examinations, and behavior should be a principal objective of epidemiological research on prematurity [8]. Finally, no studies have measured this neurobehavioral profile and its social consequences particularly on the QoL of these children.

2. Analysis on Research Results

2.1. Population

We categorized 231 children into three clusters (Figure 1) with a mean age of 8.46 (±0.75) years. The FSIQ mean was 91.62 (14.93) (low mean average), and 106 (59.55%) had a dysexecutive syndrome. The mean emotional symptoms were slightly elevated (3.48, 2.42). The comparison between children who had all examinations (psychometric tests of WISC-IV and NEPSY-2, behavioral assessment, and QoL) and those children who had at least one missing data of these examinations did not show any statistical differences (Table S1—Online supporting information).
Figure 1. Study population’s flow chart. Note: Quality of Life (QoL); Cluster 1: Moderate Impaired NeuroBehavior (MODINB); Cluster 2: Minor Impaired NeuroBehavior (MINB); Cluster 3: UnImpaired NeuroBehavior (UINB).

2.2. Cognitive/Behavioral Impairments Profiles from New Classification

The 231 children were classified according to the severity of their neurobehavioral assessment into three neurobehavioral impairment groups:
  • Cluster 1 Moderate Impaired NeuroBehavior (MODINB) with multiple impairments and behavior troubles (n = 46 (20%));
  • Cluster 2 Minor Impaired NeuroBehavior (MINB) with less severe multiple impairments and behavioral troubles, (n = 99 (43%)); and
  • Cluster 3 (n = 86 (37%)), UnImpaired NeuroBehavior (UINB), with only slight emotional symptoms (mean score: 3.5 (SDs) = 2.56: slightly below average, therefore pathological), with a normal neurocognitive assessment outcome.
Behavior and anxiety were significantly different between each different cluster and with a gradient of severity (Table 1).
Table 1. Characteristics of the clustered pooling population.
  Characteristics of Clustered Pooling (N = 231)
MODINB
Cluster 1
(N = 46)
MINB
Cluster 2
(N = 99)
UINB
Cluster 3
(N = 86)
P
Perinatal characteristics        
  GA in WA, mean (SD) 26.13 (0.96) 26.25 (0.82) 26.29 (0.92) 0.607
  Weight in grams, mean (SD) 858.91 (181.77) 878.77 (194.69) 901.31 (171.47) 0.430
  Male, n (%) 20 (43.48) 50 (51.02) 38 (44.71) 0.594
  SGA, n (%) 5 (10.87) 10 (10.10) 1 (1.16) 0.011 *
  Multiple pregnancies, n (%) 17 (36.96) 30 (30.30) 31 (36.05) 0.625
  Severe BPD, n (%) 25 (54.35) 46 (47.92) 47 (54.65) 0.613
  Average age of child at the study inclusion, mean (SD) 8.69 (0.65) 8.43 (0.74) 8.39 (0.72) 0.056
Parents’ educational level, professional activity, and socioeconomic status of family
  Parents without higher education level, n (%) 29 (74.36) 46 (47.92) 18 (21.43) <0.001 *
  Professional activity of parents, n (%)       0.004 *
    Without professional activity 8 (18.60) 7 (7.14) 3 (3.53)  
    Professional activity of one of two parents 16 (37.21) 37 (37.76) 20 (23.53)  
    Professional activity of both parents 19 (44.19) 54 (55.10) 62 (72.94)  
  Professional activity of mother, n (%) 21 (48.84) 63 (64.29) 66 (79.52) 0.002
  Professional activity of father, n (%) 33 (82.50) 82 (89.13) 78 (92.86) 0.243
  Elevated FAS Score, n (%) 21 (45.65) 57 (58.76) 57 (67.06) 0.059
Quality of life 1, mean (SD)        
  VSP-Ae global index (evaluation by the child) 64.38 (12.55) 70.30 (13.07) 70.16 (13.06) 0.029 *
  VSP-Ap global index (evaluation by the parents) 64.38 (12.35) 70.66 (10.51) 71.25 (10.61) 0.008 *
  Kidscreen global index (evaluation by the child) 68.43 (16.65) 73.26 (17.43) 71.91 (17.30) 0.293
  Kidscreen global index (evaluation by the parents) 62.52 (16.54) 70.16 (14.50) 71.33 (13.39) 0.003 *
Neurocognitive assessment 2        
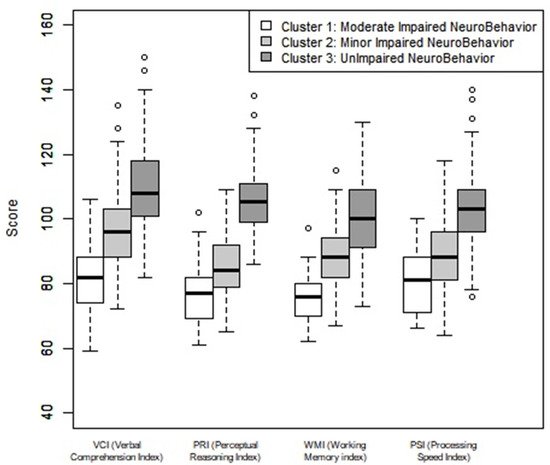
  WISC-IV 2a, mean (SD)        
    VCI (Verbal comprehension index) 80.93 (9.46) 96.56 (11.75) 109.51 (12.74) <0.001 *
    PRI (Perceptional reasoning index) 77.26 (8.99) 85.41 (9.24) 106.73 (9.94) <0.001 *
    WMI (Working memory index) 74.93 (11.07) 88.85 (9.38) 101.15 (11.41) <0.001 *
    PSI (Processing speed index) 80.15 (8.96) 88.49 (10.75) 102.90 (12.61) <0.001 *
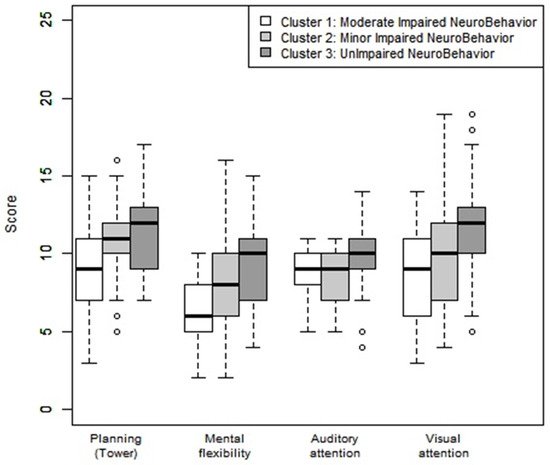
  NEPSY-2 2b, mean (SD)        
    Planification score (Tower) 8.80 (3.04) 10.81 (2.33) 11.52 (2.43) <0.001 *
    Mental flexibility score 6.50 (2.27) 7.76 (2.72) 9.48 (2.68) <0.001 *
    Auditive attention score 8.61 (1.34) 8.45 (1.51) 9.66 (1.73) <0.001 *
    Visual attention score 8.98 (2.73) 9.78 (3.47) 11.64 (3.03) <0.001 *
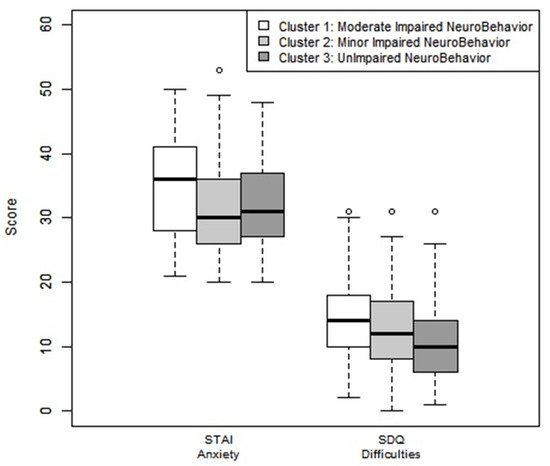
  Goodman-SDQ-parents 3, mean (SD)        
    Emotional symptoms 4.05 (2.62) 3.64 (2.37) 3.15 (2.56) 0.136
    Behavioral problems 2.52 (1.99) 1.94 (1.93) 1.64 (1.73) 0.040 *
    Hyperactivity/Inattention 5.32 (2.45) 4.89 (2.56) 3.93 (2.74) 0.007 *
    Relationship problems with others 2.23 (1.92) 2.17 (1.98) 1.55 (1.77) 0.051
    Prosocial behaviors 8.59 (1.59) 8.61 (1.70) 8.89 (1.42) 0.412
    Total difficulty scores 14.11 (6.39) 12.64 (6.63) 10.27 (5.78) 0.002 *
  Anxiety, mean (SD)        
    Spielberg Index (STAIC) 4 35.30 (8.28) 31.90 (7.71) 32.25 (6.89) 0.035 *
Impairment 5        
  Language delay 5a, n (%) 30 (65.22) 16 (16.16) 1 (1.16) <0.001 *
  Delay in visuospatial integration 5b, n (%) 17 (36.96) 18 (18.18) 0 (0.00) <0.001 *
  Attention deficit disorder 5c, n (%) 15 (32.61) 19 (19.19) 2 (2.33) <0.001 *
  Dysexecutive disorder 5d, n (%) 44 (95.65) 67 (67.68) 26 (30.23) <0.001 *
  Ideomotor dyspraxia 5e, n (%) 14 (30.43) 10 (10.10) 0 (0.00) <0.001 *
Note: Data are expressed in numbers (%) or mean (SD); SD: standard deviation. P: value of the difference between the groups with available data: p < 0.05 *: statistically significant difference. Abbreviations: GA: gestational age; WA: weeks of amenorrhea; SGA: small for gestational age; BPD: bronchopulmonary dysplasia; FAS: family affluence scale. Cluster Classification: Three neurobehavioral phenotype profiles chosen by the algorithm were defined. Cluster 1: Moderate Impaired NeuroBehavior (MODINB), Cluster 2: Minor Impaired NeuroBehavior (MINB), Cluster 3 UnImpaired NeuroBehavior (UINB). Quality of life (QoL) 1: VSP-Ae and VSP-Ap: Perceived life and perceived health of adolescents, quality of life questionnaires (assessments by both the child and parents, respectively). Kidscreen-infants and Kidscreen-parents: quality of life questionnaires (evaluation by children and parents, respectively). For both questionnaires, scores ranged from 0 to 100, with the higher the score, the better the quality of life. Neurocognitive assessment 2: WISC-IV 2a: Weschler Intelligence Scale for Children—4th edition; NEPSY-2 2b: NEuroPSYchological assessment, 2nd edition. Goodman-SDQ (Strengths and Difficulties Questionnaire) 3: score correlated with the Child Behavior Checklist (CBCL) of Achenbach which included 25 items directed toward the parents. The questionnaire reflects a total assessment of the behavioral and emotional problems and defines five subcategories, each composed of five items: (1) Emotional disorder: mean: 0–3, slightly below mean: 4, high: 5–6, very high 7–10; (2) Behaviors: mean 0–2, slightly below average: 3, high: 4–5, very high 6–10; (3) Hyperactivity: mean 0–5, slightly below mean: 6–7, high: 7–8, very high 9–10; (4) Social relationship disorder: mean: 0–2, slightly below mean 3, high: 4, very high 5–10. The total difficulty score is the sum of the first four items. An increase of one point in the total difficulty score corresponds to an increase in the risk of developing a mental disorder. The categories were proposed in order to assess whether the child’s score is in the mean 0–13, slightly below the mean 14–16, high 17–19, or very high 20–40. (5) ”Prosocial” behavior is counted separately and varies in the opposite direction: mean 8–10, slightly below mean: 7, high: 6, very high 0–5. STAIC 4: State–Trait Anxiety Inventory for children. Each STAIC item (Spielberger) constitutes an assigned three-point rating scale with a value of 1, 2, and 3. The final score is obtained by adding the sub-scores for each item and ranges from 20 to 60. The normative data of the STAIC, by age and by sex, were established in the United States (Spielberger, 1973) on the basis of two samples of elementary school children: one sample consisted of 456 girls and 457 boys, in their fourth, fifth, and sixth years of primary school and the other consisted of 281 boys and 357 girls for the same scholastic years. The boy’s group: Anxiety Trait 36.7 SD: 6.32; Anxiety State 31.0 SD 5.71. The girl’s group: Anxiety Trait: 38.0 SD: 6; 68 Anxiety State: 30.7 6.01. Schematically: Standard anxiety state: Normal: 20–40, High Anxiety: higher than 40. Impairment 5: A specific cognitive impairment was considered in the GPQoL study if at least one of the five neuropsychological disorders (classification of mental illnesses according to Diagnostic and Statistical Manual of Mental Disorders, fourth edition (DSM-IV)) was observed: A delay in language was considered if the verbal comprehension index (VCI) 5a was <85, a delay in visuospatial integration was considered if the perceptual reasoning index (PRI) was <85 and Rey figure ≤ 10th percentile, in copy mode 5b, an attention deficit disorder was considered if the auditory attention score was <8 and/or the visual attention score was <8, and if the processing speed index (PSI) 5c was <85, dysexecutive disorders were considered if a working memory index (WMI) was <85 and/or a planning score was <8 and/or a mental flexibility score was <8 and/or inhibition score 5d < 10th; an ideomotor dyspraxia was considered if the Touwen assessment test = complex coordination disorder with anomaly of movement planning and (PRI was <85 and/or IVT was <85) 5e.


2.3. Neurobehavioral Impairment Profiles: Behavioral and Neurocognitive Comorbidities

In Cluster 1 (MODINB), emotional troubles had high scores (4.05 (2.62)), and hyperactivity was slightly below the mean (5.32 (2.45)). The anxiety score was (35.30 (8.28)), 30 children (65.22%) had language delays, and 44 (95.65%) had a dysexecutive syndrome. The other impairments (visuo-spatial integration delay, attention deficit disorder, and ideomotor dyspraxia) were presents in 15 to 17% of the cases (Table 1).
In Cluster 3 (UINB), emotional symptoms were always below the mean and only 26 (33%) of the children had a dysexecutive syndrome. Dysexecutive disorders were a composite of performance across four subtests: working memory index (WMI) < 85 and/or planning score < 8 and/or the mental flexibility score < 8 and/or inhibition score < 10th. It may be that some children had slightly lower performances (just less than −1 SD) on just one of these tests over −1 SD (Table 1).

2.4. Neurobehavioral Cognitive Assessment by Cluster

In Cluster 1 (MODINB), the WMI and the PRI were close to −2 SDs, 74.93 (SD = 11.07), and 77.26 (SD = 8.99) respectively, the other indices were close to −1 SD (Table 1 and Figure 2).
Figure 2. Neuropsychological evaluation of the four WISC IV indices by cluster. Note: Verbal comprehension index (VCI), perceptual reasoning index (PRI), working memory (WMI), and processing speed index (PSI). Average = 100, 1 SD = 15.
In Cluster 2 (MINB), the PSI and the PRI were close to −1 SD, respectively 88.49 (SD = 10.75) and 85.41(SD = 9.24); the other indices (WMI and VCI) were close to the low average.
In Cluster 3 (UINB), the WMI was close to the average as was the PSI, respectively 101.15 (SD = 11.41) and 102.90 (SD = 12.61). The other subtests VCI and PRI were above average with a difference of 0.5 SDs.
Mental flexibility was below average (9.48 (SD = 2.68)) in Cluster 3 (UINB), less than −1 SDs (7.76 (SD = 2.72)) in Cluster 2 (MINB), and less than −2 SDs (6.50 (SD = 2.27)) in Cluster 1 (MODINB) (Table 1 and Figure 3).
Figure 3. Neuropsychological assessment: planning, mental flexibility, auditory, and visual attention according to the clusters. Note: Average: 10, deviation: 3. A <8 score reflected a disorder in the category concerned: <−1 SD).
All clusters had a behavioral score slightly below average for the variable “emotional symptoms”. Cluster 2 (MINB) had a slightly below average “social relationship disorder” score. Cluster 1 (MODINB) had a slightly below average scores for all variables in the Goodman test, except for the variable “prosocial behavior” (Figure 4).
Figure 4. Anxiety assessment by STAI questionnaire and behavior assessments by Goodman-SDQ test by clusters. Note: Goodman-SDQ (Strengths and Difficulties Questionnaire): Scores were correlated with Achenbach’s Child Behavior Checklist (CBCL), including 25 items targeted for the parents. The questionnaire reflected a total assessment score of the difficulties and defined five subcategories composed of five items each: emotional disorders: average: 0–3, slightly below average: 4, high: 5–6, very high 7–10; behaviors: average: 0–2, slightly below average: 3, high: 4–5, very high 6–10; hyperactivity: average: 0–5, slightly below average: 6–7, high: 4–5, very high 6–10; social relationship disorder: average: 0–2, slightly below average: 3, high: 4–6, very high 7–10. A total difficulty score was the sum of the first four items, with each one-point increase corresponding to an increase in the risk of developing a mental disorder. The categories assessed was in the average 0–13, slightly below the average 14–16, high 17–19, or very high 20–40. “Prosocial” behavior is counted separately and varies in the opposite direction: average: 8–10, slightly below average: 7, high: 6, very high 0–5. STAIC: State–Trait Anxiety Inventory for children. Schematically: standard anxiety state: Normal: 20–40, High Anxiety: higher than 40.

2.5. Correlation of Population Study and Quality of Life

The QoL was reduced for all children when compared to the reference population. The exceptions to this were the relationships with the family and the teacher, as evaluated by the parents. For the children, the areas impacted were ranked as (1) Self-esteem, (2) Relationship with friends, and (3) Hobbies. The parents cited the areas most impacted for their children were (1) Psychological well-being, (2) School-work, and (3) General well-being (Table 2).
Table 2. Quality of life comparisons of studied (n = 178) between cluster and reference populations.
  Quality of Life between Study Population vs. Reference Population   Quality of Life between Three Clusters   Quality of Life between Cluster 3 vs. Reference Population
  Study Population
(n = 178)
Reference Population a Difference p Effect Size 3 (Ranking)   Cluster 1 b
(n = 32)
Cluster 2 c
(n = 79)
Cluster 3 d
(n = 67)
p   Reference Population Difference p Effect Size 3 (Ranking)  
  Mean SD Expected Mean Mean SD   Mean SD Mean SD Mean SD Expected Mean Mean SD  
VSP-A ENFANT 1                                          
  Vitality 77.50 19.90 82.46 −4.95 19.96 0.001 * −0.25   77.03 20.90 77.22 19.77 78.06   0.958 82.31 −4.25 19.77 0.083 −0.22  
  General well- being 72.61 17.93 78.38 −5.77 18.02 <0.001 * −0.32   68.15 17.56 74.33 17.23 72.72 18.79 0.259 78.42 −5.70 18.73 0.015 * −0.3 3
  Relationship with friends 46.89 28.11 58.91 −12.02 28.17 <0.001 * −0.43 2 43.29 24.81 46.70 28.66 48.82 29.14 0.659 58.89 −10.07 29.37 0.006 * −0.34 1
  Leisure 62.86 20.52 69.63 −6.77 20.57 <0.001 * −0.33 3 60.16 18.21 63.96 20.81 62.85 21.37 0.679 69.39 −6.54 21 0.013 * −0.31 2
  Relationship with family 74.10 19.05 73.19 0.91 19.10 0.528 0.05   74.38 17.33 74.97 18.55 72.94 20.58 0.813 73.00 −0.06 20.77 0.981 0  
  School work 76.19 23.50 82.08 −5.88 23.45 0.001 * −0.25   60.94 24.75 78.8 21.87 80.41 22.11 <0.001 * 82.16 −1.75 21.98 0.518 −0.08  
  Self esteem 74.20 21.33 84.61 −10.41 21.42 <0.001 * −0.49 1 63.54 22.71 74.74 21.39 78.67 19.00 0.004 * 84.49 −5.82 19.25 0.016 * −0.3  
  Total index 69.19 13.56 75.59 −6.40 13.65 <0.001 * −0.47   63.93 11.5 70.1 13.35 70.64 14.27 0.050 75.51 −4.87 14.31 0.007 * −0.34  
VSP-PARENTS 1                                          
  Vitality 69.92 16.15 77.38 −7.46 16.26 <0.001 * −0.46   65.23 16.43 69.86 16.14 72.23 15.77 0.131 77.36 −5.13 15.66 0.009 * −0.33 3
  Psychological well-being 70.19 20.43 81.34 −11.15 20.50 <0.001 * −0.54 1 70.23 25.58 70.46 19.08 69.85 19.53 0.984 81.19 −11.34 19.57 <0.001 * −0.58 1
  Relationship with friends 59.18 20.04 64.53 −5.36 20.15 <0.001 * −0.27   53.45 20.28 59.49 21.28 61.54 18.08 0.169 64.71 −3.17 18.43 0.163 −0.17  
  Leisure 52.41 18.32 57.01 −4.60 18.30 0.001 * −0.25   50.13 17.53 54.11 19.03 51.49 17.91 0.512 57.85 −5.36 17.85 0.017 * −0.3  
  Relationship with family 77.21 13.65 78.62 −1.41 13.69 0.172 −0.10   75.91 16.08 78.80 13.63 75.96 12.39 0.386 78.51 −2.55 12.32 0.095 −0.21  
  Physical well being 75.78 16.18 78.60 −2.82 16.19 0.021 * −0.17   74.28 16.32 76.58 17.03 75.56 15.26 0.789 78.38 −2.82 15 0.129 −0.19  
  Relationship with teacher 73.17 18.46 75.16 −1.99 18.67 0.157 −0.11   70.31 19.28 74.26 17.05 73.26 19.76 0.596 75.32 −2.06 19.78 0.398 −0.1  
  School work 69.66 20.14 79.80 −10.14 20.18 <0.001 * −0.50 2 60.94 22.17 67.41 18.17 76.49 19.40 0.001 * 79.92 −3.43 19.67 0.158 −0.17  
  Self esteem 78.93 27.33 88.44 −9.50 27.43 <0.001 * −0.35   62.11 32.14 81.17 24.59 84.33 25.13 <0.001 * 88.09 −3.76 25.71 0.236 −0.15  
  General well- being 72.72 15.81 80.12 −7.41 15.89 <0.001 * −0.47 3 72.19 18.24 73.20 15.28 72.40 15.42 0.935 79.94 −7.54 15.38 <0.001 * −0.49 2
  Total Index 69.61 11.17 75.96 −6.36 11.23 <0.001 * −0.57   64.73 12.38 70.24 10.59 71.19 10.75 0.021 * 75.89 −4.69 10.81 0.001 * −0.43  
KIDSCREEN-ENFANT 2                                          
  Total index 72.23 17.63 76.87 −4.65 17.74 0.001 * −0.26   67.39 17.7 73.82 17.26 72.66 17.89 0.213 76.78 −4.12 17.92 0.064 −0.23  
KIDSCREEN-PARENTS 2                                          
  Total index 69.61 14.83 71.84 −2.23 14.83 0.046 * −0.15   64.91 16.16 70.01 14.94 71.37 13.74 0.121 71.84 −0.47 13.74 0.781 −0.03  
Note: a Reference population: French reference population from the European database of 2003 which included a French sample (n = 989) obtained by randomized telephone calls (CATI method: Computer-Assisted Telephone Interview; RDD: Random Digital Dialing). 1 VSP-Ae and VSP-Ap: Perceived Life and Health of Adolescents, quality of life questionnaires (assessments obtained by the child and by the parents’ perspective of their child). The scores vary between 0 and 100. A high score indicates a better quality of life. 2 Kidscreen-infants and Kidscreen-parents Index-10 abridged version: quality of life questionnaires (evaluation by children and by parents’ perspective of their child). Scores range from 0 to 100. The higher the score, the better the quality of life. p < 0.05 *: statistically significant difference. 3 Effect size: Ranked by decrease in quality of life in each area for VSP-Ae and VSP-Ap. Standardized size effect was obtained by dividing the average difference by the standard deviation. 1, 2, and 3 and indicate the top 3 variables in the quality of life areas most affected. Cluster classifications: a classification in three neurobehavioral phenotype profiles was chosen by the algorithm. b Cluster 1: moderate impairment neurobehavior (ModINBP), c Cluster 2: minor impairment neurobehavior (MinINB), d Cluster 3: UnImpaired NeuroBehavior (UINB).


2.5.1. Quality of Life Comparisons between the Neurobehavior Impairment Clusters

There are significant QoL differences between the clusters (as indicated by the total VSP-A index), in self- and hetero-evaluations. The QoL deterioration is determined by the severity of the three neurobehavioral “phenotypes”, which are defined as well as by dysexecutive and/or behavioral disorders. The areas most specifically concerned were the school-work and self-esteem categories (Table 2).

2.5.2. Quality of Life in Cluster 3

UINB as compared to the reference population (Table 2). There was a significant reduction in the QoL in Cluster 3, as compared to the reference population. The most impacted areas for the children were (1) Relationships with friends, (2) Leisure, and (3) General well-being. From a parental point of view, the areas most affecting their children were (1) Psychological well-being, (2) General well-being, and (3) Vitality. The area of school-work was not impacted.

3. Current Insights

We defined broader neurobehavioral profiles, in an individual classification, using three groups of children with different severities from school-aged EPT children with no severe disabilities. There were two group of children with multiple cognitive and behavioral impairments with a gradient of severity (Moderate (MODINB) and Minor (MINB)) and one group of children was classified with an unimpaired cognitive outcome with only slight dysexecutive impairment and emotional behavioral symptoms (UINB). There was a reduction in the QoL in the three NBPs as compared to the reference population confirming the relevance of clustering. The QoL areas most impacted, from the children’s perspective, were self-esteem, relationship with friends, and hobbies. From the parent’s perspectives, the areas most impacted were psychological well-being, school-work, and general well-being. This is consistent with our original study [10]. However, the more the NBP was altered, the more the QoL was decreased. Eventually, the decrease in QoL in an “unimpaired” NBP could be explained by the inability of the VP child to manage his/her emotions and/or executive dysfunction [11].
The Epipage 2 study recently included an analysis of full-scale intelligent quotient (FSIQ), total behavioral difficulties, and developmental coordination disorders to obtain a “composite” score to evaluate neurodevelopmental disorders [9]. This confirmed that an evaluation of the long-term fate of children born preterm is challenging not only because the completeness of even minor disorders is difficult to specify individually but also because the outcome measures must be meaningful at the time, for health professionals, policymakers, parents, and children. Without taking into account the behavioral analysis, the Heeren study [8] classified four subgroups of the neurocognitive profile in the Elgan cohort: one normal, one with a low normal profile, where the impairment was mainly of the executive functions, and two with diffuse impairment (cognitive and executive functions) observed for moderate and severe profiles. This study showed that the FSIQ was insufficient to characterize moderate or minor cognitive impairment of the EPT and that the impact of the executive disorders, such as inhibition, working memory, and mental flexibility, was minimized. In our study for Cluster 3, classified as “unimpaired”, the mean FSIQ score ranged from 101 to 109, and the NePSY subtest score ranged from 9.5 to 11.6. These scores are all within normal range. Only the associated dysexecutive disorders are elevated (30%), and this is a composite of performances across three subtests: Working Memory Index (WISCI-IV), planning, and mental flexibility (NePSY-2). It may be that these children had low performance (just less than -1 ds) on just one of these tests. These findings confirm the role of the worsening of impaired executive functions on the worsening of the cognitive profile of former premature babies and the importance of taking them into account in the description of the clinical outcome [8].
However, a prospective study [3] on a population sample of school-age EPTs with no serious sequelae showed that DCDs were most often associated with comorbidities such as behavioral and/or executive and/or attention disorders. On the other hand, behavioral disorders were present in an identical manner in premature children with or without DCD. This justified long-term follow-up with a complete behavioral, motor, and neurocognitive measurement and thus neurobehavioral profile such as in our work.
Mathewson et al. performed a metanalysis of the behavioral profiles of very premature babies during the school- aged years and in adolescence versus controls born at term [5]. Selecting a population of 2004 premature babies versus 1238 controls shows that the behavioral profiles, depending on their severity, are specific and associated with cognitive or neurological comorbidities. As in our study, in the event of an NBP impairment with minor and moderate difficulties, the behavioral score and the cognitive function were altered. In the NBP with only a dysexecutive disorder, only emotional behavioral disorders were highlighted. Johnson et al. [1][12] proposed, for the first time, the concept of “behavioral phenotype of premature babies”, which would have an impact during their school-aged years and would be characterized by attention deficit/hyperactivity disorders, social and emotional difficulties, and introversion [13][14]. It was the first systematic investigation to disentangle the proposed comorbidity of the preterm behavioral phenotype suggesting, as it did in our study, that there may be more than one behavioral and/or cognitive profile seen in outcome preterm births, some of which may be common to outcome full-term births. Burnett et al. [15][16] confirm this association with a worsening of behavioral disorders, which was also seen in our study, in association with neurological comorbidities, using the theme of cluster-based approaches similar to our study, and they identified four behavioral profiles in five-year-old children born very preterm: Profile 1 grouped those typically developing children who exhibited a neurodevelopmental and psychiatric level similar to that in the general pediatric population. Profile 2 grouped at-risk children with lower neurodevelopmental scores and slightly elevated psychiatric profiles that remained within the typical range. Profile 3 represented the psychiatric group that included children with moderately severe to severe difficulties with executive function and attention deficit hyperactivity disorder (ADHD) and autism spectrum disorders (ASD) symptoms as seen by both the parent and the teacher. Profile 4 characterized children into an inattentive/hyperactive group classified by low cognitive and low language scores, which was reported by many parents and teachers as ADHD. Finally, Korzeniewrski et al. [17] found that children with an IQ greater than 85 had social adjustment disorders in 16% of the cases associated with attention deficit, executive disorders, language, communication, and emotional disorders. This association of disorders is even more important when the FSIQ is <85, as found in our Clusters 1 and 2.
Our work shows that the most affected cognitive areas were similar between the different neurobehavioral profiles: PSI, WMI, PRI, mental flexibility, and emotional behavior with a significant worsening depending on the severity of the NBP. The literature [18][19][20][21] reports that the PSI and WM are independent predictors of academic difficulties amongst the very premature-birth preschool children. Other authors [2][22] hypothesize that a deficit in WM and/or attention and/or PSI, which impact other mental processes, would be the cause of later deficiencies such as speech delay or dysexecutive disorders. According to the author, the PSI deficit (which is dependent on GA) is correlated to executive functions: WM (verbal and visuo-spatial), inhibition, and cognitive flexibility [18][20][23]. Similarly, as in our study, there is a correlation between the measurement of the PSI and/or WM and the behavioral symptoms of impulsivity/hyperactivity and attention disorders.
Our study shows that the NBP of prematurity is a diffuse disorder with a defect of multiple “functions” such as cognitive (executive function), motor, and behavioral disorders, which influences social adaptation. Social adjustments can be indirectly measured by the quality of life (QoL) evaluations. QoL is an individual’s subjective perception of his state of health measured by means of his basic needs: biological, human relationships, work, and leisure [10]. Recently, the QoL of those school-aged EPT children born in France without serious sequelae has been reduced as compared to the reference population [11]. The independent determinants of this population’s QoL are language comprehension disorders, visuo-spatial disorders, executive disorders, and behavioral disorders [11]. These outcomes when the children reach school-age are indicative of their life-long functioning.
A systematic review [24], using instruments such as QoL and measurements of social adaptation and behavior, showed that EPTs had poor social adaptation skills, which appeared early and were persistent during childhood and adulthood, with its severity depending on the GA, brain abnormalities, and socioeconomic status. In our cohort, there was no correlation between the intensity of the neurobehavioral impairment and the GA [18] but rather a correlation with a low weight for GA. There are hypotheses that suggest that this NBP of prematurity is due to cerebral hypo-connectivity, thus leading to diffuse structural anomalies that may sometimes be similar to autism spectrum disorders [25] (although there is a huge spectrum) but with a reduced severity. Connectivity profiles associated with preterm births have been studied in the context of several different psychiatric disorders [1]. The mechanism of cerebral hypo-connectivity in EPTs is correlated with the existence of attention deficit disorders in childhood with one of the predictors being a low growth weight [26].

References

  1. Johnson, S.; Marlow, N. Preterm Birth and Childhood Psychiatric Disorders. Pediatr. Res. 2011, 69, 11R–18R.
  2. Anderson, P.J. Neuropsychological Outcomes of Children Born Very Preterm. Semin. Fetal Neonatal Med. 2014, 19, 90–96.
  3. Bolk, J.; Farooqi, A.; Hafström, M.; Åden, U.; Serenius, F. Developmental Coordination Disorder and Its Association with Developmental Comorbidities at 6.5 Years in Apparently Healthy Children Born Extremely Preterm. JAMA Pediatr. 2018, 172, 765–774.
  4. Bolk, J.; Fredriksson Kaul, Y.; Hellström-Westas, L.; Stjernqvist, K.; Padilla, N.; Serenius, F.; Hellgren, K.; Åden, U. National Population-Based Cohort Study Found that Visual-Motor Integration Was Commonly Affected in Extremely Preterm Born Children at Six-and-a-Half Years. Acta Paediatr. 2018, 107, 831–837.
  5. Mathewson, K.J.; Chow, C.H.T.; Dobson, K.G.; Pope, E.I.; Schmidt, L.A.; Van Lieshout, R.J. Mental Health of Extremely Low Birth Weight Survivors: A Systematic Review and Meta-Analysis. Psychol. Bull. 2017, 143, 347–383.
  6. Fitzallen, G.C.; Taylor, H.G.; Bora, S. What do We Know about the Preterm Behavioral Phenotype? A Narrative Review. Front. Psychiatry 2020, 11, 154.
  7. Korkman, M.; Mikkola, K.; Ritari, N.; Tommiska, V.; Salokorpi, T.; Haataja, L.; Tammela, O.; Pääkkönen, L.; Olsén, P.; Fellman, V. Neurocognitive Test Profiles of Extremely Low Birth Weight Five-Year-Old Children Differ according to Neuromotor Status. Dev. Neuropsychol. 2008, 33, 637–655.
  8. Heeren, T.; Joseph, R.M.; Allred, E.N.; O’Shea, T.M.; Leviton, A.; Kuban, K.C.K. Cognitive Functioning at the Age of 10 Years among Children Born Extremely Preterm: A Latent Profile Approach. Pediatr. Res. 2017, 82, 614–619.
  9. Pierrat, V.; Marchand-Martin, L.; Marret, S.; Arnaud, C.; Benhammou, V.; Cambonie, G.; Debillon, T.; Dufourg, M.-N.; Gire, C.; Goffinet, F.; et al. Neurodevelopmental Outcomes at Age 5 among Children Born Preterm: EPIPAGE-2 Cohort Study. BMJ 2021, 373, n741.
  10. Gire, C.; Resseguier, N.; Brévaut-Malaty, V.; Marret, S.; Cambonie, G.; Souksi-Medioni, I.; Müller, J.-B.; Garcia, P.; Berbis, J.; Tosello, B.; et al. Quality of Life of Extremely Preterm School-Age Children without Major Handicap: A Cross-Sectional Observational Study. Arch. Dis. Child. 2019, 104, 333–339.
  11. Gire, C.; Tosello, B.; Marret, S.; Cambonie, G.; Souksi-Medioni, I.; Müller, J.-B.; Garcia, P.; Berbis, J.; Auquier, P.; Brévaut-Malaty, V.; et al. Specific Cognitive Correlates of the Quality of Life of Extremely Preterm School-Aged Children without Major Neurodevelopmental Disability. Pediatr. Res. 2020, 88, 642–652.
  12. Johnson, S.; Wolke, D. Behavioural Outcomes and Psychopathology during Adolescence. Early Hum. Dev. 2013, 89, 199–207.
  13. Samuelsson, M.; Holsti, A.; Adamsson, M.; Serenius, F.; Hägglöf, B.; Farooqi, A. Behavioral Patterns in Adolescents Born at 23 to 25 Weeks of Gestation. Pediatrics 2017, 140, e20170199.
  14. Taylor, H.G.; Margevicius, S.; Schluchter, M.; Andreias, L.; Hack, M. Persisting Behavior Problems in Extremely Low Birth Weight Adolescents. J. Dev. Behav. Pediatr. 2015, 36, 178–187.
  15. Burnett, A.C.; Anderson, P.J.; Cheong, J.; Doyle, L.W.; Davey, C.G.; Wood, S.J. Prevalence of Psychiatric Diagnoses in Preterm and Full-Term Children, Adolescents and Young Adults: A Meta-Analysis. Psychol. Med. 2011, 41, 2463–2474.
  16. Burnett, A.C.; Youssef, G.; Anderson, P.J.; Duff, J.; Doyle, L.W.; Cheong, J.L.Y.; Victorian Infant Collaborative Study Group. Exploring the “Preterm Behavioral Phenotype” in Children Born Extremely Preterm. J. Dev. Behav. Pediatr. 2019, 40, 200–207.
  17. Korzeniewski, S.J.; Joseph, R.M.; Kim, S.H.; Allred, E.N.; O’Shea, T.M.; Leviton, A.; Kuban, K.C.K.; ELGAN Study Investigators. Social Responsiveness Scale Assessment of the Preterm Behavioral Phenotype in 10-Year-Olds Born Extremely Preterm. J. Dev. Behav. Pediatr. 2017, 38, 697–705.
  18. Mulder, H.; Pitchford, N.J.; Marlow, N. Processing Speed and Working Memory Underlie Academic Attainment in Very Preterm Children. Arch. Dis. Child. Fetal Neonatal Ed. 2010, 95, F267–F272.
  19. Aarnoudse-Moens, C.S.H.; Weisglas-Kuperus, N.; van Goudoever, J.B.; Oosterlaan, J. Meta-Analysis of Neurobehavioral Outcomes in Very Preterm and/or Very Low Birth Weight Children. Pediatrics 2009, 124, 717–728.
  20. Mulder, H.; Pitchford, N.J.; Marlow, N. Processing Speed Mediates Executive Function Difficulties in Very Preterm Children in Middle Childhood. J. Int. Neuropsychol. Soc. 2011, 17, 445–454.
  21. Omizzolo, C.; Scratch, S.E.; Stargatt, R.; Kidokoro, H.; Thompson, D.K.; Lee, K.J.; Cheong, J.; Neil, J.; Inder, T.E.; Doyle, L.W.; et al. Neonatal Brain Abnormalities and Memory and Learning Outcomes at 7 Years in Children Born Very Preterm. Memory 2014, 22, 605–615.
  22. Hutchinson, E.A.; De Luca, C.R.; Doyle, L.W.; Roberts, G.; Anderson, P.J.; Victorian Infant Collaborative Study Group. School-Age Outcomes of Extremely Preterm or Extremely Low Birth Weight Children. Pediatrics 2013, 131, e1053–e1061.
  23. Mulder, H.; Pitchford, N.J.; Hagger, M.S.; Marlow, N. Development of Executive Function and Attention in Preterm Children: A Systematic Review. Dev. Neuropsychol. 2009, 34, 393–421.
  24. Ritchie, K.; Bora, S.; Woodward, L.J. Social Development of Children Born Very Preterm: A Systematic Review. Dev. Med. Child Neurol. 2015, 57, 899–918.
  25. Conti, E.; Calderoni, S.; Marchi, V.; Muratori, F.; Cioni, G.; Guzzetta, A. The First 1000 Days of the Autistic Brain: A Systematic Review of Diffusion Imaging Studies. Front. Hum. Neurosci. 2015, 9, 159.
  26. Tymofiyeva, O.; Gano, D.; Trevino, R.J.; Glass, H.C.; Flynn, T.; Lundy, S.M.; McQuillen, P.S.; Ferriero, D.M.; Barkovich, A.J.; Xu, D. Aberrant Structural Brain Connectivity in Adolescents with Attentional Problems Who Were Born Prematurely. AJNR Am. J. Neuroradiol. 2018, 39, 2140–2147.
More
Information
Subjects: Pediatrics
Contributor MDPI registered users' name will be linked to their SciProfiles pages. To register with us, please refer to https://encyclopedia.pub/register :
View Times: 354
Revisions: 2 times (View History)
Update Date: 03 Nov 2021
1000/1000