Your browser does not fully support modern features. Please upgrade for a smoother experience.
Submitted Successfully!
 +1 credit
Thank you for your contribution! You can also upload a video entry or images related to this topic.
For video creation, please contact our Academic Video Service.
| Version | Summary | Created by | Modification | Content Size | Created at | Operation |
|---|---|---|---|---|---|---|
| 1 | Daniel Walke | + 1567 word(s) | 1567 | 2021-10-20 09:34:23 | | | |
| 2 | Amina Yu | + 53 word(s) | 1620 | 2021-11-02 03:37:28 | | |
Video Upload Options
We provide professional Academic Video Service to translate complex research into visually appealing presentations. Would you like to try it?
Cite
If you have any further questions, please contact Encyclopedia Editorial Office.
Walke, D. MPA_Pathway_Tool: Assignment of Microbial Omics-Data by Metabolic Pathways. Encyclopedia. Available online: https://encyclopedia.pub/entry/15599 (accessed on 08 February 2026).
Walke D. MPA_Pathway_Tool: Assignment of Microbial Omics-Data by Metabolic Pathways. Encyclopedia. Available at: https://encyclopedia.pub/entry/15599. Accessed February 08, 2026.
Walke, Daniel. "MPA_Pathway_Tool: Assignment of Microbial Omics-Data by Metabolic Pathways" Encyclopedia, https://encyclopedia.pub/entry/15599 (accessed February 08, 2026).
Walke, D. (2021, November 01). MPA_Pathway_Tool: Assignment of Microbial Omics-Data by Metabolic Pathways. In Encyclopedia. https://encyclopedia.pub/entry/15599
Walke, Daniel. "MPA_Pathway_Tool: Assignment of Microbial Omics-Data by Metabolic Pathways." Encyclopedia. Web. 01 November, 2021.
Copy Citation
MPA_Pathway_Tool. it consists of two parts, called ‘Pathway-Creator’ and ‘Pathway-Calculator’. The ‘Pathway-Creator’ enables an easy set-up of user-defined pathways with specific taxonomic constraints. The ‘Pathway-Calculator’ automatically maps microbial community data from multiple measurements on selected pathways and visualizes the results. The MPA_Pathway_Tool is implemented in Java and ReactJS.
omics
web application
pathway generation
pathway mapping
1. Introduction
There are several different approaches for analyzing microbial communities, focusing on the entirety of the genes (metagenomics), transcripts (metatranscriptomics), or proteins (metaproteomics). Whereas metagenomics reveals only the presence of genes, and metatranscriptomics only the gene expression, metaproteomics indicates actual protein expression [1]. On the basis of the protein expression levels, a microbial communities’ phenotype can be linked with specific environmental conditions, process parameters, or diseases [2]. Due to the complexity and amount of multi-omics data, comprehensive bioinformatic workflows were developed for the data evaluation [3][4][5][6][7]. For example, the MetaProteomeAnalyzer (MPA) enables the analysis and and interpretation of metaproteomic data sets. It offers a free, open-source, end user-oriented complete pipeline from peak lists to taxonomic and functional result evaluation. Among others, the MPA links identified proteins to functional categories (e.g., biological keywords) and the KEGG pathways [4]. In addition to the KEGG pathway system [8], several other pathway collection and mapping tools such as Reactome [9], Escher [10], and Pathway Tools [11] exist, supporting the data analysis of omics-datasets. For more details about the assignment of genes and proteins to functions and pathways, please refer to Mao et al. (2005) [12].
However, due to the microbial metabolism’s versatility and constantly newly discovered biological pathways [13], linkage to standard pathway maps is insufficient for many microbial community studies. Therefore, new tools are required that are tailored for microbial community studies.
In general, a good pathway tool needs to meet at least the following six criteria: (i) It should provide an easy and intuitive creation of pathways to enable the fast generation of multiple pathways. (ii) Since new reactions are discovered and pathways might be updated, the tool should support modifying the pathway maps, i.e., appending new and deleting existent reactions. (iii) Already created pathways from different databases should be reusable. Consequently, the pathway tool should provide an import function for standard exchange formats, such as comma-separated values (CSV), JavaScript Object Notations (JSON), and Systems Biology Markup Language (SBML) formats. (iv) The pathway tool should also map experimental data on created pathways and highlight differences between the considered samples. (v) Since metabolic reactions are taxonomy-specific, the pathway tool needs a filter to distinguish between reactions carried out by a specific taxon. One example of this specificity is the hydrogenotrophic methanogenesis and the Wood–Ljungdahl pathway. Both pathways share similar enzymes (i.e., similar Enzyme Commission numbers (EC numbers)). However, hydrogenotrophic methanogenesis is carried out only by archaea [14], while the Wood–Ljungdahl pathway is carried out mainly by bacteria [1]. (vi) The tool should be independent of operating systems so that nearly everyone can use the tool, favoring an implementation as a web application.
2. The ‘Pathway-Creator’ Enables Users to Define Their Own Metabolic Pathways
The first part of the MPA_Pathway_Tool, the ‘Pathway-Creator’ (Figure 1), enables the creation of user-defined pathways by adding reactions iteratively and linking omics data to this pathway. The menu (left side) allows for uploading of experimental data and pathways (such as CSV, JSON, and SBML), adding new user-defined reactions or reactions from KEGG, and downloading created pathways (such as CSV, SBML, JSON, and Scalable Vector Graphics (SVG)) and mapped data (such as CSV). The right side visualizes the created pathway. Circular-shaped nodes (metabolites; in KEGG referred to as compounds) and diamond-shaped nodes (reactions) are connected by arrows displaying the direction of each reaction. After a sample of previously uploaded data is selected by clicking on the respective button (bottom side of the tool), reaction nodes are colored dependent on their abundance in the sample. Information about abundances in all samples for a specific reaction is available as a heatmap by clicking on the respective reaction node.
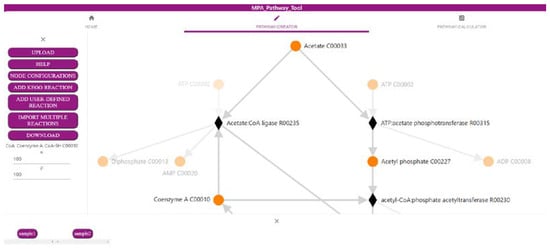
Figure 1. Screenshot of the ‘Pathway-Creator’ of the MPA_Pathway_Tool (details in Section 2.1).
3. The ‘Pathway-Calculator’ Enables Automated Mapping of Experimental Data on Multiple Metabolic Pathways
The ‘Pathway-Calculator’ (Figure 2) consists of two upload zones, one for experimental data and another for multiple pathway files (such as CSV, JSON, or SBML). It performs mapping (details in Section 3.3) of experimental data on uploaded pathways. After experimental data are mapped on uploaded pathways, the resulting table can be downloaded as CSV. Furthermore, a list with all unmatched features (e.g., proteins) can be exported. Details about the taxonomic structure of data mapped on analyzed pathways can be found under ‘See Details’. Finally, we also provide metadata about the mapping containing among others mapping time, used experimental data, and pathways. It fulfills the FAIR (findable, accessible, interoperable, and reusable) principles [15] and highlights the importance of emerging metadata standards [16].
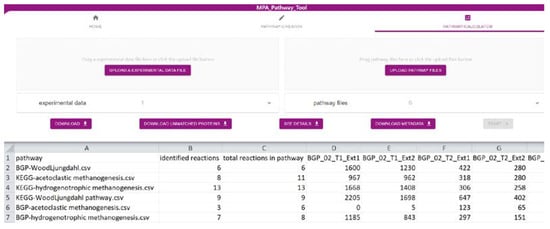
Figure 2. Screenshot of the ‘Pathway-Calculator’ of the MPA_Pathway_Tool (details in Section 2.2).
Finally, we tested the performance of the ‘Pathway-Calculator’ by uploading experimental data with different file sizes (10,000 proteins, 100,000 proteins, and 1,000,000 proteins with 44 samples per test) and a different number of pathways on a local desktop computer (AMD Ryzen 5 3600, 16 GB DDR4 RAM 3000 MHz, Chrome Browser version 89.0.4389.90). We utilized 1, 10, and 100 copies of the user-defined Wood–Ljungdahl pathway used in Heyer et al. [1] (Biogas plant (BGP)-Wood–Ljungdahl pathway) for the performance test. Each test with 10,000 and 100,000 proteins finished within 1 min, indicating a good performance for most files. Tests with 1,000,000 proteins took longer (up to 12 min) caused by higher upload times and high requirements on memory and on CPU performance (Table 1).
Table 1. Performance test for the ‘Pathway-Calculator’ (details in Section 2.2).
| Experimental Data | 1 Pathway | 10 Pathways | 100 Pathways |
|---|---|---|---|
| 10,000 proteins | 5 s | 5 s | 6 s |
| 100,000 proteins | 5 s | 10 s | 36 s |
| 1,000,000 proteins | 192 s | 244 s | 712 s |
4. Tool Validation with Experimental Data
Validation of the MPA_Pathway_Tool was carried out by comparing our pathway assignment against a manual pathway assignment of a previous metaproteomics study regarding biogas plants [1]. Additionally, we assigned the proteins to the standard KEGG pathways (in KEGG referred to as KEGG MODULEs) to illuminate the demand for user-specific pathways.
For the evaluation, we created six pathway maps (BGP-hydrogenotrophic methanogenesis, BGP-acetoclastic methanogenesis, BGP-Wood–Ljungdahl pathway, KEGG-hydrogenotrophic methanogenesis, KEGG-acetoclastic methanogenesis, and KEGG-Wood–Ljungdahl pathway). The user-defined pathways (BGP; Figures S3–S5) and the KEGG pathways (Figures S6–S8) were created with the ‘Pathway Creator’ (further details in Supplementary File S17). For each pathway, a taxonomic classification was added (Table 2). According to the publication of the dataset, we decided to exclude Archaea from the Wood–Ljungdahl pathway and include only Archaea for the hydrogenotrophic and acetoclastic methanogenesis [1]. Subsequently, the experimental metaproteomics data (Supplementary File S9) were mapped on each pathway using multiple pathways (Figure 3; Supplementary File S1) and single pathway mapping (Figure 4; Supplementary File S10–S15). Unmatched proteins were downloaded as CSV (Supplementary File S2).
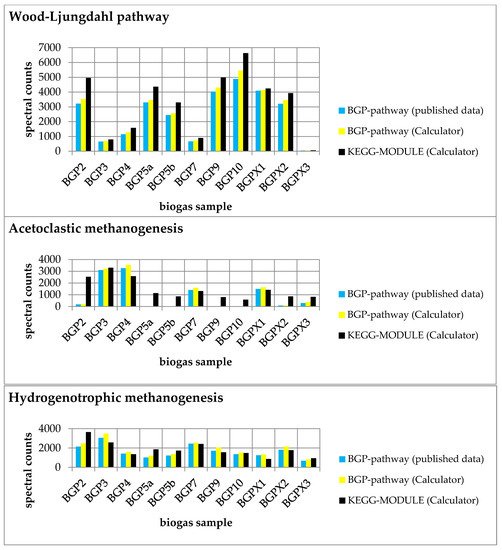
Figure 3. Comparison of experimental data mapped on each pathway (Wood–Ljungdahl pathway, acetoclastic methanogenesis, and hydrogenotrophic methanogenesis) with published data [1]. Summed spectral counts plotted against all biogas samples are blue and yellow for user-defined pathways and black for KEGG MODULEs. The results were obtained from the ‘Pathway-Calculator’ (yellow and black) and published data (blue). In particular, acetoclastic methanogenesis showed higher spectral counts in most samples, indicating the occurrence of unspecific reactions.
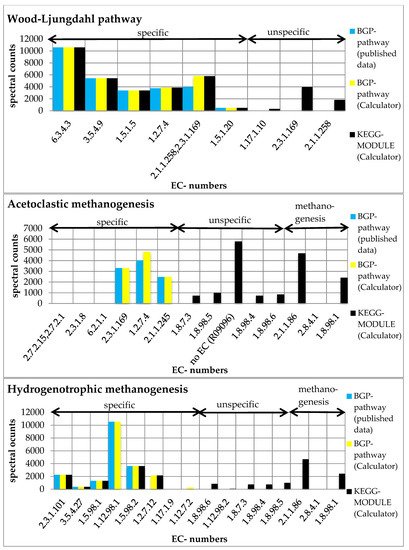
Figure 4. Summed spectral counts of each reaction in the Wood–Ljungdahl pathway, acetoclastic methanogenesis, and hydrogenotrophic methanogenesis. Results from published data [1] are visualized in blue, results from the ‘Pathway-Calculator’ that are user-defined are shown in yellow, and results from the ‘Pathway-Calculator’ for KEGG MODULEs are shown in black. All KEGG MODULEs possess additional unspecific reactions. KEGG-acetoclastic methanogenesis and KEGG-hydrogenotrophic methanogenesis possess three additional reactions (2.1.1.86, 2.8.4.1., and 1.8.98.1) that catalyze the last steps of the methanogenesis (see Supplementary File S19).
Table 2. Taxonomic classification of each pathway.
| Pathway | Added Taxonomic Requirement |
|---|---|
| BGP-hydrogenotrophic methanogenesis (user-defined) | only Archaea |
| KEGG-hydrogenotrophic methanogenesis (KEGG-MODULE) | only Archaea |
| BGP-acetoclastic methanogenesis (user-defined) | only Archaea |
| KEGG-acetoclastic methanogenesis (KEGG-MODULE) | only Archaea |
| BGP-Wood–Ljungdahl pathway (user-defined) | all except Archaea |
| KEGG-Wood–Ljungdahl pathway (KEGG-MODULE) | all except Archaea |
The summed spectral counts mapped on each user-defined pathway were slightly greater than in the published experimental data, indicating a small information loss in the previous publication (Supplementary File S18).
Furthermore, we compared the results of each BGP pathway with the corresponding KEGG pathway. We observed higher spectral counts for the created KEGG MODULEs compared to the respective BGP pathways (Figure 3). Higher spectral counts in KEGG MODULEs are caused by an integration of more reactions in the KEGG MODULEs than in the BGP pathways (Figure 4). For example, KEGG-acetoclastic methanogenesis and KEGG-hydrogenotrophic methanogenesis possess three additional reactions (2.1.1.86, 2.8.4.1., and 1.8.98.1) that catalyze the last steps of the methanogenesis. BGP pathways include only pathway-specific reactions to prevent wrong pathway identification.
5. Conclusion: The MPA_Pathway_Tool Provides An Easy and Fast Option to Set up Multiple Pathways
We successfully implemented the pathway tool to meet all of our six defined criteria: (i) The MPA_Pathway_Tool provides an easy and fast setup of multiple pathways. Multiple reactions can be imported using various options, e.g., import by EC numbers, import of a KEGG MODULE, or import of entire SBML files. (ii) A further modification of the generated pathways is possible by deleting reactions and adding new reactions (from the KEGG database and user-defined reactions). (iii) As interchange formats, JSON, CSV, and SBML were implemented. (iv) Experimental data from metaproteomics, metatranscriptomics, and metagenomics studies can be automatically mapped on single pathways (‘Pathway-Creator’) and multiple pathways (‘Pathway-Calculator’). The results of pathway mapping can also be exported as CSV. (v) The mapping algorithm includes a taxonomic filter that was successfully applied by comparing our results with published experimental data for the stated pathways. (vi) The MPA_Pathway_Tool was implemented as a stand-alone web application to guarantee independence from users’ operating systems.
References
- Heyer, R.; Schallert, K.; Siewert, C.; Kohrs, F.; Greve, J.; Maus, I.; Klang, J.; Klocke, M.; Heiermann, M.; Hoffmann, H.; et al. Metaproteome Analysis Reveals That Syntrophy, Competition, and Phage-Host Interaction Shape Microbial Communities in Biogas Plants. 2019. Available online: https://microbiomejournal.biomedcentral.com/articles/10.1186/s40168-019-0673-y (accessed on 8 October 2021).
- Heyer, R.; Schallert, K.; Büdel, A.; Zoun, R.; Dorl, S.; Behne, A.; Kohrs, F.; Püttker, S.; Siewert, C.; Muth, T.; et al. A Robust and Universal Metaproteomics Workflow for Research Studies and Routine Diagnostics Within 24 h Using Phenol Extraction, FASP Digest, and the MetaProteomeAnalyzer. Front. Microbiol. 2019, 10, 1883.
- Giardine, B.; Riemer, C.; Hardison, R.C.; Burhans, R.; Elnitski, L.; Shah, P.; Zhang, Y.; Blankenberg, D.; Albert, I.; Taylor, J.; et al. Galaxy: A platform for interactive large-scale genome analysis. Genome Res. 2005, 15, 1451–1455.
- Muth, T.; Behne, A.; Heyer, R.; Kohrs, F.; Benndorf, D.; Hoffmann, M.; Lehtevä, M.; Reichl, U.; Martens, L.; Rapp, E. The MetaProteomeAnalyzer: A powerful open-source software suite for metaproteomics data analysis and interpretation. J. Proteome Res. 2015, 14, 1557–1565.
- Lange, E.; Reinert, K.; Groepl, C.; Kohlbacher, O.; Sturm, M.; Hildebrandt, A. OPENMS; A Generic Open Source Framework for Chromatography/MS-Based Proteomics. 2005. Available online: http://publications.imp.fu-berlin.de/352/ (accessed on 8 October 2021).
- Leipzig, J. A review of bioinformatic pipeline frameworks. Brief. Bioinform. 2017, 18, 530–536.
- Blank, C.; Easterly, C.; Gruening, B.; Johnson, J.; Kolmeder, C.A.; Kumar, P.; May, D.; Mehta, S.; Mesuere, B.; Brown, Z.; et al. Disseminating Metaproteomic Informatics Capabilities and Knowledge Using the Galaxy-P Framework. Proteomes 2018, 6, 7.
- Kanehisa, M.; Goto, S.; Sato, Y.; Furumichi, M.; Tanabe, M. KEGG for integration and interpretation of large-scale molecular data sets. Nucleic Acids Research 2012, 40, D109–D114.
- Joshi-Tope, G.; Gillespie, M.; Vastrik, I.; D’Eustachio, P.; Schmidt, E.; de Bono, B.; Jassal, B.; Gopinath, G.R.; Wu, G.R.; Matthews, L.; et al. Reactome: A knowledgebase of biological pathways. Nucleic Acids Res. 2005, 33, D428–D432.
- King, Z.A.; Dräger, A.; Ebrahim, A.; Sonnenschein, N.; Lewis, N.E.; Palsson, B.O. Escher: A Web Application for Building, Sharing, and Embedding Data-Rich Visualizations of Biological Pathways. PLoS Comput. Biol. 2015, 11, e1004321.
- Karp, P.D.; Paley, S.M.; Midford, P.E.; Krummenacker, M.; Billington, R.; Kothari, A.; Ong, W.K.; Subhraveti, P.; Keseler, I.M.; Caspi, R. Pathway Tools version 24.0: Integrated Software for Pathway/Genome Informatics and Systems Biology. 2015. Available online: https://arxiv.org/pdf/1510.03964 (accessed on 8 October 2021).
- Mao, X.; Cai, T.; Olyarchuk, J.G.; Wei, L. Automated genome annotation and pathway identification using the KEGG Orthology (KO) as a controlled vocabulary. Bioinformatics 2005, 21, 3787–3793.
- Zhu, X.; Campanaro, S.; Treu, L.; Seshadri, R.; Ivanova, N.; Kougias, P.G.; Kyrpides, N.; Angelidaki, I. Metabolic dependencies govern microbial syntrophies during methanogenesis in an anaerobic digestion ecosystem. Microbiome 2020, 8, 22.
- Wagner, T.; Watanabe, T.; Shima, S. Hydrogenotrophic Methanogenesis. In Biogenesis of Hydrocarbons; Stams, A.J., Sousa, D., Eds.; Springer: Cham, Switzerland, 2020; ISBN 978-3-319-53114-4.
- Wilkinson, M.D.; Dumontier, M.; Aalbersberg, I.J.J.; Appleton, G.; Axton, M.; Baak, A.; Blomberg, N.; Boiten, J.-W.; da Silva Santos, L.B.; Bourne, P.E.; et al. The FAIR Guiding Principles for scientific data management and stewardship. Sci Data 2016, 3, 160018.
- Vangay, P.; Burgin, J.; Johnston, A.; Beck, K.L.; Berrios, D.C.; Blumberg, K.; Canon, S.; Chain, P.; Chandonia, J.-M.; Christianson, D.; et al. Microbiome Metadata Standards: Report of the National Microbiome Data Collaborative’s Workshop and Follow-On Activities. mSystems 2021, 6.
More
Information
Subjects:
Biotechnology & Applied Microbiology
Contributor
MDPI registered users' name will be linked to their SciProfiles pages. To register with us, please refer to https://encyclopedia.pub/register
:
View Times:
894
Revisions:
2 times
(View History)
Update Date:
02 Nov 2021
Table of Contents


Notice
You are not a member of the advisory board for this topic. If you want to update advisory board member profile, please contact office@encyclopedia.pub.
OK
Confirm
Only members of the Encyclopedia advisory board for this topic are allowed to note entries. Would you like to become an advisory board member of the Encyclopedia?
Yes
No
${ textCharacter }/${ maxCharacter }
Submit
Cancel
Back
Comments
${ item }
|
${ item.createdUser.fullName }
${ item.createdAt }
${ item.vote }
${ item.reply }
Delete
${ reply.createdUser.fullName }
${ reply.createdAt }
${ reply.vote }
Delete
There is no reply to this comment~
${ item.replyTextCharacter }/${ item.replyMaxCharacter }
Submit
Cancel
More
No more~
There is no comment~
${ textCharacter }/${ maxCharacter }
Submit
Cancel
${ selectedItem.replyTextCharacter }/${ selectedItem.replyMaxCharacter }
Submit
Cancel
Confirm
Are you sure to Delete?
Yes
No