Your browser does not fully support modern features. Please upgrade for a smoother experience.
Submitted Successfully!
 +1 credit
Thank you for your contribution! You can also upload a video entry or images related to this topic.
For video creation, please contact our Academic Video Service.
| Version | Summary | Created by | Modification | Content Size | Created at | Operation |
|---|---|---|---|---|---|---|
| 1 | Yong Liu | + 2405 word(s) | 2405 | 2021-10-13 05:07:41 | | | |
| 2 | Jason Zhu | -1 word(s) | 2404 | 2021-10-15 03:53:40 | | | | |
| 3 | zili zhang | Meta information modification | 2404 | 2021-10-15 11:43:42 | | |
Video Upload Options
We provide professional Academic Video Service to translate complex research into visually appealing presentations. Would you like to try it?
Cite
If you have any further questions, please contact Encyclopedia Editorial Office.
Liu, Y.; Zhang, Z. Reduced Fertilization and Biochar Supplementation on Soil Fertility. Encyclopedia. Available online: https://encyclopedia.pub/entry/15028 (accessed on 08 February 2026).
Liu Y, Zhang Z. Reduced Fertilization and Biochar Supplementation on Soil Fertility. Encyclopedia. Available at: https://encyclopedia.pub/entry/15028. Accessed February 08, 2026.
Liu, Yong, Zili Zhang. "Reduced Fertilization and Biochar Supplementation on Soil Fertility" Encyclopedia, https://encyclopedia.pub/entry/15028 (accessed February 08, 2026).
Liu, Y., & Zhang, Z. (2021, October 14). Reduced Fertilization and Biochar Supplementation on Soil Fertility. In Encyclopedia. https://encyclopedia.pub/entry/15028
Liu, Yong and Zili Zhang. "Reduced Fertilization and Biochar Supplementation on Soil Fertility." Encyclopedia. Web. 14 October, 2021.
Copy Citation
Generally, the partial substitution of chemical fertilizer with palm silk biochar (PSB) at a low application rate may not substantially reduce plant-available NO3−-N and Olsen-P. It can also contribute to the sustainable availability of N and P in vegetable farmland soil via a variety of transformation processes, such as mineralization, immobilization, and loss.
biochar
chemical fertilizer reduction
co-application
partial substitution
nitrogen and phosphorus availability
in situ incubation
1. Introduction
As the mainstay industry of agriculture in China, vegetable farming has become one major source of household income for many farmers [1]. Fertilization plays a decisive role in enhancing vegetable yields and profitability in southern China [2][3]. Based on the data of 2018 Guangdong Statistical Yearbook on Agriculture [4], crop farming in Guangdong Province in 2017 consumed 9.10 × 10⁵ t of nitrogen (N) fertilizer and 1.25 × 10⁵ t of phosphorus (P) fertilizer (on N and P basis, respectively), over 29% of which were used to improve vegetable production. By comparing the annual change in chemical fertilizer consumption in Guangdong Province, the rate of N fertilizer applied in 2017 was only 4% lower than that in 2007, whereas the rate of P fertilizer applied between 2007 and 2017 increased dramatically by 36% [4][5]. Furthermore, with increasing amounts of chemical fertilizer input, the average annual input intensity of chemical fertilizer (chemical fertilizer use per unit area of planted land) has shown an increase of 12% during the past 10 years [4][5]. However, it has far exceeded the maximum safe ceiling of 225 kg hm−2, which was determined by developed countries to prevent chemical fertilizer from polluting water bodies.
Long-term excessive fertilization has resulted in increased fertilizer nutrient surpluses in Guangdong Province [6]. In vegetable farmlands with different planting patterns, the overuse of fertilizers for vegetable production may not only decrease nutrient use efficiency, but also cause the risk of N and P losses via runoff or leaching from soils to adjacent waters [2][3]. According to the First National Pollution Source Census Bulletin in Guangdong Province, the total N and P losses from the planting industry in 2007 were 6.64 × 10⁴ and 7.40 × 10³ t, respectively [7], accounting for 3% and 0.3% of chemical fertilizer input during the same period, respectively. Therefore, soil N and P losses caused by long-term excessive fertilization cannot be ignored. Nowadays, the resulting agricultural non-point source pollution has become one important factor affecting ecological safety and human health. How to improve N and P availability in soils with minimal adverse environmental impacts has long been a hot topic for the research of nutrient management in agroecosystems.
Biochar is a solid product of biomass (e.g., crop residues, forestry wastes, animal feces), formed by pyrolysis at a relatively low temperature (<700 °C) within an anoxic environment [8]. Generally, it has a high porosity, large specific surface area, more surface charge, and strong stability [8]. In recent years, biochar has received more and more attention globally as a promising soil amendment for its role in emission mitigation and carbon (C) sequestration in agroecosystems. Biochar amendment can alter soil nutrient availability and its C:N:P stoichiometric ratios, which are critical in the regulation of nutrient transformation in the soil ecosystem [9][10]. Mineral N (i.e., NH4+-N and NO3−-N) and available P (e.g., Olsen-P) are the two important indexes of soil nutrient availability, and their concentrations are greatly affected by biochar amendment [11][12]. Transformations (e.g., mineralization, immobilization, and loss) of N and P are the two most important aspects of nutrient cycling in biochar-amended soil [11]. The interaction of biochar with soil can directly or indirectly affect the mineralization, immobilization, and loss processes of N and P by altering the biotic (e.g., microbial and enzymatic) and abiotic (e.g., physical and chemical) drivers of N and P cycling [13][14]. Thus far, many scholars and researchers from domestic areas and abroad have studied the biochar effects on the mineralization, immobilization, and losses that influence the concentrations of NH4+-N, NO3−-N, and Olsen-P in soil. Aiming at the elucidation of the availability and transformations of N and P in biochar-amended soil, several kinds of determination methods can be used and have been summarized, including (1) a soil incubation method to determine N and P mineralization [15][16], (2) an isotope tracer method to determine N immobilization [17][18], (3) an adsorption–desorption method to determine P immobilization [14][19], (4) a leachate collection method to determine N and P leaching [20][21], (5) an airflow enclosure method to determine NH3 volatilization [22][23], and (6) a static chamber method to determine N2O emission [24][25]. However, most of the studies on the availability and transformations of N and P in biochar-amended soil involve controlled experiments in a laboratory and are usually concentrated in a single process [13][14]. In addition, given the fact that a high degree of spatial variability exists under actual field conditions, the results of field pilot studies regarding the biochar effects on the availability and transformation processes of N and P in soil are confronted with uncertainties at different locations [14][24]. Presently, there is a need for in situ measurements of soil N and P dynamics under various field conditions, especially when considering the impact of the combined application of chemical fertilizer and biochar.
There have been many studies that have focused on the combined effects of chemical fertilizer and biochar on regulating the availability and losses of soil N and P under the influences of different soil properties (e.g., soil texture and pH), fertilizer types (e.g., urea and NH4NO3), biochar characteristics (e.g., biomass source and preparation condition), and experimental conditions (e.g., biochar application rate and residence time of biochar in soil). For example, applying both urea and biochar decreased NH4+-N but increased NO3−-N, whereas the co-application of NH4NO3 and biochar reduced both forms of mineral N in soil [12]. In the presence of urea and monoammonium phosphate, biochar increased the concentrations of Olsen-P and labile P in two alkaline chernozemic soils [11]. Hangs et al. [26] observed that the combination of urea with added biochar mitigated the increased N2O emission from two neutral agricultural soils; nevertheless, the accelerated urea hydrolysis in the presence of biochar may increase NH3 volatilization associated with urea fertilization. Although the partial substitution of diammonium phosphate with biochar mitigated the fluxes of N and P outputs from paddy field water [27], there are still few reports on the in situ study of reduced chemical fertilization coupled with biochar supplementation to regulate the availability and transformation patterns of N and P in vegetable farmland soil. In particular, the mineralization, immobilization, and losses of N and P in biochar-amended soil remain unclear.
2. Soil pH
Compared with the non-fertilization treatment (Control), the soil pH decreased significantly (p < 0.05) in almost all fertilization treatments (except CF90B10 for the C-tube and CF100 for the O-tube), regardless of the type of tubes (Figure 2). Compared with the CF100 treatment, the soil pH also decreased significantly (p < 0.05) in the CF80B20 treatment for the C-tube.
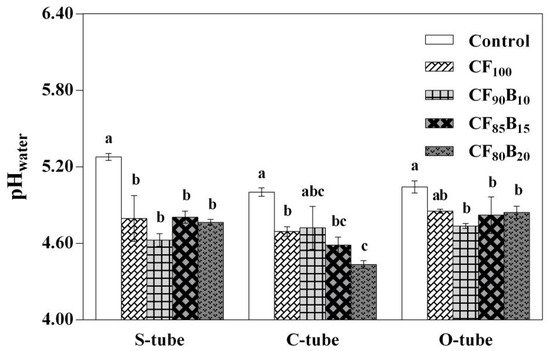
Figure 2. Coupled effect of reduced chemical fertilization and palm silk biochar (PSB) supplementation on pHwater in 0–40 cm soil layer. Abbreviations: S-tube, starting tube; C-tube, top-covered tube; O-tube, top-open tube. Treatments: Control, no fertilization; CF100, 100% conventional fertilization; CF90B10, 90% conventional fertilization plus 10% PSB-based fertilization; CF85B15, 85% conventional fertilization plus 15% PSB-based fertilization; CF80B20, 80% conventional fertilization plus 20% PSB-based fertilization. Data are expressed as means ± SD (n = 3). For each tube type, bars labeled with different lowercase letters (e.g., a, b, c, etc.) indicate significant (p < 0.05) differences among the treatments based on the Tukey test or Games-Howell test.
3. Soil Mineral N and Available P
3.1. NH4+-N, NO3−-N, and Mineral N Concentrations in Soil
Compared with the CF100 treatment, the soil NH4+-N concentration was decreased significantly (p < 0.05) in the non-fertilization (Control) and all PSB-based fertilization treatments (except CF90B10 for the S-tube), regardless of the type of tubes (Table 4). In addition, the higher reduction in chemical fertilization resulted in a greater percentage decrease in NH4+-N. For the S-tube, the percentage decreases in NH4+-N in the CF90B10, CF85B15, and CF80B20 treatments were −5%, −15%, and −20%, respectively—of which, the latter two were in good agreement with the chemical fertilizer reductions of 15% and 20%, respectively. Similar observations were obtained for the soil mineral N concentration and its percentage decrease in the CF80B20 relative to CF100 treatments.
Table 4. Concentrations of mineral N (NH4+-N and NO3−-N) and available P (Olsen-P) (mg kg−1) in 0–40 cm soil layer in three types of tubes and their percentage changes (±%) in the palm silk biochar (PSB)-based fertilization relative to 100% conventional fertilization treatments.
| Tube Type | Treatment | NH4+-N | NO3−-N | Mineral N | Olsen-P | ||||
|---|---|---|---|---|---|---|---|---|---|
| mg kg−1 | ±% | mg kg−1 | ±% | mg kg−1 | ±% | mg kg−1 | ±% | ||
| S-tube | Control | 2.40 ± 0.15 d | — | 3.78 ± 0.58 c | — | 6.18 ± 0.43 d | — | 27.0 ± 2.4 c | — |
| CF100 | 122 ± 1 a | — | 79.2 ± 9.3 ab | — | 201 ± 10 a | — | 227 ± 1 a | — | |
| CF90B10 | 116 ± 2 a | −4.92 | 89.9 ± 6.6 a | 13.5 | 206 ± 6 a | 2.69 | 221 ± 5 a | −2.64 | |
| CF85B15 | 104 ± 4 b | −14.8 | 74.7 ± 8.1 ab | −5.68 | 178 ± 4 b | −11.2 | 224 ± 2 a | −1.32 | |
| CF80B20 | 97.5 ± 2.1 c | −20.1 | 61.6 ± 7.8 b | −22.2 | 159 ± 9 c | −20.8 | 184 ± 1 b | −18.9 | |
| C-tube | Control | 8.98 ± 2.38 e | — | 7.13 ± 0.93 d | — | 16.1 ± 1.5 d | — | 37.2 ± 6.2 c | — |
| CF100 | 309 ± 16 a | — | 106 ± 4 c | — | 415 ± 18 a | — | 209 ± 15 a | — | |
| CF90B10 | 231 ± 8 b | −25.2 | 116 ± 18 bc | 9.43 | 347 ± 22 b | −16.4 | 196 ± 6 a | −6.22 | |
| CF85B15 | 194 ± 18 c | −37.2 | 147 ± 15 a | 38.7 | 340 ± 29 b | −18.1 | 183 ± 18 a | −12.4 | |
| CF80B20 | 142 ± 12 d | −54.0 | 136 ± 4 ab | 28.3 | 278 ± 14 c | −33.1 | 143 ± 4 b | −31.6 | |
| O-tube | Control | 4.70 ± 1.35 c | — | 10.4 ± 2.5 b | — | 15.1 ± 3.9 c | — | 39.9 ± 5.1 c | — |
| CF100 | 175 ± 31 a | — | 58.3 ± 5.5 a | — | 233 ± 28 a | — | 172 ± 41 abc | — | |
| CF90B10 | 114 ± 15 b | −34.9 | 49.2 ± 20.5 a | −15.6 | 163 ± 31 b | −30.0 | 176 ± 21 a | 2.33 | |
| CF85B15 | 90.5 ± 16.4 b | −48.3 | 40.2 ± 10.0 a | −31.0 | 131 ± 21 b | −43.9 | 140 ± 15 a | −18.6 | |
| CF80B20 | 80.6 ± 12.1 b | −53.9 | 31.7 ± 6.4 ab | −45.6 | 112 ± 16 b | −51.8 | 129 ± 9 ab | −25.0 | |
The effect of the reduced chemical fertilization combined with the PSB application on the NO3−-N concentration in soil varied significantly with the type of tubes and with the reduction in chemical fertilization (Table 4). For the S-tube and O-tube, the PSB-based fertilization treatments did not lead to significant changes in the NO3−-N concentration; for the C-tube, the concentration of NO3−-N was significantly (p < 0.05) higher in the CF85B15 and CF80B20 than CF100 treatments (except no such difference in CF90B10 vs. CF100). The soil NO3−-N concentration was gradually decreased for both the S-tube and O-tube, but it was fluctuant for the C-tube with the reduction in chemical fertilization. For the S-tube, the percentage changes in NO3−-N in the CF90B10, CF85B15, and CF80B20 treatments were 14%, −6%, and −22%, respectively—of which, the last one corresponded to the chemical fertilizer reduction of 20%, whereas no such corresponding effect was observed for the C-tube and O-tube.
3.2. Olsen-P Concentration in Soil
Compared with the CF100 treatment, the soil Olsen-P concentration decreased significantly (p < 0.05) in the non-fertilization (Control) and CF80B20 treatments for both the S-tube and C-tube (Table 4). Furthermore, the soil Olsen-P concentration showed a decreasing trend with the reduction in chemical fertilization in most cases. For the S-tube, the percentage decrease in Olsen-P in the CF80B20 treatment (−19%) was close to the chemical fertilizer reduction of 20%, whereas, for the C-tube and O-tube, its percentage decreases in the CF85B15 and CF80B20 treatments (−12% and −19%, respectively) fluctuated around the chemical fertilizer reduction of 15%.
4. Soil Net N and P Mineralization
4.1. Net Ammonification, Net Nitrification, and Net N Mineralization in Soil
As shown in Figure 3a, net ammonification in soil generally decreased with the reduction in chemical fertilization. Accordingly, soil net ammonification ranked in the order of CF100 > CF90B10 and CF85B15 > CF80B20 > Control (p < 0.05). Differently, the CF80B20 and CF85B15 treatments had a significantly (p < 0.05) higher soil net nitrification than the other treatments. Hence, net nitrification in soil was increased dramatically when PSB was applied at 1840 or 2460 kg ha−1 (CF80B20 or CF85B15, respectively). Overall, net N mineralization in soil followed the order of (CF100 > CF90B10 and CF80B20) ≈ CF85B15 > Control (p < 0.05). Unlike soil net ammonification and nitrification, no significant difference in net N mineralization was found among all PSB-based fertilization treatments. The relative nitrification index (RNI), which acts as an indicator of the prevalence of nitrification over ammonification during mineralization processes, generally showed increasing trends with the reduction in chemical fertilization (Figure 3b). The CF80B20 and CF85B15 treatments had a significantly (p < 0.05) higher RNI than the CF90B10 and CF100 treatments.
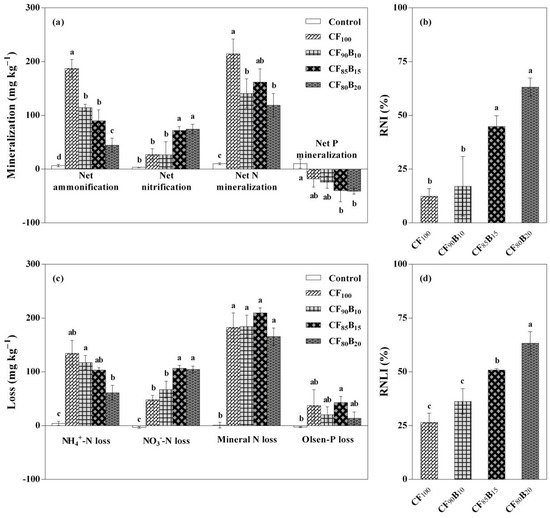
Figure 3. Coupled effects of reduced chemical fertilization and palm silk biochar (PSB) supplementation on net N and P mineralization (a), relative nitrification index (RNI) (b), mineral N and available P losses (c), and relative NO3−-N loss index (RNLI) (d) in 0–40 cm soil layer. Treatments: Control, no fertilization; CF100, 100% conventional fertilization; CF90B10, 90% conventional fertilization plus 10% PSB-based fertilization; CF85B15, 85% conventional fertilization plus 15% PSB-based fertilization; CF80B20, 80% conventional fertilization plus 20% PSB-based fertilization. Data are expressed as means ± SD (n = 3). For each parameter, bars labeled with different lowercase letters (e.g., a, b, c, etc.) indicate significant (p < 0.05) differences among the treatments based on the Tukey test or Games–Howell test.
4.2. Net P Mineralization in Soil
Unlike soil net N mineralization, net P mineralization was positive in the non-fertilization (Control) and negative in all fertilization treatments (Figure 3a). In the latter case, soil net P mineralization did not change significantly, regardless of chemical fertilizer reduction.
5. Soil Mineral N and Available P Losses
5.1. NH4+-N, NO3−-N, and Mineral N Losses from Soil
Compared with the CF100 treatment, the NH4+-N loss from soil generally showed decreasing trends with the reduction in chemical fertilizer application; reversely, the loss of soil NO3−-N increased significantly (p < 0.05) in almost all PSB-based fertilization treatments (except CF90B10; Figure 3c). However, the loss of soil mineral N did not change significantly, regardless of chemical fertilizer reduction. The relative NO3−-N loss index (RNLI), which is based on the NO3−-N loss as a percentage of the mineral N loss from soil, showed a general increasing trend with the reduction in chemical fertilization (Figure 3d). Statistically speaking, the CF80B20 treatment had the highest RNLI, followed by CF85B15, and the CF90B10 and CF100 treatments had the lowest (p < 0.05).
5.2. Olsen-P Loss from Soil
The Olsen-P loss from soil was negative in the non-fertilization (Control) and positive in all fertilization treatments, which was contrary to the results of net P mineralization in soil (Figure 3c). Compared with the CF100 treatment, all PSB-based fertilization treatments did not significantly affect the loss of soil Olsen-P.
6. Conclusions
Despite chemical fertilizer reduction, the partial substitution of chemical fertilizer with PSB at a relatively low application rate (e.g., 1840 kg ha−1) may not substantially reduce the soil available NO3−-N and Olsen-P for the plant to some degree, and could contribute to the sustainable availability of N and P in vegetable farmland soil via a variety of transformation processes, such as mineralization, immobilization, and loss. It provides an effective approach to understanding the availability and transformations of N and P in subtropical acid soils. There is a need for long-term studies evaluating the potential of the partial substitution of chemical fertilizer with PSB, especially in fields under continuous application.
References
- Xiong, Y.; Li, X.; He, P. Farmers’ adoption of pollution-free vegetable farming in China: Economic, informational, or moral motivation? Cogent Food Agric. 2016, 2, 1240026.
- Gai, X.; Liu, H.; Zhai, L.; Tan, G.; Liu, J.; Ren, T.; Wang, H. Vegetable yields and soil biochemical properties as influenced by fertilization in Southern China. Appl. Soil Ecol. 2016, 107, 170–181.
- Yi, B.; Zhang, Q.; Gu, C.; Li, J.; Abbas, T.; Di, H. Effects of different fertilization regimes on nitrogen and phosphorus losses by surface runoff and bacterial community in a vegetable soil. J. Soils Sediments 2018, 18, 3186–3196.
- Editorial Committee of Guangdong Statistical Yearbook on Agriculture. 2018 Guangdong Statistical Yearbook on Agriculture; China Statistics Press: Beijing, China, 2018; ISBN 978-7-5037-8759-1. (In Chinese)
- Editorial Committee of Guangdong Statistical Yearbook on Agriculture. 2008 Guangdong Statistical Yearbook on Agriculture; China Statistics Press: Beijing, China, 2008; ISBN 978-7-5037-5550-7. (In Chinese)
- Yu, X.; Li, H.; Doluschitz, R. Towards sustainable management of mineral fertilizers in China: An integrative analysis and review. Sustainability 2020, 12, 7028.
- Department of Environmental Protection of Guangdong Province; Statistics Bureau of Guangdong Province; Department of Agriculture of Guangdong Province; Administration of Ocean and Fisheries of Guangdong Province. First National Pollution Source Census Bulletin in Guangdong Province. Available online: http://gdee.gd.gov.cn/spcwj/content/post_2350774.html (accessed on 22 August 2011). (In Chinese)
- Kookana, R.S.; Sarmah, A.K.; van Zwieten, L.; Krull, E.; Singh, B. Biochar application to soil: Agronomic and environmental benefits and unintended consequences. Adv. Agron. 2011, 112, 103–143.
- Ge, T.; Luo, Y.; Singh, B.P. Resource stoichiometric and fertility in soil. Biol. Fertil. Soils 2020, 56, 1091–1092.
- Wang, H.; Ren, T.; Müller, K.; Van Zwieten, L.; Wang, H.; Feng, H.; Xu, C.; Yun, F.; Ji, X.; Yin, Q.; et al. Soil type regulates carbon and nitrogen stoichiometry and mineralization following biochar or nitrogen addition. Sci. Total Environ. 2021, 753, 141645.
- Chathurika, J.S.; Kumaragamage, D.; Zvomuya, F.; Akinremi, O.O.; Flaten, D.N.; Indraratne, S.P.; Dandeniya, W.S. Woodchip biochar with or without synthetic fertilizers affects soil properties and available phosphorus in two alkaline, Chernozemic soils. Can. J. Soil Sci. 2016, 96, 1–13.
- Nguyen, T.T.N.; Xu, C.-Y.; Tahmasbian, I.; Che, R.; Xu, Z.; Zhou, X.; Wallace, H.M.; Bai, S.H. Effects of biochar on soil available inorganic nitrogen: A review and meta-analysis. Geoderma 2017, 288, 79–96.
- DeLuca, T.H.; Gundale, M.J.; MacKenzie, M.D.; Jones, D.L. Biochar effects on soil nutrient transformations. In Biochar for Environmental Management: Science, Technology and Implementation, 2nd ed.; Lehmann, J., Joseph, S., Eds.; Routledge: London, UK; New York, NY, USA, 2015; pp. 421–454. ISBN 978-0-203-76226-4.
- Li, F.; Liang, X.; Niyungeko, C.; Sun, T.; Liu, F.; Arai, Y. Effects of biochar amendments on soil phosphorus transformation in agricultural soils. Adv. Agron. 2019, 158, 131–172.
- Prayogo, C.; Jones, J.E.; Baeyens, J.; Bending, G.D. Impact of biochar on mineralisation of C and N from soil and willow litter and its relationship with microbial community biomass and structure. Biol. Fertil. Soils 2014, 50, 695–702.
- Li, S.; Liang, C.; Shangguan, Z. Effects of apple branch biochar on soil C mineralization and nutrient cycling under two levels of N. Sci. Total Environ. 2017, 607, 109–119.
- Fiorentino, N.; Sánchez-Monedero, M.A.; Lehmann, J.; Enders, A.; Fagnano, M.; Cayuela, M.L. Interactive priming of soil N transformations from combining biochar and urea inputs: A 15N isotope tracer study. Soil Biol. Biochem. 2019, 131, 166–175.
- Ma, R.; Guan, S.; Dou, S.; Wu, D.; Xie, S.; Ndzelu, B.S. Different rates of biochar application change 15N retention in soil and 15N utilization by maize. Soil Use Manag. 2020, 36, 773–782.
- Liu, Y.; Zhu, Z.-Q.; He, X.-S.; Yang, C.; Du, Y.-Q.; Huang, Y.-D.; Su, P.; Wang, S.; Zheng, X.-X.; Xue, Y.-J. Mechanisms of rice straw biochar effects on phosphorus sorption characteristics of acid upland red soils. Chemosphere 2018, 207, 267–277.
- Zheng, H.; Wang, Z.; Deng, X.; Herbert, S.; Xing, B. Impacts of adding biochar on nitrogen retention and bioavailability in agricultural soil. Geoderma 2013, 206, 32–39.
- Ukwattage, N.L.; Li, Y.; Gan, Y.; Li, T.; Gamage, R.P. Effect of biochar and coal fly ash soil amendments on the leaching loss of phosphorus in subtropical sandy Ultisols. Water Air Soil Pollut. 2020, 231, 56.
- Zhao, X.; Yan, X.; Wang, S.; Xing, G.; Zhou, Y. Effects of the addition of rice-straw-based biochar on leaching and retention of fertilizer N in highly fertilized cropland soils. Soil Sci. Plant Nutr. 2013, 59, 771–782.
- Sun, H.; Feng, Y.; Xue, L.; Mandal, S.; Wang, H.; Shi, W.; Yang, L. Responses of ammonia volatilization from rice paddy soil to application of wood vinegar alone or combined with biochar. Chemosphere 2020, 242, 125247.
- Felber, R.; Leifeld, J.; Horák, J.; Neftel, A. Nitrous oxide emission reduction with greenwaste biochar: Comparison of laboratory and field experiments. Eur. J. Soil Sci. 2014, 65, 128–138.
- van Zwieten, L.; Kimber, S.; Morris, S.; Macdonald, L.M.; Rust, J.; Petty, S.; Joseph, S.; Rose, T. Biochar improves diary pasture yields by alleviating P and K constraints with no infuence on soil respiration or N2O emissions. Biochar 2019, 1, 115–126.
- Hangs, R.D.; Ahmed, H.P.; Schoenau, J.J. Influence of willow biochar amendment on soil nitrogen availability and greenhouse gas production in two fertilized temperate prairie soils. BioEnergy Res. 2016, 9, 157–171.
- Feng, K.; Tian, X.Y.; Wang, L.X.; Ou, Y.; Yan, B.X.; Fu, Y. Influence of combined synthetic fertilizer and biochar applications on nitrogen and phosphorus losses from surface water of paddy field. J. Agro-Environ. Sci. 2016, 35, 329–335. (In Chinese)
More
Information
Subjects:
Soil Science
Contributors
MDPI registered users' name will be linked to their SciProfiles pages. To register with us, please refer to https://encyclopedia.pub/register
:
View Times:
829
Revisions:
3 times
(View History)
Update Date:
15 Oct 2021
Table of Contents


Notice
You are not a member of the advisory board for this topic. If you want to update advisory board member profile, please contact office@encyclopedia.pub.
OK
Confirm
Only members of the Encyclopedia advisory board for this topic are allowed to note entries. Would you like to become an advisory board member of the Encyclopedia?
Yes
No
${ textCharacter }/${ maxCharacter }
Submit
Cancel
Back
Comments
${ item }
|
${ item.createdUser.fullName }
${ item.createdAt }
${ item.vote }
${ item.reply }
Delete
${ reply.createdUser.fullName }
${ reply.createdAt }
${ reply.vote }
Delete
There is no reply to this comment~
${ item.replyTextCharacter }/${ item.replyMaxCharacter }
Submit
Cancel
More
No more~
There is no comment~
${ textCharacter }/${ maxCharacter }
Submit
Cancel
${ selectedItem.replyTextCharacter }/${ selectedItem.replyMaxCharacter }
Submit
Cancel
Confirm
Are you sure to Delete?
Yes
No