 +1 credit
| Version | Summary | Created by | Modification | Content Size | Created at | Operation |
|---|---|---|---|---|---|---|
| 1 | Esmaeil Ahmadi | + 6936 word(s) | 6936 | 2020-05-29 08:33:43 | | | |
| 2 | Rita Xu | -1132 word(s) | 5804 | 2020-06-11 10:46:42 | | | | |
| 3 | Rita Xu | -19 word(s) | 5785 | 2020-10-27 09:43:20 | | |
Video Upload Options
This entry aims to reveal the economic, technical, and environmental impacts of different system configurations (centralized or decentralized, components, and technologies) on transition plans to achieve a higher share of renewable energy and desalination supplies for regions facing water scarcity. The main contribution of this research is the comparative evaluation of on-grid decentralized or distributed renewable-powered desalination systems for sustainable water and energy supply planning. Applying a novel nexus approach, an interactive multi-period planning model is developed to highlight synergies and to identify conflicts of planning both energy and water sectors at the same time as endogenous subsystems of one overall system. For studying these synergies in this study, the pace of technology deployment and the path of decline in overall costs are assumed to be a function of experience and knowledge as two-factor learning curves. Using data from 81 projects, the levelized cost and capacity factor of utility-scale photovoltaic and wind supplies in the Middle East were calculated. The results indicate that a scenario with a decentralized water sector and renewable-powered multiple-effect distillation technology has the best overall performance among the proposed scenarios.
The authors consider that the current study provides novel insights: (1) Designing and planning both the water and energy sectors at the same time, (2) detailed representation of short-term operational aspects in long-run planning of the water and energy sectors to capture the inherent variability of renewable energy resources, (3) modeling the water sector with centralized and decentralized on-grid renewable-powered desalination systems, (4) proposing a new methodology to study the synergies and conflicts of designing the water and energy sectors as an integrated system/separated system, and (5) estimating the two-factor learning curves for wind, photovoltaic, reverse osmosis desalination, and multi-effect distillation desalination industries in the Middle East.
1. Methodology
The nexus approach is deemed necessary to design future, inherently interlinked systems from the starting point of planning in a holistic manner. Concepts such as integrated management consider at least one of the systems as an existing system and are therefore different from the nexus approach. This approach identifies the future systems as inherently interconnected. The nexus approach aims to highlight potential synergies and identify critical conflicts to be dealt with. These outcomes are benchmarks for trade-offs among system integration, increasing complexity to the point where the decision making is delayed or incapacitated; and designing these systems as separated systems with less complexity, but potentially lower efficiency. Moreover, different system configurations could influence the extent of these synergies, conflicts of interests, and complexity.
Two system types (integrated and separated) and two system configurations for the water sector (see Figure 1) are assumed, making a total of four scenarios for investigation in this study, including:
-
Base Scenario: The water sector is considered as a centralized system with MED desalination technology.
-
C_RO Scenario: The water sector is studied as a centralized system with RO desalination technology.
-
D_RO Scenario: The water sector is assumed as a decentralized system with RO desalination technology.
-
D_MED Scenario: The water sector is considered as a decentralized system with MED desalination technology.
In the base scenario, the water sector is studied as an exogenous factor for the energy system, in which there is no control over it. In C_RO, D_RO, and D_MED scenarios, both energy and water systems are studied as an integrated system, which are endogenous parts of one integrated system. The energy sector is considered as centralized in all of the above scenarios because of the data limitation for descaling learning curves for variable renewable resources to give sensible differentiation between a set of small-scaled systems and an equivalent large-scaled system. As shown in Figure 1, there are four modules within the model proposed in this study: (1) Proposing a supply-demand module, (2) developing an energy storage module, (3) estimating the learning curves for the region of the case study, and (4) conducting economic analysis and calculating GHG emissions reduction.
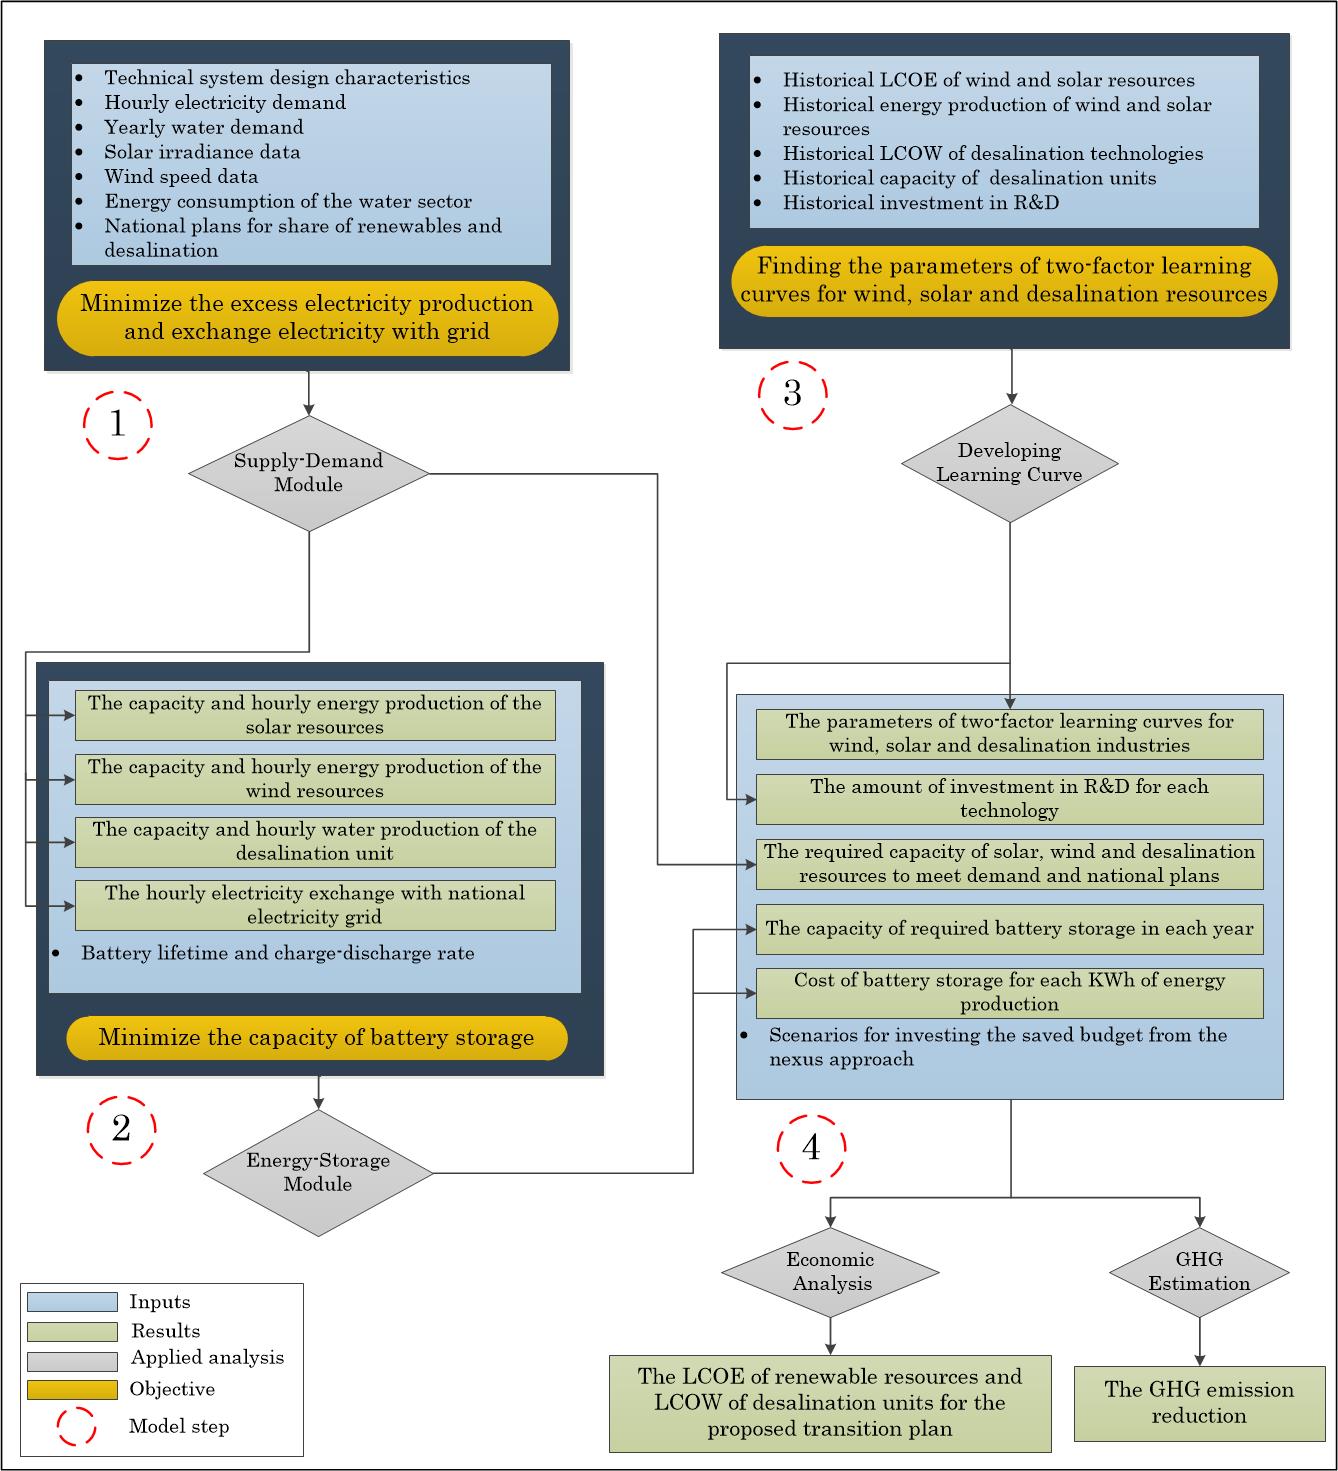
Figure 1. The proposed model for an energy system with variable renewable resources (VRE) and water supply with desalination.
2. Results and Discussion
In this section, first the results of the supply-demand module and the energy storage module for the proposed scenarios the case study (Jask, Iran) are explained. These outcomes are the baseline for technical, economic, and environmental analysis for the whole region in the southern coast of Iran. All water, energy, and technology-related costs in this study were converted to 2018 United States dollars ($).
2.1. Supply-Demand Module
In the 2015 Paris Climate Agreement, COP21, Iran pledged to meet a target of 7.5 GW of renewable electricity generation capacity by 2030 [1]. According to the Iranian Sixth National Development Plan, the Ministry of Energy and the Renewable Energy Organization, which are Iran’s leading electric utility and subsidiaries, are assigned a target of supplying 5% of total electricity demand from renewables by 2021 [2]. Moreover, according to the Iranian National Strategic Energy Plan, Iran aims to reach competitive costs for renewable power production by 2040 and increase the current renewable deployment rate, which is around 1% yearly. The Iranian Ministry of Energy has proposed comprehensive plans to hit the aforementioned targets, such as a feed-in tariff mechanism and long-term contracts at guaranteed prices, extended from five-year contracts to 20-year contracts from 2015 [3]. In this study, the growth rate of VREs’ share of total electricity supplies is assumed to be 2% per year by 2040.
For the water sector, according to the Iranian Sixth National Development Plan, the Ministry of Energy is assigned to propose a plan for transferring required knowledge and providing sufficient financial support toward supplying 70% of the urban water demand on the shoreline of the Persian Gulf and the Gulf of Oman by 2021 from desalination [2]. This study assumes a linear increase for the expansion of desalination across the period to meet the 70% target.
Ten days in each season, for a total of 40 days as representative of each year, are chosen (due to a software limitation) as the short-term operation horizon for each year between 2020 to 2040 as the long-run planning horizon to solve the linear supply-demand module. The module is coded into GAMS 26.3.5 [4] and solved by CPLEX solver for the sample county (Jask, Iran).
The total renewable electricity production for each scenario is the same (68,371 MWh from 2020 to 2040, 40 days each year). The optimal yearly capacity of wind supply, photovoltaic (PV) supply, and desalination plants are obtained for the proposed scenarios. The hourly water production of each desalination plant, the amount of stored water in the city’s reservoir (for the base and C_RO scenarios), the amount of water stored in the desalination unit’s reservoir, the amount of water pumped from the desalination reservoir (for the base and C_RO scenario), and the amount of hourly water extraction from the conventional water sources are the other variables of this model to meet the mentioned target share of VRE and desalination production. The share of PV and wind in the total VRE electricity production is depicted in Figure 2 and Figure 3. For D_RO and D_MED scenarios, the share of solar electricity rises from 32% and 0% of total renewable electricity generation in 2020 to 86% and 85% in 2040, respectively, while for the base and C_RO scenarios, the share of solar electricity production from the total VRE electricity production declines from 100% in 2020 to 85% and 88% in 2040, respectively. As can be seen in Figure 2 and Figure 3, solar electricity performs better in following the electrical load pattern in this case study and with a share of more than 85% of total VRE, electricity production is the dominant renewable resource for all the scenarios.
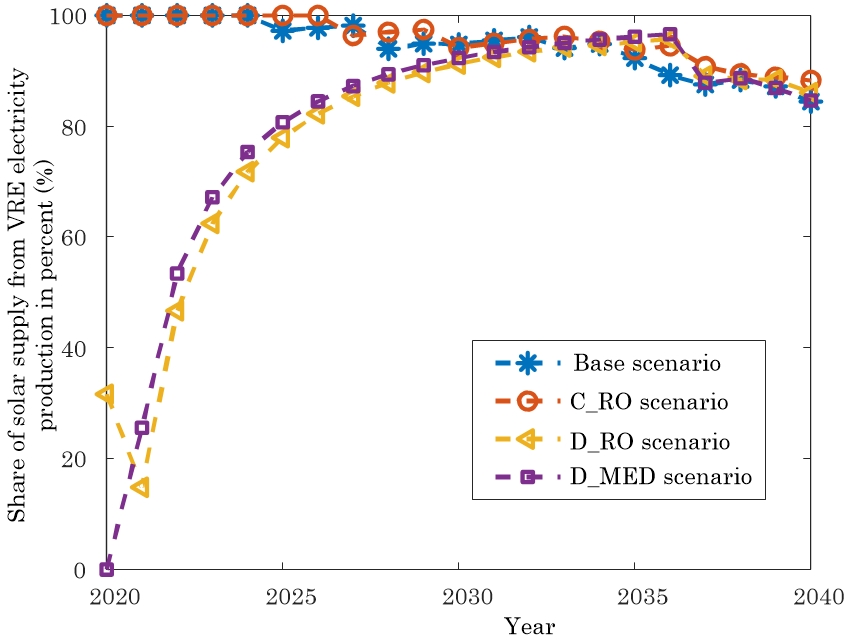 Figure 2. Share of photovoltaic (PV) in the total VRE electricity production.
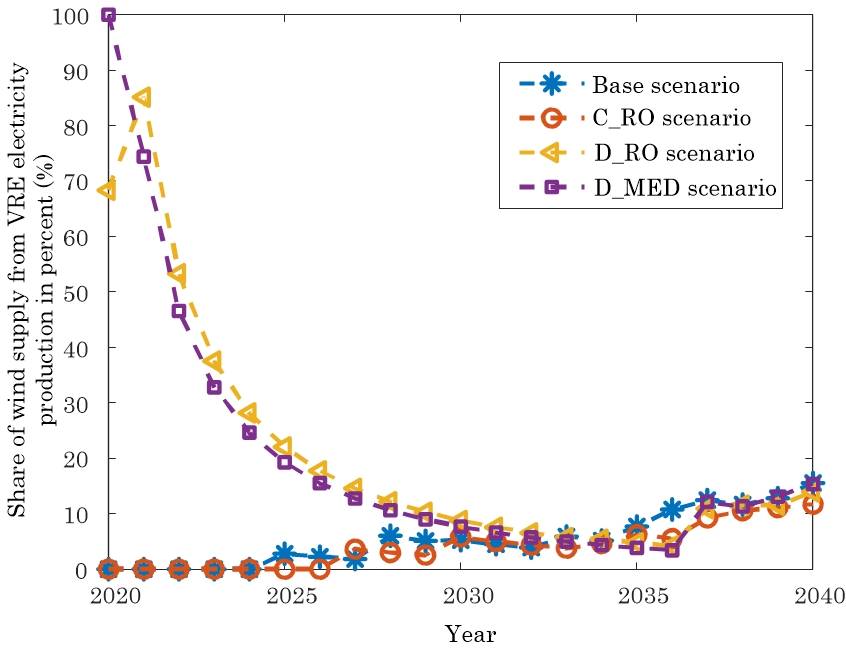 Figure 3. Share of wind in the total VRE electricity production.
Mismatches between VRE electricity generation profiles and electric demand due to the variability of VRE power generation can cause instability in electricity grids. The portion of VRE electricity generation exceeding the electric load is defined as the excess renewable electricity generation in this study, and self-consumption refers to a portion that is consumed directly by the county of the study and is not fed into the national electricity grid. Figure 4 shows the amount of excess electricity generation and share of self-consumption from the entire VRE electricity generation for all the scenarios. The amount of excess power generation from VREs in 2040 reaches about 17.4% of total renewable electricity generation for the base scenario, while this excess energy generation is around 14.3% for the C_RO and D_RO scenarios and 16.1% for the D_MED scenario.
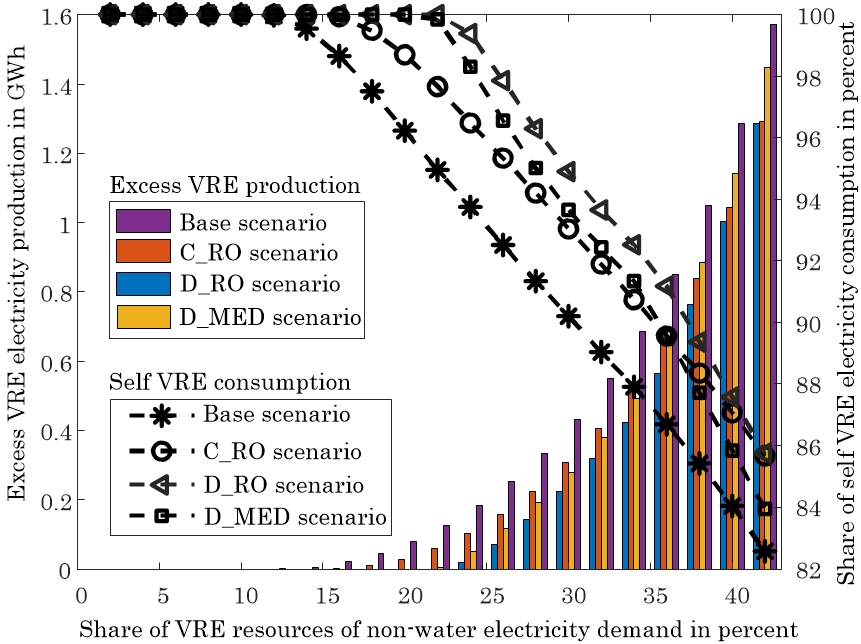
Figure 4. Share of self-consumption from VRE electricity production and amount of excess renewable electricity generation.
Figure 5 depicts the electricity demand of the water sector and its share from the total electricity demand. Although the water sector’s electricity demand is rising for all the scenarios from 2020 to 2040 (due to a higher portion of desalination and demand growth in proportion to Iran’s population growth [5]), its share from the total electricity demand shrinks from 6.6% in 2020 to 3.9%, 6.3%, and 2.9% for the base, D_RO, and D_MED scenarios in 2040, respectively. For the C_RO scenario, this share rises slightly from 6.6% in 2020 to 7.1% in 2040. This comes from differences between the yearly growth rate of water demand influenced by the population growth in the current module and the growth rate of electricity demand, which is a constant (a 6.5% yearly growth based on national data predictions [6]). The RO desalination technology requires more electricity to desalinate water (4 KWh/m3) compared to the electricity consumption of MED technology, 1.5 KWh/m3 in this study. As a result, scenarios with RO technology, the C_RO and D_RO scenarios, have a higher electricity demand compared to the scenarios with MED technology, the base and D_MED scenarios. Furthermore, as can be seen in Figure 5, the scenarios with the decentralized water sector, the D_RO and D_MED scenarios, benefit from energy-saving due to less electricity consumption for water distribution.
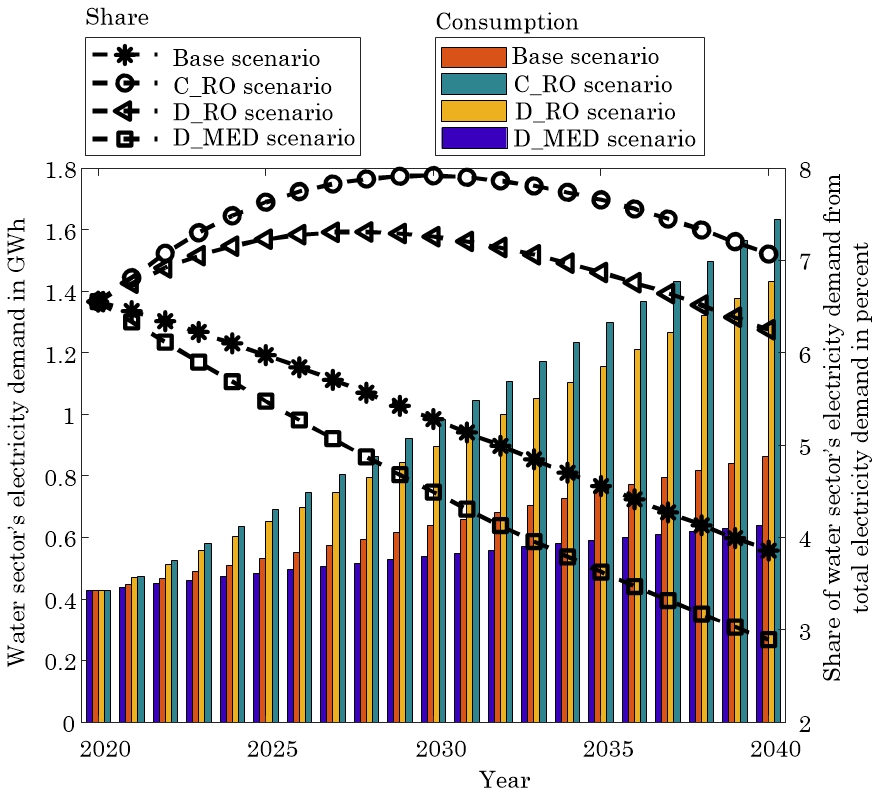
Figure 5. Water sector’s electricity consumption and share of total electricity demand.
2.2. Energy Storage
In the next step, based on the results of the supply-demand module, an optimization problem was solved using GAMS software [4] to find the required batteries equivalent to the operational capacity of the flexible water sector. Annual equivalents of the lump sum unit investment cost of the required batteries are determined to calculate the cost of batteries for a unit of VRE electricity production (MWh/$). This annual equivalent of the lump sum unit investment cost of each technology is defined as a stream of equal annual debts over the lifetime of the technology, in such a way that the present value of the stream is equivalent to the lump sum unit investment cost for each technology. The results of this optimization module are summarized in Figure 6.
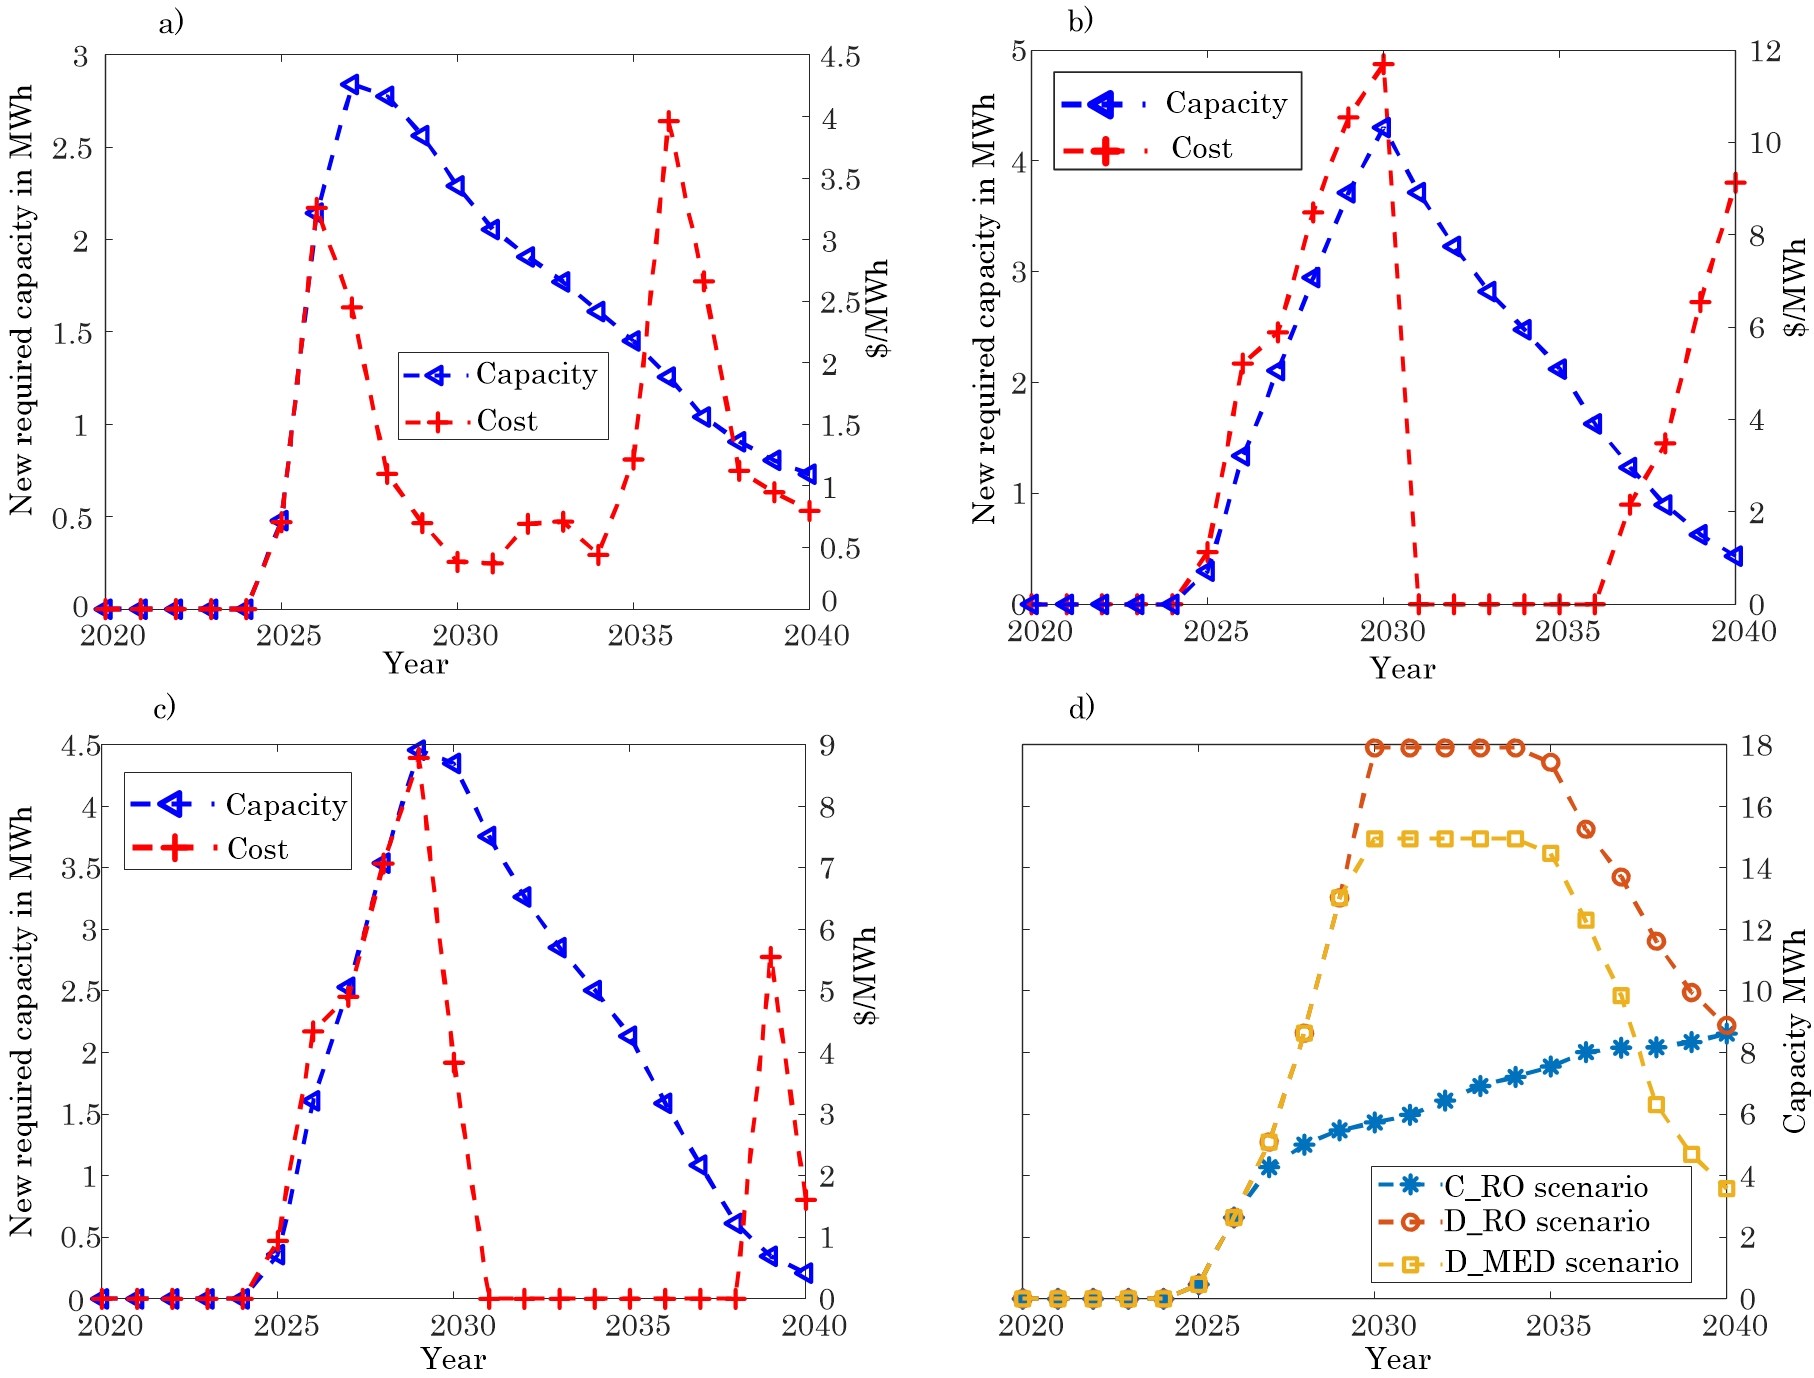 Figure 6. Capacity and cost of the battery unit to reach the same VRE self-consumption for: (a) C_RO scenario; (b) D_RO scenario; (c) D_MED scenario. (d) The required total capacity of batteries in each year.
The flexibility of the water sector as an electric load in D_RO and D_MED reaches its highest capacity between 2030 to 2034, at about 18 MWh and 15 MWh, respectively. This flexibility is lower in the C_RO scenario compared to the scenarios with the decentralized water sector in most of the studied time horizon, which was not expected due to stricter constraints on the decentralized water sector (see Appendix A). This flexibility is sensitive to the share of each VRE supply in the total renewable power generation. In the scenarios with the decentralized water sector, by reaching above 90% share of solar electricity in total VRE power generation in 2030 (see Figure 2), the equivalent capacity of batteries reaches the highest value and starts declining after 2035, when the portion of wind electricity is increasing (see Figure 3). This means the decentralized water sector has local optimum flexibility around 90% share of solar electricity in the total VRE power generation. For the C_RO scenario with the centralized water sector, the equivalent battery capacity is growing with the rising share of wind electricity in total VRE power generation (see Figure 6d). This shows that the centralized water sector operates more flexibly with a higher percentage of wind electricity compared to the decentralized water sector. It is noteworthy to mention that the objective function of the supply-demand module, the results of which are the baseline for the current storage module, is to find the optimal capacity of VRE supplies for reaching minimum overall electricity exchange with the national grid, which is not identical with finding the maximum flexibility of the water sector as an electric load.
The cost of batteries for a unit of VRE electricity generation falls in several periods, although the equivalent capacity is constant or decreasing, for instance, in Figure 6b for the D_RO scenario, from 2030 to 2035. This is due to an assumption in this study that the cost of lithium-ion batteries will decrease by 40% by 2040 [7][8] causing a lowering of costs while the equivalent battery capacity is constant or decreasing.
2.3. Learning Curve
The parameters of the two-factor learning curve for utility-scale photovoltaic, wind, MED, and RO technologies have been estimated in the current study. The results of these estimations are illustrated in Figure 7, Figure 8 and Figure 9. The levelized cost and capacity factor of wind and photovoltaic supplies were obtained using data from 49 photovoltaic projects and 32 wind projects in the Middle East.
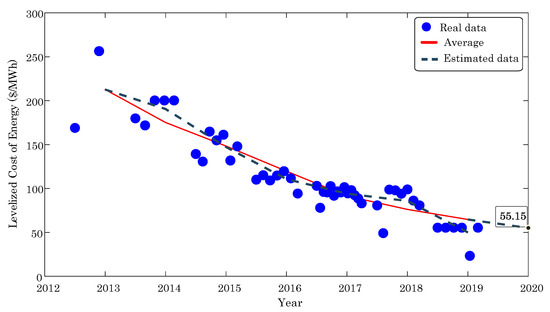
Figure 7. Learning-curve model fitting of photovoltaic (PV) investment cost.
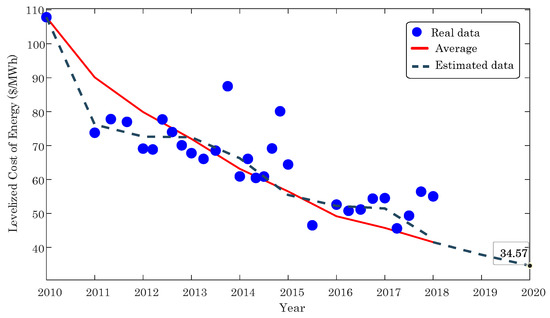
Figure 8. Learning-curve model fitting of wind-power investment-cost reduction.
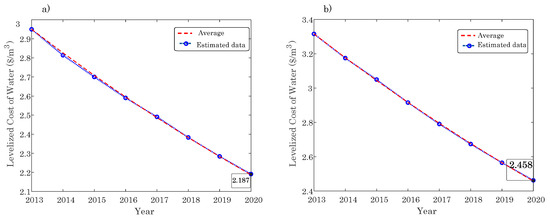
Figure 9. Learning-curve model fitting of the desalination industry investment cost: (a) Reverse osmosis (RO) technology; (b) multi-effect desalination (MED) technology.
The estimated LDR and LSR for the utility-scale photovoltaic industry between 2013 to 2019 in the Middle East were 15.3% and 33.9%, respectively, with a goodness of fit (R2) of 96.9% based on the average LCOE and 86.9% based on overall data. Figure 7 shows that the obtained LCOE of the utility-scale photovoltaic electricity is equal to 55.2 $/MWh in 2020. Previous studies [9] obtained an LDR of 18% for 26 regions in North Africa, South America, and Australia using the one-factor learning curve to estimate the LCOE of PV. Authors in other studies [10] adopting a similar two-factor learning curve found an LDR of 17% and an LSR of 10% for the photovoltaic technology. Other studies [11] (using data from 2009 to 2016 for the US) and [12] (using data from 1975 to 2000 using worldwide data) estimated these rates as 6.7% and 18.4% for LDR and 75.2% and 14.3% for LSR, respectively, by including a time lag between investment in R&D and subsequent declines in cost for the photovoltaic technology.
The estimated LDR and LSR for the wind industry between 2010 to 2018 in the Middle East were 13.5% and 36.6%, respectively, with a goodness of fit (R2) of 90.0% based on the average LCOE and 67.4% based on overall data. For the wind industry, the overall LDR span is a broad range, from −11% to 35% among studies [13]. As can be seen in Figure 8, the obtained LCOE of wind energy in this study reaches 34.6 $/MWh in 2020. Other studies, [11][12] adopting a similar two-factor learning curve to obtain future wind energy costs, estimated an LDR of 14.2% and an LSR of 18.0% using data from 1991–2000 and an LDR of 17.5% and LSR of 37.1% using data from 2009 to 2016.
The learning rates of the two-factor learning curve for the utility-scale photovoltaic and wind technologies in the Middle East, which are obtained in the current study, were higher than the previous studies. This indicates that, in this region with large-scale investments and commercialization, the learning ability of the utility-scale photovoltaic and wind technologies have substantially improved. Moreover, the estimated LSR rates were higher than the LDR rates for the technologies mentioned above, showing that these technologies are undergoing an explosion of knowledge-driven cost reductions. In consequence, investment in R&D can play a chief role in the development of these technologies in the Middle East.
The estimated levelized cost of water for the RO and MED desalination technologies is also obtained by applying the two-factor learning curve, which is depicted in Figure 9. The estimations indicate that the LCOW for RO technology reaches 2.19 $/m3 and 2.46 $/m3 for the MED technology. The obtained LDR and LSR rates for the RO desalination technology are equal to 9.1% and 49.6% with a goodness of fit (R2) of 99.2% using data from 2012 to 2020 [14]. For the MED desalination technology using data between 2012 to 2020 [14][14], the obtained LDR is 12.9%, and the LSR is 57.2% with a goodness of fit (R2) of 98.9%. Previous studies, [15] adopting a one-factor learning curve to estimate the learning rate for the CAPEX of RO technology, found an LDR of 15% for RO desalination technology using worldwide empirical data. Other studies [16], estimated a range of 6% to 20% for LDR of the RO desalination technology with a goodness of fit (R2) of 98.0% and a range of 12% to 23% for LDR of the MED technology with a goodness of fit (R2) of 99.1%.
2.4. Economic Analysis and Emissions
Based on the results of the supply-demand module, storage module, and the estimated rates of the two-factor learning curve and costs of the utility-scale photovoltaic, wind, RO, and MED technologies from the previous sub-section, an economic analysis has been conducted for the region of the case study. Furthermore, the reduction of GHG emissions for the proposed scenarios has been calculated. Lastly, a sensitivity analysis has been conducted to investigate the role of R&D in the development of the mentioned technologies. The electricity and water demand in 2020–2040 have been obtained based on national predictions [6] and the World Bank’s population estimation [5] for the region of the case study.
The cost of batteries for a unit of VRE electricity generation (see Figure 6), which was obtained for the C_RO, D_RO, and D_MED scenarios due to a lower required capacity of batteries compared to the base scenario, is considered as a saved budget for the energy sector in these scenarios. Countries have pledged to increase public and private R&D spending substantially by 2030 as part of the Sustainable Development Goals. The latest available data from the UNESCO Institute for Statistics show that the current maximum R&D spending as a percentage of GDP is around 5% [17]. Therefore, 5% of this saved budget is assumed to be invested in R&D of the wind and photovoltaic technologies in proportion to the share of each supply in VRE electricity generation. It is assumed that the rest of this saved budget (95%) finances further generation of renewable electricity from utility-scale photovoltaic and wind. This budget covers all the fixed and variable costs of the VRE electricity generation during the lifetime of these technologies, which is 20 years.
Studies [18][19][20] showed that about 40% and 7% of LCOW of the RO desalination technology and the MED desalination technology goes to electricity consumption, respectively. As a result, a lower cost of electricity in the C_RO, D_RO, and D_MED scenarios compared to the levelized cost of electricity in the base scenario causes a cost-saving in the water sector. Moreover, the scenarios with the decentralized water sector benefit from energy-saving due to less electricity consumption for water distribution, causing additional cost-saving for these scenarios. These cost-savings are considered as a saved budget for the water sector in the C_RO, D_RO, and D_MED scenarios. Similar to the energy sector, it is assumed that 5% of this saved budget is invested in R&D of desalination technologies and 95% of this budget finances more water desalination to increase the share of desalination from water supplies. This budget covers all the fixed and variable costs of the desalination water production during the lifetime of the RO and MED technologies, which is considered 20 years in this study. Table 1 summarizes the LCOE of renewable supplies and LCOW of the MED and RO desalination technologies for the proposed scenarios from 2020 to 2040 in the region of the case study.
Table 1. Estimated future levelized cost of energy (LCOE) of renewable and levelized cost of desalinated water (LCOW) of the desalination technologies.
| Year/Scenario | LCOE of Wind Electricity ($/MWh) | LCOE of Solar Photovoltaic ($/MWh) | Levelized cost of Desalinated Water ($/m3) | |||||||||
|---|---|---|---|---|---|---|---|---|---|---|---|---|
| Base | C_RO | D_RO | D_MED | Base | C_RO | D_RO | D_MED | Base | C_RO | D_RO | D_MED | |
| 2020 | 34.7 | 34.7 | 34.7 | 34.7 | 55.2 | 55.2 | 55.2 | 55.2 | 2.46 | 2.19 | 2.19 | 2.46 |
| 2021 | 34.6 | 34.6 | 25.7 | 26.3 | 37.8 | 37.8 | 49.5 | 46.8 | 2.19 | 2.05 | 2.05 | 2.19 |
| 2022 | 34.5 | 34.5 | 25.7 | 26.2 | 34.4 | 34.4 | 39.8 | 38.9 | 1.99 | 1.94 | 1.94 | 1.99 |
| 2023 | 34.5 | 34.5 | 25.7 | 26.2 | 31.9 | 31.9 | 35.2 | 34.7 | 1.83 | 1.84 | 1.84 | 1.83 |
| 2024 | 34.4 | 34.4 | 25.6 | 26.2 | 30.0 | 30.0 | 32.2 | 31.9 | 1.70 | 1.75 | 1.75 | 1.70 |
| 2025 | 32.1 | 34.4 | 25.6 | 26.1 | 28.5 | 28.3 | 29.9 | 29.7 | 1.59 | 1.67 | 1.67 | 1.58 |
| 2026 | 32.0 | 34.3 | 25.5 | 26.0 | 27.1 | 26.8 | 28.0 | 27.8 | 1.49 | 1.60 | 1.60 | 1.48 |
| 2027 | 32.0 | 30.4 | 25.4 | 25.9 | 25.8 | 25.6 | 26.3 | 26.2 | 1.40 | 1.54 | 1.53 | 1.40 |
| 2028 | 28.2 | 30.3 | 25.2 | 25.8 | 25.0 | 24.2 | 24.7 | 24.6 | 1.33 | 1.48 | 1.47 | 1.32 |
| 2029 | 28.1 | 30.2 | 25.1 | 25.6 | 24.0 | 23.0 | 23.1 | 23.0 | 1.26 | 1.42 | 1.42 | 1.25 |
| 2030 | 27.4 | 26.9 | 24.9 | 25.5 | 23.1 | 22.1 | 21.6 | 21.6 | 1.20 | 1.37 | 1.36 | 1.18 |
| 2031 | 27.4 | 26.8 | 24.7 | 25.3 | 22.2 | 21.1 | 20.2 | 20.3 | 1.14 | 1.32 | 1.31 | 1.12 |
| 2032 | 27.3 | 26.8 | 24.6 | 25.2 | 21.4 | 20.2 | 19.0 | 19.2 | 1.09 | 1.28 | 1.27 | 1.06 |
| 2033 | 25.1 | 26.7 | 24.4 | 25.1 | 20.8 | 19.3 | 17.9 | 18.1 | 1.04 | 1.24 | 1.22 | 1.01 |
| 2034 | 25.1 | 25.3 | 24.0 | 25.0 | 20.1 | 18.5 | 17.0 | 17.2 | 1.00 | 1.20 | 1.18 | 0.97 |
| 2035 | 22.9 | 23.6 | 23.9 | 24.8 | 19.6 | 17.8 | 16.1 | 16.4 | 0.96 | 1.16 | 1.14 | 0.92 |
| 2036 | 21.1 | 23.5 | 23.7 | 24.7 | 19.2 | 17.1 | 15.3 | 15.6 | 0.92 | 1.13 | 1.11 | 0.88 |
| 2037 | 20.0 | 20.9 | 19.8 | 19.5 | 18.7 | 16.6 | 14.9 | 15.4 | 0.88 | 1.10 | 1.07 | 0.84 |
| 2038 | 19.8 | 19.9 | 19.0 | 19.3 | 18.2 | 16.1 | 14.4 | 14.8 | 0.85 | 1.07 | 1.04 | 0.80 |
| 2039 | 19.0 | 19.2 | 18.6 | 18.3 | 17.7 | 15.5 | 13.9 | 14.4 | 0.82 | 1.04 | 1.01 | 0.77 |
| 2040 | 17.8 | 18.6 | 17.5 | 17.4 | 17.3 | 15.0 | 13.5 | 14.1 | 0.79 | 1.01 | 0.98 | 0.74 |
Table 1 shows that the levelized cost of wind electricity generation will reach 17.8 $/MWh, 18.6 $/MWh, 17.5 $/MWh, and 17.4 $/MWh for the base, C_RO, D_RO, and D_MED scenarios, respectively. In the base, C_RO, D_RO, and D_MED scenarios, 94%, 92%, 89%, and 90% of this cost reduction in 2040, compared with the cost of wind electricity in 2020, is driven by the experience effect of cumulative production, and 6%, 8%, 11%, and 10% is driven by the knowledge stock of the cumulative increase in R&D spending, respectively. In the C_RO scenario, the share of wind electricity generation from the total VRE electricity production in 2040 is the lowest amongst the proposed scenarios, with 12% (see Figure 2) causing the highest LCOW for the wind supply in the C_RO scenario due to the effect of production experience.
For utility-scale photovoltaics, the LCOE in 2040 is equal to 17.3 $/MWh, 15.0 $/MWh, 13.5 $/MWh, and 14.1 $/MWh, for the base, C_RO, D_RO, and D_MED scenarios, respectively. About 96%, 83%, 76%, and 78% of this cost reduction in 2040 as compared with 2020 is caused by the experience of cumulative production, and 4%, 17%, 24%, and 22% comes from the knowledge stock of the cumulative increase in R&D spending for the base, C_RO, D_RO, and D_MED scenarios, respectively.
The cost reduction of wind electricity is lower than the cost reduction of photovoltaic electricity. For instance, in the D_MED scenario, the LCOE of photovoltaic electricity reduces from 55.2 $/MWh in 2020 to 14.1 $/MWh, while the wind electricity experiences a cost reduction from 34.7 $/MWh in 2020 to 17.4 $/MWh in 2040. Several factors cause this difference, including, first, the share of wind power from total renewable electricity generation varies from 11% to 15% in 2040, affecting the cost reduction by the experience of cumulative production. Moreover, in this proposed module, the VRE technologies are gaining budget from the saved budget for spending on R&D and adding new capacity in proportion to their share of total VRE generation (see Figure 2 and Figure 3) based on the results of the previous technical modules in this study. In other words, the photovoltaic technology gets more share from the saved budget because it is more attractive based on the technical modules.
Even though the LSR is higher than the LDR for both photovoltaic and wind technologies, the main percentage of the cost reduction is driven from the experience of cumulative production showing these technologies are facing an inadequate R&D budget for development. The circumstances are improved for the C_RO, D_RO, and D_MED compared to the base scenario. For example, the share of cost reduction due to knowledge stock increased from 4% in the base scenario to 22% for the D_RO scenario for the photovoltaic technology because a fraction of the saved budget is dedicated to spending on R&D.
Table 1 shows that the levelized cost of desalinated water for the base, C_RO, D_RO, and D_MED scenarios will reach 0.79 $/m3, 1.01 $/m3, 0.98 $/m3, and 0.74 $/m3, respectively. For MED desalination technology in the base and D_MED scenarios, about 55% and 56% of the cost reduction is caused by the knowledge stock in 2040 as compared with 2020 and around 45% and 44% is driven by the experience effect of cumulative production, respectively. Around 36% and 39% of the RO desalinated water reduction cost is driven by the experience of the cumulative production for the C_RO and D_RO scenarios, respectively. These results indicate that RO and MED desalination technologies received adequate R&D budget compared to photovoltaic and wind technologies.
Figure 10 depicts the synergy results of the integration of the water and energy sectors for the energy sector. The C_RO, D_RO, and D_MED scenarios, with the integrated water and energy sectors, generate 32%, 64%, and 53% more renewable electricity, respectively, during the lifetime of the newly installed capacities in 2020–2040 compared to the renewable electricity generation of the base scenario with the separated water and energy sectors. These scenarios have 7%, 14%, and 12% less required budget, respectively, compared to the required budget for the base scenario. As can be seen in Figure 10, for the water sector, only the D_MED scenario shows a synergistic effect from the integration of the water and energy sector. This scenario produces 4% more desalinated water during the lifetime of the newly installed facilities with 3% less required budget compared to the desalinated water production and required budget in the base scenario while the C_RO and D_RO scenarios require 18% and 16% more budget compared to the budget in the base scenario to meet the same targets. Furthermore, the D_MED scenario reaches a levelized cost of desalinated water of 0.74 $/m3, which is 5% lower than the cost in the base scenario in 2040.
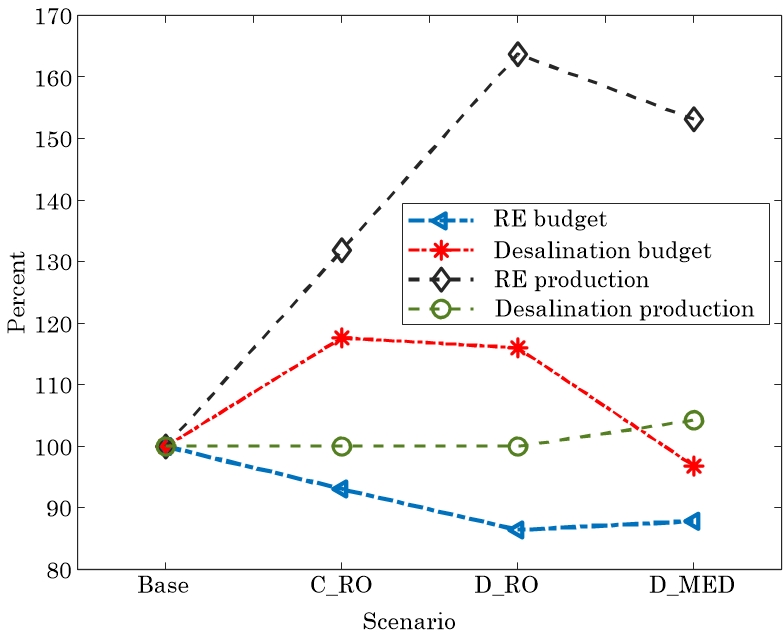
Figure 10. Share of lifetime VRE electricity production from the saved budgets out of the total VRE electricity production of the base scenario and required budget. Share of lifetime RO water production from the saved budgets out of the total RO production of the base scenario and required budget.
Figure 11 indicates that the D_MED scenario with 444 Mt of CO2, 7913 tons of CH4, and 794 tons of NO2 reduction by 2040 has a better performance in GHG emissions reduction compared to the other scenarios. These reductions were calculated based on the Iranian electricity mix and with an assumption of providing the thermal energy for the desalination process from Iranian natural gas in the base scenario and from solar thermal resources for the D_MED scenario [6][21]. Although the C_RO scenario generates more renewable electricity compared to the D_MED scenario (see Figure 10), the D_MED scenario, as explained in the introduction, has the potential to provide thermal energy for the desalination process from the solar thermal resources due to distributed water sector and its size compatibility.
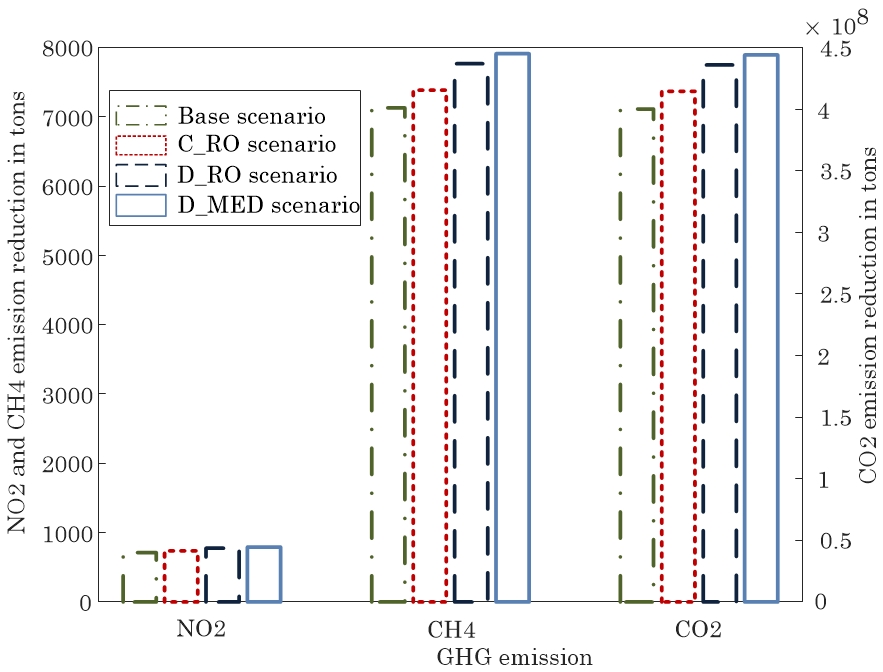
Figure 11. Reduction in greenhouse gas (GHG) emissions for each scenario.
As can be seen in Table 1, the obtained LCOE in the scenarios with the integrated water and energy sectors, the C_RO, D_RO, and D_MED is lower the LCOE in the base scenario with separated water and energy sectors. Even though the VRE costs are likely to decrease dramatically, these costs will remain more expensive than natural gas power plants in 2040 for Iran producing electricity with an LCOE of 10 $/MWh [1][22]. The levelized cost of renewable electricity is equal to 17.6 $/MWh, 16.8 $/MWh, 15.5 $/MWh, and 15.7 $/MWh for the base, C_RO, D_RO, and D_MED scenarios, respectively. Even though the D_RO reaches a cheaper LCOE and higher penetration of VRE (see Figure 10) compared to the D_MED scenario, in this scenario, the LCOW will be 13% more expensive than the base scenario, and the required budget to meet the same targets in the water sector is 16% higher than the base scenario.
The United Nations addressed water resource management and deployment of renewable energy among focal targets to achieve sustainable development goals (SDG) in Iran [23]. Currently, planning for the water and energy sector is being conducted separately in Iran [23]. This study shows the integrated planning of these sectors brings potential technical, economic, and environmental synergistic benefits while avoiding conflicts. Moreover, even when considering all cost reductions and developments, renewable power and desalination (as one of the proposed strategies to achieve SDGs in Iran [24]) remain expensive energy and water supplies compared to other conventional resources. It needs heavy national investment and subsidies from governments for the next few decades. The proposed renewable-powered desalination system in this study gives the rural areas of Iran an opportunity to benefit from these investments and subsidies. Such rural areas are given priority for development in the suggested strategies for achieving SDGs in Iran [24].
2.4.1. Sensitivity Analysis
For investigating the role of R&D budget in the deployment wind, solar MED, and RO technologies, a sensitivity analysis has been conducted in this study. To this end, the share of R&D investment from the saved budgets (explained in the previous subsection) is assumed to differ by up to 10%. The resulting LCOE of VRE electricity and LCOW of desalination technologies in 2040 for the proposed scenarios are summarized in Table 2. The levelized cost of photovoltaic electricity (around 20% for the C_RO scenario, 32% for the D_RO scenario, and 28% cost reduction for the D_MED scenario) was most affected by increasing the share of R&D budget compared to the LCOE of wind power (around 2% for the C_RO scenario, 6% for the D_RO scenario, and 4% cost reduction for the D_MED scenario) and LCOW of MED and RO desalination technologies (around 1% for the C_RO scenario, 8% for the D_RO scenario, and 14% cost reduction for the D_MED scenario) due to the higher effect of cumulative production and receiving a higher share of the R&D budget. As mentioned, in the C_RO scenario, the share of wind electricity generation from the total VRE electricity production in 2040 is the lowest amongst the proposed scenarios causing higher LCOW for the wind supply as can be seen in Table 2.
Table 2. Sensitivity analysis on the share of research and development (R&D) from the saved budgets for LCOE of solar and electricity, and LCOW of desalination in 2040.
| Share of R&D (%)/Scenario | LCOE of Wind Electricity ($/MWh) | LCOE of Solar Electricity ($/MWh) | Levelized Cost of Desalinated Water ($/m3) | |||||||||
|---|---|---|---|---|---|---|---|---|---|---|---|---|
| Base | C_RO | D_RO | D_MED | Base | C_RO | D_RO | D_MED | Base | C_RO | D_RO | D_MED | |
| 0 | 17.8 | 18.8 | 18.0 | 17.8 | 17.3 | 17.0 | 16.9 | 17.0 | 0.79 | 1.01 | 1.01 | 0.79 |
| 2 | 17.8 | 18.7 | 17.8 | 17.6 | 17.3 | 16.1 | 15.3 | 15.7 | 0.79 | 1.01 | 1.00 | 0.77 |
| 4 | 17.8 | 18.6 | 17.6 | 17.4 | 17.3 | 15.4 | 14.1 | 14.6 | 0.79 | 1.01 | 0.99 | 0.75 |
| 6 | 17.8 | 18.5 | 17.4 | 17.3 | 17.3 | 14.7 | 13.0 | 13.7 | 0.79 | 1.01 | 0.97 | 0.72 |
| 8 | 17.8 | 18.4 | 17.2 | 17.1 | 17.3 | 14.1 | 12.2 | 12.9 | 0.79 | 1.00 | 0.95 | 0.70 |
| 10 | 17.8 | 18.4 | 17.0 | 17.0 | 17.3 | 13.6 | 11.5 | 12.2 | 0.79 | 1.00 | 0.93 | 0.68 |
As mentioned, it is assumed in this study that a share of the saved budget goes into the renewable and desalinated water production, adding new capacities to the supply sides of the water and energy sector. This budget covers all the fixed and variable costs of the VRE electricity generation and desalinated water production within the lifetime of these technologies, which is 20 years. The renewable generation and desalinated water production of these new capacities from the saved budget are described in Figure 12 and Figure 13 for the proposed scenarios. By increasing the share of R&D in Figure 13, as expected, the VRE electricity generation is diminished because the budget for the VRE generation is reduced and invested in R&D instead. For the water sector in the D_MED scenario, although the MED water production rises from 1% for no R&D share to 8% for 10% R&D share because of the same reason, the required budget decreases 17% because of the high cost reduction of photovoltaic electricity (around 28%). This reveals the role of LCOE in the cost of water desalination, indicating that with a 17% lower budget compared to the budget for no share of R&D in the D_MED scenario, the MED water production rises about 7%.
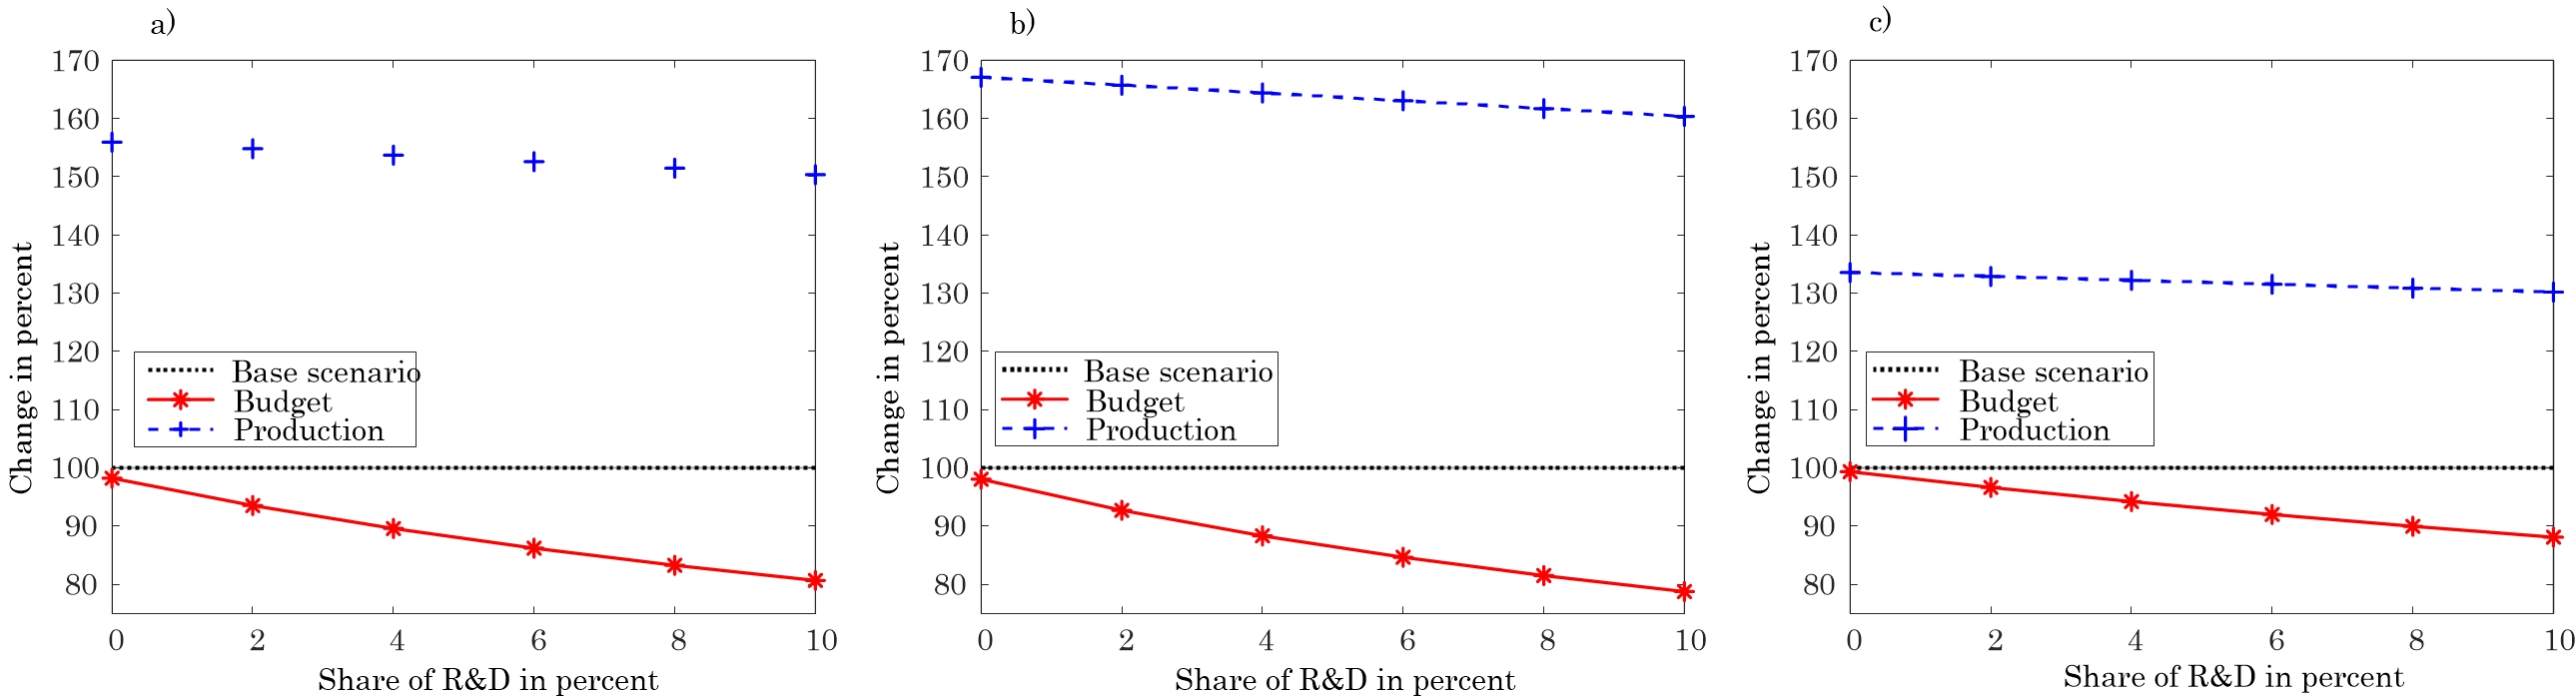
Figure 12. Sensitivity analysis on the share of R&D from the saved budgets for the share and budget of VRE power production for: (a) The C_RO scenario; (b) the D_RO scenario; (c) the D_MED scenario.
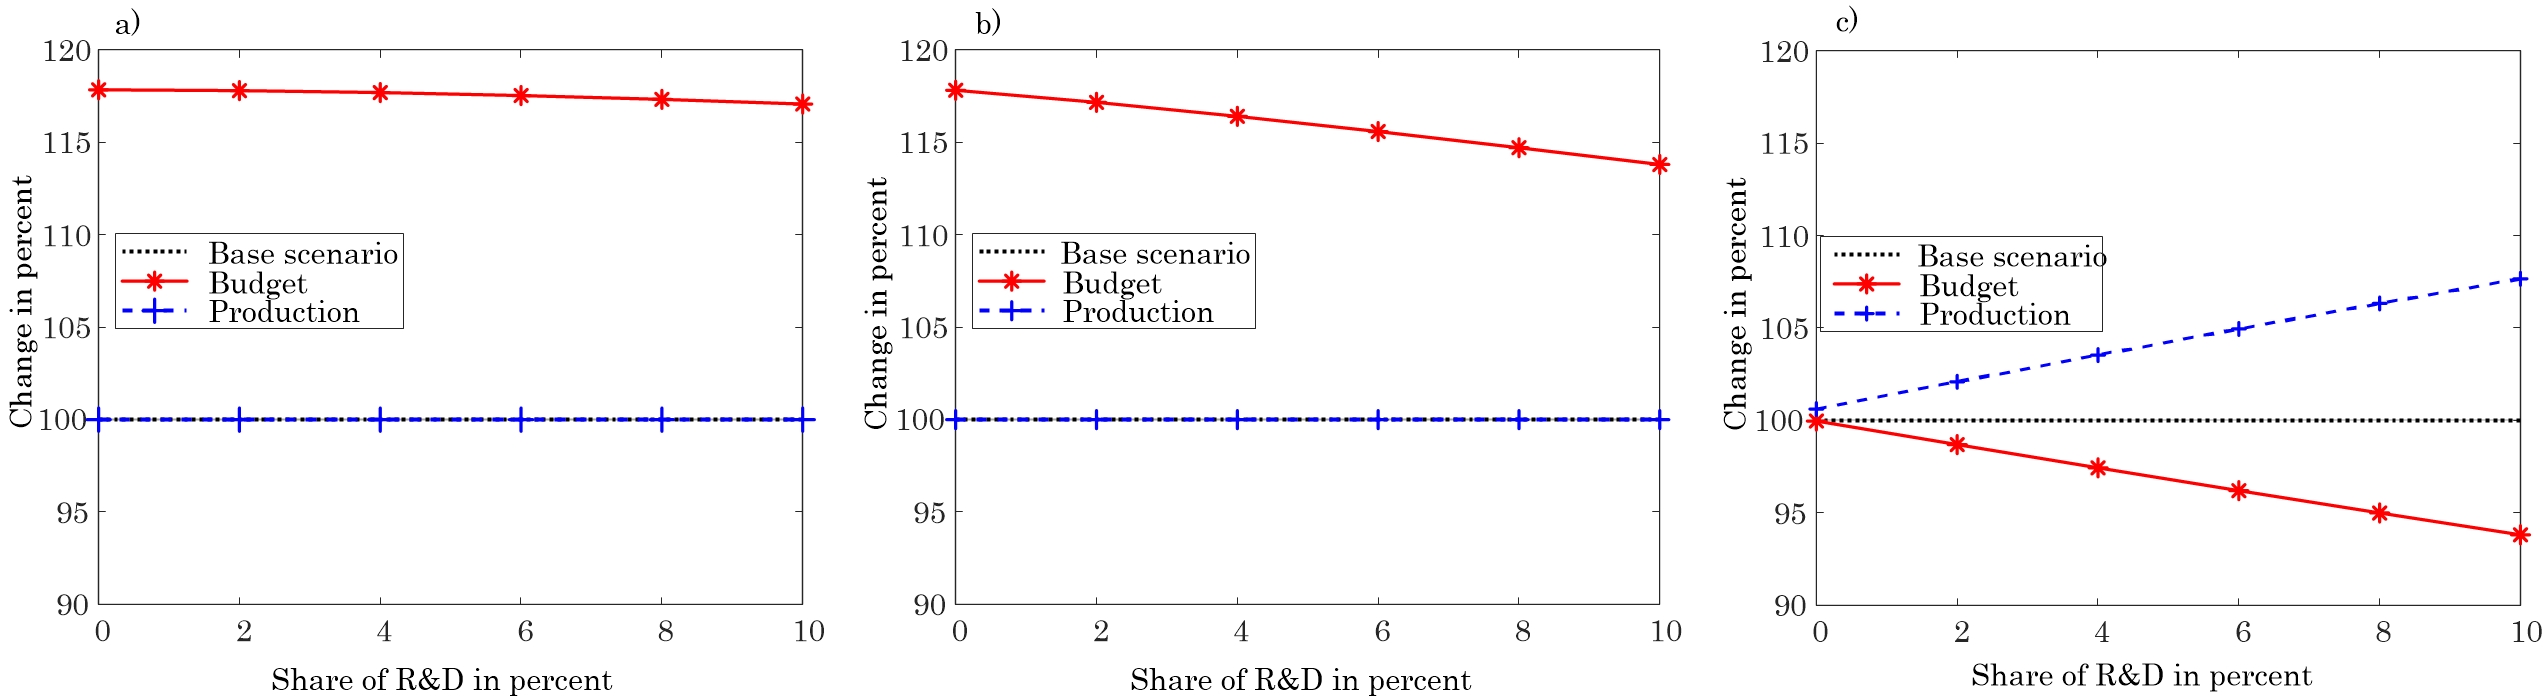
Figure 13. Sensitivity analysis on the share of R&D from the saved budgets for share and budget of desalination water production for: (a) the C_RO scenario; (b) the D_RO scenario; (c) the D_MED scenario.
3. Conclusions
In the Middle East, the water and energy sectors are planning to transition towards a higher share of renewable resources and desalinated water supplies. A novel methodology is developed to model synergies of integrated planning of inter-linked sectors. The nexus approach in this study revealed that the configuration of each sector has direct impacts on the other sector. Designing the water sector and energy sector as endogenous parts of one system can decrease the cost of the fluctuating renewable power generation for the energy sector in all the proposed scenarios. Among these scenarios, in only one scenario, the scenario with the decentralized water sector and multiple effect distillation desalination technology, the water sector experienced synergistic results, causing a lower required budget and levelized cost of desalinated water compared to the base scenario with the separated water and energy sectors. On the other hand, other scenarios imposed a higher levelized cost of desalinated water and required budget on the water sector, revealing a conflict between the water and energy sectors. The synergy results for a 5% research and development share from the saved budget showed that by modeling the water and energy sectors at the same time, the levelized cost of variable renewable electricity decreased 4% for the scenario with the centralized reverse osmosis water sector, 12% for the scenario with reverse osmosis decentralized water sector, and 11% for the multiple effect distillation decentralized water sector compared to the 17.6 $/MWh for the base scenario with the separated sectors. Meanwhile, renewable electricity generation grows 32%, 64%, and 53% with 7%, 14%, and 12% less budget, respectively. Although the scenario with the reverse osmosis decentralized water sector has a better performance in the energy sector, this scenario requires 16% more budget for the water sector and reaches levelized cost of desalinated water of 0.98 $/m3, which is 24% higher compared to the base scenario to meet same targets. In the meantime, the scenario with the multiple effect distillation decentralized water sector reaches levelized cost of desalinated water of 0.74 $/m3, which is 6% lower the base scenario while producing 4% more desalinated water with 3% less required budget. Furthermore, this scenario showed a better performance in reducing greenhouse gas emissions due to its size compatibility with renewable-powered desalination facilities. As a result, the scenario with the decentralized water sector and renewable-powered multiple effect distillation desalination technology showed the best overall performance among the proposed scenarios. Moreover, the sensitivity analysis revealed the role of levelized cost of energy in the cost of water desalination, indicating that with a 17% lower budget compared to the budget for no share of research and development, the multiple effect distillation water production rises about 7%. In summary, the integrated planning of the water and energy sectors, as focal target sectors in sustainable development goals for Iran, could bring technical, economic, and environmental synergic benefits while it is necessary for avoiding conflicts.
It is noteworthy to mention that the estimated learning rates of the two-factor learning curves in this study showed that the research and development investment have a significant role in deployment and cost reduction of photovoltaic, wind, multiple effect distillation, and reverse osmosis technologies due to higher learning-by-searching rates comparing to learning-by-doing rate. Despite the fact that the learning-by-searching rate is higher than the learning-by-doing rate for all these technologies, the main percentage of the cost reduction is driven from the experience of production for the wind and photovoltaic technologies showing these technologies are facing an inadequate research and development budget for development. Nevertheless, in the proposed scenarios in this study, investing a portion of the saved budgets on research and development solved this issue to some extent.
Finally, considering all technology developments, renewable energy and desalination supplies remain more expensive than conventional resources for the next few decades. The proposed renewable-powered desalination system in this study enables the rural regions, as a priority area for development in the strategies for sustainable development goals in Iran, to benefit from required massive national investment and subsidies.
References
- Noorollahi, Y.; Shabbir, M.S.; Siddiqi, A.F.; Ilyashenko, L.K.; Ahmadi, E; Review of two decade geothermal energy development in Iran, benefits, challenges, and future policy. Geothermics 2019, 77, 257–266.
- Iran’s Sixth Five-Year Development Plan. Available online: https://rc.majlis.ir/fa/law/show/1014547 (accessed on 5 March 2020).
- Omid, S.K. Iran’s Transition to Renewable Energy: Challenges and Opportunities. Middle East Policy 2019, 26.
- General Algebraic Modeling System (GAMS). Available online: https://www.gams.com/download/ (accessed on 1 May 2020).
- Population Estimates and Projections, World Bank Group. Available online: https://datacatalog.worldbank.org/dataset/population-estimates-and-projections (accessed on 8 October 2019).
- Statistical Center of Iran > Iran Statistical Yearbook > Statistical-Yearbook-2016–2017. Available online: https://www.amar.org.ir/english/Iran-Statistical-Yearbook/Statistical-Yearbook-2016-2017 (accessed on 18 January 2020).
- Cole, W.J.; Frazier, A. Cost Projections for Utility-Scale Battery Storage; Technical Report NREL/TP-6A20-73222; National Renewable Energy Laboratory: Golden, CO, USA, 2019; p. 1529218.
- Benedikt Battke; Tobias S. Schmidt; Cost-efficient demand-pull policies for multi-purpose technologies – The case of stationary electricity storage. Applied Energy 2015, 155, 334-348, 10.1016/j.apenergy.2015.06.010.
- Alexandre C. Köberle; David E.H.J. Gernaat; Detlef Van Vuuren; Assessing current and future techno-economic potential of concentrated solar power and photovoltaic electricity generation. Energy 2015, 89, 739-756, 10.1016/j.energy.2015.05.145.
- Asami Miketa; Leo Schrattenholzer; Experiments with a methodology to model the role of R&D expenditures in energy technology learning processes; first results. Energy Policy 2004, 32, 1679-1692, 10.1016/s0301-4215(03)00159-9.
- Yi Zhou; Alun Gu; Learning Curve Analysis of Wind Power and Photovoltaics Technology in US: Cost Reduction and the Importance of Research, Development and Demonstration. Sustainability 2019, 11, 2310, 10.3390/su11082310.
- Peter H. Kobos; Jon D. Erickson; Thomas Drennen; Technological learning and renewable energy costs: implications for US renewable energy policy. Energy Policy 2006, 34, 1645-1658, 10.1016/j.enpol.2004.12.008.
- Edward S. Rubin; Inês M.L. Azevedo; Paulina Jaramillo; Sonia Yeh; A review of learning rates for electricity supply technologies. Energy Policy 2015, 86, 198-218, 10.1016/j.enpol.2015.06.011.
- ALMAR Water Solution Desalination Technologies and Economics: CAPEX, OPEX & Technological Game Changers to Come. Available online: https://www.cmimarseille.org/knowledge-library/desalination-technologies-and-economics-capex-opex-technological-game-changers-0 (accessed on 18 January 2020).
- Upeksha Caldera; Christian Breyer; Learning Curve for Seawater Reverse Osmosis Desalination Plants: Capital Cost Trend of the Past, Present, and Future. Water Resources Research 2017, 53, 10523-10538, 10.1002/2017wr021402.
- Mayor, B. Multidimensional Analysis of Nexus Technologies I: Diffusion, Scaling and Cost Trends of Desalination; IIASA: Laxenburg, Austria, 2018.
- UNESCO Institute for Statistic How Much Does Your Country Invest in R&D? Available online: http://www.uis.unesco.org/_LAYOUTS/UNESCO/research-and-development-spending/index-en.html (accessed on 15 April 2020).
- World Bank. The Role of Desalination in an Increasingly Water-Scarce World; Water Papers; World Bank: Washington, DC, USA, 2019.
- Veera Gnaneswar Gude; Desalination and sustainability – An appraisal and current perspective. Water Research 2016, 89, 87-106, 10.1016/j.watres.2015.11.012.
- Aditya Sood; Vladimir Smakhtin; Can Desalination and Clean Energy Combined Help to Alleviate Global Water Scarcity?. JAWRA Journal of the American Water Resources Association 2014, 50, 1111-1123, 10.1111/jawr.12174.
- National Petrochemical Company GHG Emission in Iran. Available online: https://hse.nipc.ir/uploads/mop-307.pdf (accessed on 20 March 2020).
- Azadi, P.; Sarmadi, A.; Mahmoudzadeh, A.; Shirvani, T. The Outlook for Natural Gas, Electricity, and Renewable Energy in Iran; Elsevier: Amsterdam, The Netherlands, 2017.
- United Nations Development Assistance Framework (UNDAF) for Iran. Available online: https://www.unodc.org/islamicrepublicofiran/en/undaf-2017-2021.html (accessed on 16 May 2020).
- Sustainable Development Goals (SDG), Iran: Sustainable Development Knowledge Full Report. Available online: https://sustainabledevelopment.un.org/memberstates/iran (accessed on 16 May 2020).


