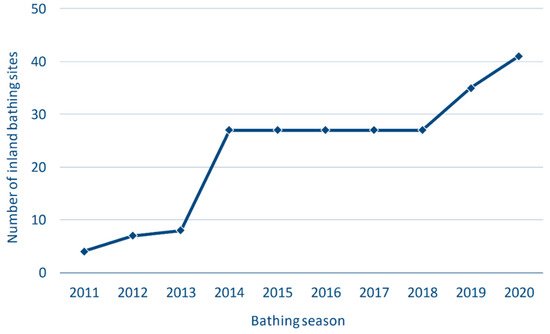
In the first year of the period covered by this study (2011), only four bathing sites were included in the official monitoring program for inland bathing water quality in Croatia. Over time, the number of sites grew, and in the last observed year (2020), 41 sites were monitored (
Figure 1). One of the main reasons for the low number of bathing sites in the first monitoring period was the lack of legislation for inland bathing water management, as the Regulation on Bathing Water Quality (OG, 2014)
[1] only came into force in 2014. This year coincides with a year when the number of inland bathing sites increased significantly. As Croatia is rich in water bodies, many of which are suitable for bathing and recreation, it is obvious that the country has not even come close to exploiting its potential in the field of inland bathing tourism. With better management and use of inland bathing waters, Croatia would not only expand its tourist offer but also relieve the coastal areas during the bathing season.
Figure 1. The number of inland bathing sites in Croatia in the period 2011–2020.
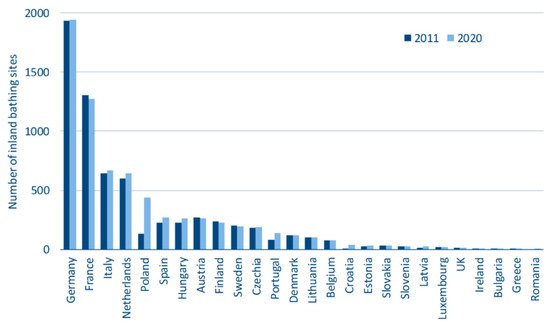
During the observed period (2011–2020), the number of inland bathing sites (N) in the EU was highest in Germany (N2011 = 1938; N2020 = 1941), followed by France (N2011 = 1304; N2020 = 1941), Italy (N2011 = 647; N2020 = 672) and the Netherlands (N2011 = 603; N2020 = 645) (Figure 2). In contrast, the lowest number of bathing sites was in Romania (N2011 = 0; N2020 = 1), Greece (N2011 = 6; N2020 = 3) and Bulgaria (N2011,2020 = 4) (Figure 2). Looking at the total number of inland bathing sites for all EU Member States, this increased by 8.0% from 2011 to 2020, from 6497 to 7019 sites.
Figure 2. The number of inland bathing sites in the EU in the 2011 and 2020 bathing season.
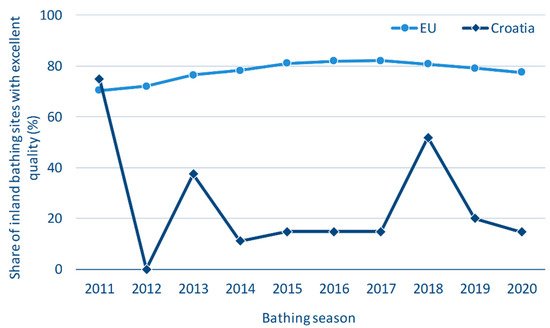
Looking at the EU as a whole, the first seven years of the monitoring period show a constant increase in the proportion of bathing sites with excellent water quality (70.4% in 2011, 82.1% in 2017) and a decrease of 4.6% in the last three years (80.8% in 2018, 79.1% in 2019 and 77.5% in 2020). On the other hand, the Croatian share fluctuated significantly during the observed period (75% in 2011, 0% in 2012, 51.9% in 2018 and 14.6% in 2020) (
Figure 3). The reason for this is that Croatian monitoring of inland waters is relatively new (since the 2011 season), so the number of sites has not yet stabilized
[2].
Figure 3. The share of inland bathing waters with excellent water quality in HR and the EU during the period 2011–2020.
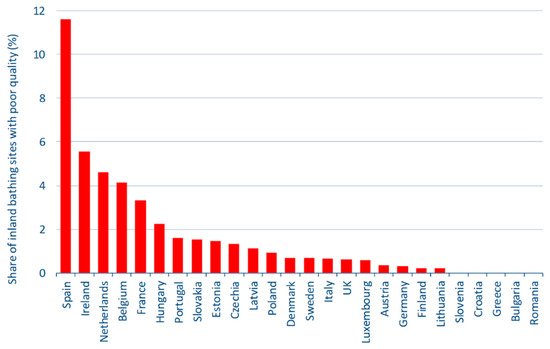
During the ten-year study period, Germany had the highest proportion of excellent water quality (92.2%), while Spain had the highest proportion of poor water quality (11.6%), an average of 31 bathing sites per year. This was followed by Ireland with 5.6% of bathing sites with poor water quality (an average of 0.5 bathing sites per year), the Netherlands with 4.6% (an average of 30 bathing sites per year), Belgium with 4.2% (an average of three bathing sites per year) and France with 3.3% (an average of 42 bathing sites per year). Apart from Croatia, Slovenia, Greece, Bulgaria and Romania also belong to the group of countries without bathing sites with poor water quality (Figure 4).
Figure 4. The average share of inland bathing sites of poor water quality in EU countries during the 2011–2020 period.
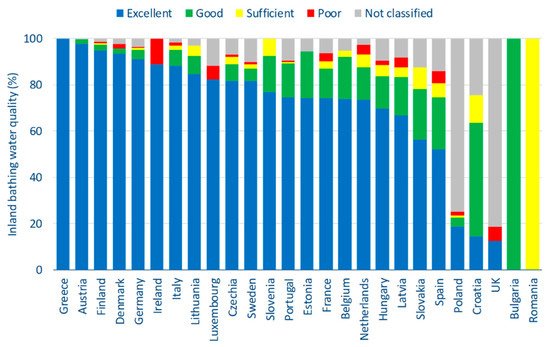
The highest proportion of bathing sites with excellent water quality for the last year of the study period (2020) was recorded in Greece (100%, N = 3). The percentage of bathing sites with excellent water quality ≥90% was also achieved by Austria (97.7%, N = 261), Finland (94.7%, N = 225), Denmark (93.3%, N = 120) and Germany (91.1%, N = 1941) (Figure 5). The percentage of bathing sites with excellent quality <50% was recorded by Poland (18.8%, N = 436), Croatia (14.6%, N = 41), the United Kingdom (12.5%, N = 16), Bulgaria (0%, N = 4) and Romania (0%, N = 1) (Figure 5). It is interesting to note that the lowest proportion of bathing sites with excellent water quality is found in the new EU Member States. This is probably due to the fact that these countries have not yet reached the high standards of wastewater collection, treatment and environmental protection that the “old” members, in particular Finland, Denmark and Germany, have achieved. This suggests that the new EU members need to make additional efforts in the efficient management of waste water and the protection of surface waters, including bathing waters, by using new technologies and the experience of the “old” Member States.
Figure 5. The quality of inland bathing waters in EU Member States in 2020.
The largest amount of freshwater resources (lakes, rivers, streams and groundwater) exist in France, Sweden and Germany
[3]. If we look at freshwater resources per inhabitant, the most water-rich EU countries are Croatia, Finland and Sweden. Among these countries, Finland and Germany have the highest proportion of excellent inland water quality. Countries experiencing “water stress” are Poland, Czech Republic, Cyprus and Malta, of which Cyprus and Malta do not monitor inland bathing water quality.
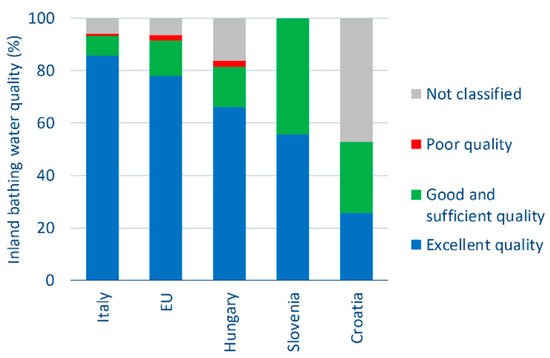
Looking at the EU Member States bordering Croatia, the best water quality over the 10-year period was recorded in Italy, where on average 85.8% of bathing sites had excellent water quality (Figure 6). Italy was the only country where the proportion of bathing sites with excellent quality was higher than the EU average (78%). This was followed by Hungary with 66.2%, Slovenia with 55.8% and Croatia with 25.5% of bathing sites with excellent water quality. The highest percentage of bathing sites with good and satisfactory water quality was found in Slovenia (44.3%), while the percentage of bathing sites with poor water quality was highest in Hungary (2.2%). The highest percentage of non-designated bathing areas was recorded in Croatia (47.2%).
Figure 6. Ten-year average of inland bathing water quality in HR and neighboring EU Member States.
Croatia’s neighbors, which are not EU members, and that also monitor inland bathing water quality, are Serbia and Montenegro. Bathing water management in the Republic of Serbia is regulated by two legal acts, the “Regulation On the Parameters of Ecological Additionally, Chemical Status of Surface Waters and Parameters of Chemical Status and Quantitative Status of Groundwaters” (Official Gazette of the Republic of Serbia 74/2011)”
[4] and the “Regulation on Emission Limit Values of Polluting Substances In Surface and Groundwater and Deadlines for Their Achievement (Official Gazette of the Republic of Serbia 50/2012)”
[5].
Since the parameters and standards for bathing water quality in Serbia are not in line with those of the BWD, it is very difficult to compare the results with those of the EU Member States. In any case, the quality of inland bathing waters in the Republic of Serbia was analyzed in 2019 (latest available data)
[6] at a total of 78 bathing sites; 42 in Central Serbia and 36 in Vojvodina. A total of 777 samples were analyzed for microbiological quality, of which 65 (8.4%) did not meet the requirements of national standards for acceptable quality. The highest percentage of non-compliant water samples was found in the district North Banat (97.4%).
The data showed that the quality of inland bathing waters in Croatia and neighboring countries (which are not members of the EU) was generally worse than the EU average. The results of a study by Markovski et al.
[7] which covered four countries, Bosnia and Herzegovina, Macedonia, Montenegro and Serbia, pointed to the difficulties in managing water resources in the region. One of the main reasons was the availability of reliable data on the quality of water bodies in these non-EU countries. This confirms the fact that these countries need additional investments in environmental protection and better and responsible wastewater management. Considering that these countries share many water bodies, it is obvious that efforts to protect these waters from pollution need to be coordinated and reciprocal.
2. Coastal Bathing Sites
In the first year of the period covered by this study (2011), 906 bathing sites were included in the official Croatian coastal bathing water quality monitoring program. In the following years, the total number of bathing sites fluctuated within 100 sites. In the last observed year (2020), Croatia recorded the lowest total number of official coastal bathing sites (894).
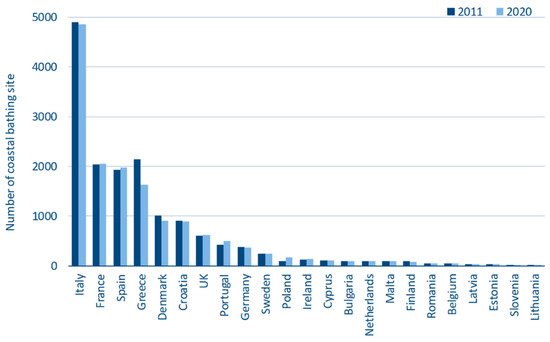
During the 2011 bathing season, the quality of coastal bathing waters in EU Member States was monitored at a total of 14,538 bathing sites. The number increased steadily and reached 14,985 in the last year of the study period (2020)
[8], representing an increase of 3.1%. The highest number of coastal bathing sites was recorded in Italy (N
2011 = 4902; N
2020 = 4848), France (N
2011 = 2029; N
2020 = 2055), Spain (N
2011 = 1927; N
2020 = 1969) and Greece (N
2011 = 2149; N
2020 = 1631) (
Figure 7). All these Member States are “large” Mediterranean countries with a long coastline. These are also the countries that are highly dependent on marine tourism, as they all have a relatively high share of tourism revenues in GDP
[9]. On the other hand, the lowest number of coastal bathing sites was recorded in Lithuania (N
2011,2020 = 16), Slovenia (N
2011, 2020 = 21), Estonia (N
2011 = 27; N
2020 = 29) and Latvia (N
2011 = 32; N
2020 = 33), which was to be expected given the short length of their coastline and/or their geographical location.
Figure 7. The number of coastal bathing sites in EU in the 2011 and 2020 bathing seasons.
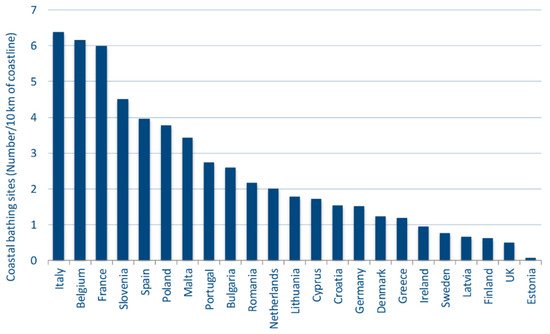
Looking at the number of bathing sites along the coastline of EU Member States, Italy has the most bathing sites per 10 km of coastline (6.4). This is due to the flat and sandy western Adriatic coast with many wide and long sandy beaches. Belgium (6.2) and France (6.0) follow behind. Member States with ≥4 sites per 10 km are Slovenia (4.5) and Spain (4.0) (Figure 8). On the other hand, Estonia (0.1), the United Kingdom (0.5), Sweden (0.8), Finland (0.6) and Latvia (0.7) have less than one site per 10 km of coastline. This is to be expected as these are mainly northern countries with steeper, less accessible and rocky coasts and a much shorter bathing season than in the southern EU Member States.
Figure 8. Number of coastal bathing sites in relation to the length of the coastline in EU Member States.
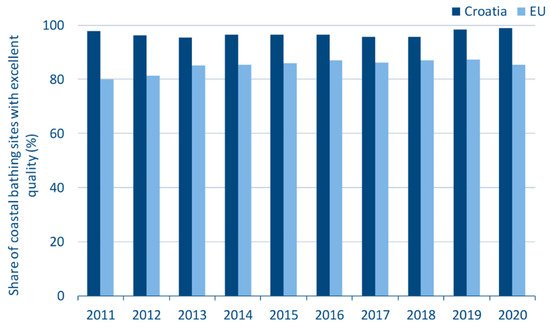
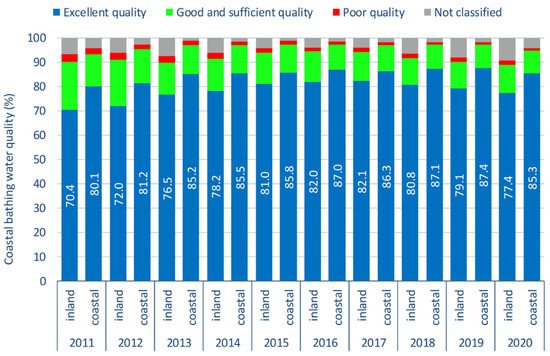
Looking at the period from 2011 to 2020, it is noticeable that the share of bathing sites with excellent quality in Croatia was significantly higher than the EU average. This proportion was below 96% only in the 2013 (95.4%), 2017 (95.8%) and 2018 (95.6%) bathing seasons. At the EU level, the proportion of bathing sites with excellent quality ranged from 85.2% to 87.4% during this period, with the exception of 2011 and 2012, when it was 80.1% and 81.2%, respectively (Figure 9). The highest proportion of excellent water quality was recorded in Cyprus (99.3%).
Figure 9. The share of coastal bathing waters with excellent water quality for HR and EU during the period 2011–2020.
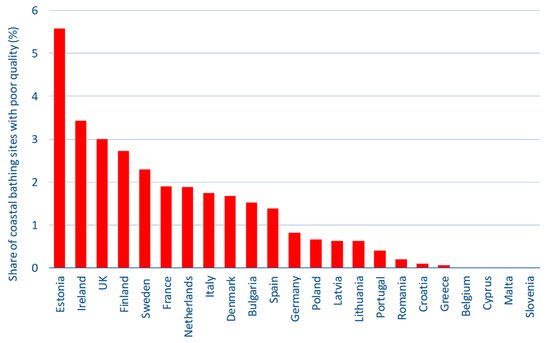
Looking at the 10-year average number of poor-quality bathing sites in the EU Member States, the highest proportion was recorded in Estonia (5.6%), with an average of two sites per year. This was followed by Ireland (3.4%) with an average of five sites per year and the United Kingdom (3.0%) with an average of 19 sites per year. Member States with ≥2% poor-quality bathing sites were Finland (2.7%) and Sweden (2.3%), with an average of two and six sites per year, respectively. Croatia recorded 0.1% poor-quality bathing sites, an average of one site per year. During the same period, Belgium, Cyprus, Malta and Slovenia were among the group with no poor-quality bathing sites (Figure 10).
Figure 10. The average share of coastal bathing sites of poor quality in the EU countries during the period 2011–2020.
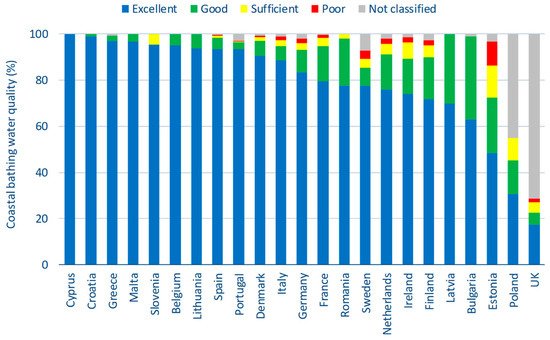
In the last year of the observed period (2020), Cyprus recorded the highest proportion of excellent-quality bathing sites (100%, N = 112). It was followed by Croatia (98.8%, N = 894), Greece (97.1%, N = 1631), Malta (96.6%, N = 87), Slovenia (95.2%, N = 21) and Belgium (95.1%, N = 41) (Figure 11). In all other EU Member States, the proportion of sites with excellent quality was >60%. Exceptions were Estonia (48.3%, N = 29), Poland (30.7%, N = 166) and the United Kingdom (17.3%, N = 624). It should be highlighted that Poland and the United Kingdom had a high proportion of unclassified bathing sites (45.2% and 71.2%, respectively). This resulted in a significant decrease in bathing sites with excellent water quality. In Poland, this was due to the fact that a large number of bathing sites were newly designated, so that the data set needed for the assessment was not yet available. In the United Kingdom, a large number of samples were not taken during the 2020 bathing season due to circumstances related to the COVID-19 pandemic. Countries with a low number of bathing sites per 10 km of coastline (Estonia, United Kingdom, Sweden, Finland, and Latvia) generally have a lower proportion of excellent-quality bathing sites or a high proportion of unclassified bathing sites.
Figure 11. The quality of coastal bathing waters in EU Member States during 2020.
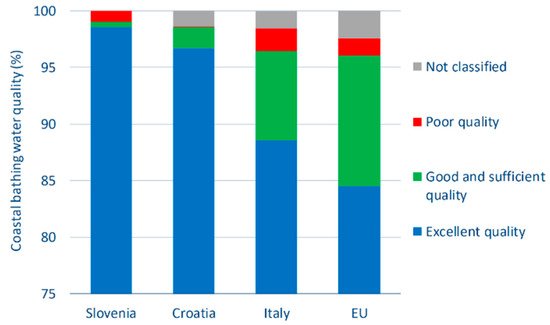
Looking at the share of bathing sites with excellent water quality over the ten-year period for the EU Member States bordering Croatia, Slovenia recorded the highest share of 98.6% (Figure 12). The average share of bathing sites with excellent water quality in all EU Member States was 84.5%. Italy had a higher proportion (88.6%) than the EU average, as did Croatia. With regard to this criterion, Croatia was just behind Slovenia with 96.7% of bathing sites with excellent quality. Of the three countries, Italy had the highest percentage of bathing sites of good and satisfactory quality (7.9%) and poor quality (2.0%), as well as unclassified bathing sites (1.6%).
Figure 12. Ten-year average of coastal bathing water quality in Croatia and neighboring EU Member States.
Croatia’s neighboring country, which is not a member of the EU and also carries out official monitoring of coastal bathing water quality, is Montenegro. As part of the 2020 bathing water quality management, Montenegro monitored coastal water quality at a total of 110 bathing sites. Of all sites, 105 (95.5%) had excellent quality, and 5 (4.5%) were of good quality
[10].
The Republic of Bosnia and Herzegovina has three coastal sites where three samples were taken during the bathing season, all of which were of excellent quality
[11].
 +1 credit