2. Dietary Flavonoids
Flavonoids are widely spread in different foods and beverages (such wine and tea), but the sources with the highest levels are fruits and vegetables
[10]. Among the fruits (
Table 1), the highest levels of flavonoids are found in berries, such as black elderberry (1358.66 mg/100 g) and black chokeberry (1012.98 mg/100 g)
[15][16]. In the drupes group, some fruits such as plum and sweet cherry have higher levels of flavonoids than the rest of the group, 101.67 mg/100 g and 185.05 mg/100 g, respectively
[17][18]. In the pomes group, apple has the level (56.35 mg/100 g)
[18][19]. Furthermore, tropical fruits have a very low flavonoid content
[20]. Depending on the type of fruit, the main flavonoid subclass groups vary: anthocyanins predominate in berries, and flavanols predominate in pomes, tropical fruits, and drupes (except in sweet cherry).
Table 1. Flavonoid contents of fruits (mg/100 g food). Data collected from Phenol Explorer
[21].
| Fruits |
ANT |
DYC |
FVA |
FVO |
Total |
| Berries |
| Aestivalis grape |
79.74 |
- |
- |
1.7 |
81.44 |
| American cranberry |
49.89 |
- |
- |
43.84 |
93.73 |
| Black chokeberry |
878.11 |
- |
- |
134.87 |
1012.98 |
| Black elderberry |
1316.66 |
- |
- |
42 |
1358.66 |
| Black raspberry |
- |
- |
- |
19 |
19 |
| Blackberry |
172.59 |
- |
13.87 |
16.87 |
203.33 |
| Blackcurrant |
593.58 |
- |
1.17 |
13.68 |
608.43 |
| Black grape |
72.15 |
- |
14.03 |
4.01 |
90.19 |
| Green grape |
- |
- |
3.78 |
2.49 |
6.27 |
| Green currant |
- |
- |
- |
11.07 |
11.07 |
| Highbush blueberry |
156.6 |
- |
1.11 |
54.77 |
212.48 |
| Lingonberry |
60.21 |
- |
- |
48.98 |
109.19 |
| Lowbush blueberry |
204.56 |
- |
- |
- |
204.56 |
| Red raspberry |
72.47 |
- |
5.73 |
16.26 |
94.46 |
| Redcurrant |
33.13 |
- |
4.68 |
0.77 |
38.58 |
| Strawberry |
26.87 |
- |
9.1075 |
2.32 |
38.29 |
| Drupes |
| Nectarine |
0.86 |
- |
17.65 |
1.35 |
19.86 |
| Peach |
0.28 |
- |
45.18 |
1.42 |
46.88 |
| Plum |
47.79 |
- |
46.9 |
6.98 |
101.67 |
| Sour cherry |
54.43 |
- |
0.2 |
- |
54.63 |
| Sweet cherry |
170.18 |
- |
14.87 |
- |
185.05 |
| Pomes |
| Apple |
0.93 |
5.38 |
39.42 |
10.62 |
56.35 |
| Pear |
- |
- |
4.98 |
0.84 |
5.82 |
| Quince |
- |
- |
7.49 |
0.67 |
8.16 |
| Tropical Fruits |
| Banana |
- |
- |
1.55 |
- |
1.55 |
| Kiwi |
- |
- |
0.7 |
- |
0.7 |
| Mango |
- |
- |
1.72 |
- |
1.72 |
| Persimmon |
- |
- |
1.28 |
- |
1.28 |
| Pomegranate |
- |
- |
1.1 |
- |
1.1 |
Regarding vegetables (
Table 2), the foods with the highest levels of flavonoids are broad bean pod (189.54 mg/100 g)
[22], black olive (159.83 mg/100 g)
[23], red onion (131.51 mg/100 g)
[24], spinach (119.27 mg/100 g), and shallot (112.22 mg/100 g)
[25][26]. Except for broad bean pod, the predominate flavonoid subclass in vegetables is flavanols.
Table 2. Flavonoid contents of vegetables (mg/100 g food)
[21].
| Vegetables |
ANT |
CHA |
FVA |
FNE |
FVE |
FVO |
Total |
| Cabbages |
| Broccoli |
- |
- |
- |
- |
- |
27.8 |
27.8 |
| Fruit Vegetables |
| Avocado |
- |
- |
0.55 |
- |
- |
- |
0.55 |
| Black olive |
82.97 |
- |
- |
- |
27.43 |
49.43 |
159.83 |
| Green olive |
- |
- |
- |
- |
0.56 |
- |
0.56 |
| Green sweet pepper |
- |
- |
- |
- |
2.11 |
5.49 |
7.6 |
| Red sweet pepper |
- |
- |
- |
- |
0.05 |
0.24 |
0.29 |
| Tomato |
- |
- |
- |
0.14 |
- |
0.014 |
0.15 |
| Leaf Vegetables |
| Curly |
- |
- |
- |
- |
- |
24.06 |
24.06 |
| Escarole |
- |
- |
- |
- |
- |
18.23 |
18.23 |
| Green lettuce |
- |
- |
- |
- |
0.4 |
3.99 |
4.39 |
| Red lettuce |
3.53 |
|
- |
- |
2.51 |
16.74 |
22.78 |
| Spinach |
- |
- |
- |
- |
- |
119.27 |
119.27 |
| Onion-Family Vegetables |
| Red onion |
9 |
- |
- |
- |
- |
122.51 |
131.51 |
| White onion |
- |
- |
- |
- |
- |
5.4 |
5.4 |
| Yellow onion |
- |
- |
- |
- |
- |
59.1 |
59.1 |
| Shallot |
- |
- |
- |
- |
- |
112.22 |
112.22 |
| Pod Vegetables |
| Broad bean pod |
- |
0.08 |
154.45 |
- |
0.37 |
34.64 |
189.54 |
| Green bean |
- |
- |
2.42 |
- |
- |
5.55 |
7.97 |
| Shoot Vegetables |
| Asparagus |
- |
- |
- |
- |
- |
23.19 |
23.19 |
| Globe artichoke, heads |
- |
- |
- |
- |
57.8 |
- |
57.8 |
Regarding seeds (
Table 3), although common bean has high levels of flavonoids (from anthocyanins and flavonols), the foods with the highest levels are those derived from soy, and soy products have been suggested to play a key role in the prevention of different diseases
[27].
Table 3. Flavonoid contents of seeds (mg/100 g food)
[21].
| Seeds |
ANT |
FVA |
FNE |
FVE |
FVO |
IFA |
Total |
| Nuts |
| Almond |
- |
4.93 |
0.5 |
- |
3.81 |
0.06 |
9.3 |
| Cashew nut |
- |
1.1 |
- |
- |
- |
- |
1.1 |
| Chestnut |
- |
0.05 |
- |
- |
- |
- |
0.05 |
| Hazelnut |
- |
5.7 |
- |
- |
- |
- |
5.7 |
| Peanut |
- |
- |
- |
- |
- |
0.51 |
0.51 |
| Pecan nut |
- |
16.7 |
- |
- |
- |
- |
16.7 |
| Pistachio |
|
6.9 |
0.12 |
0.103 |
0.07 |
|
7.193 |
| Common Bean |
| Black common bean |
41.05 |
- |
- |
- |
10 |
1.4 |
52.45 |
| Others common bean |
7.42 |
- |
- |
- |
69.58 |
0.2 |
77.2 |
| White common bean |
0.13 |
- |
- |
- |
49.96 |
0.5 |
50.59 |
| Other Beans |
| Broad bean seed whole |
- |
49.37 |
- |
- |
- |
- |
49.37 |
| Sunflower seed meal |
- |
- |
- |
- |
- |
0.02 |
0.02 |
| LENTILS |
| Lentils |
- |
5.17 |
|
0.95 |
1.09 |
- |
7.21 |
| Soy Products |
| Soy paste miso |
- |
- |
- |
- |
- |
63.09 |
63.09 |
| Soy tempeh |
- |
- |
- |
- |
- |
147.74 |
147.74 |
| Soy tofu |
- |
- |
- |
- |
- |
39.24 |
39.24 |
| Soybean roasted |
- |
- |
- |
- |
- |
253.11 |
253.11 |
Regarding cereals (
Table 4), some such as barley, buckwheat, and common wheat contain average levels of flavonoids (35.2 mg/100 g, 37.04 mg/100 g, and 77.4 mg/100 g, respectively). However, it is important to note that the highest levels are found in whole grains, and levels are greatly reduced when grains are heat treated or refined
[27][28].
Table 4. Flavonoid contents of cereals (mg/100 g food)
[21].
| Cereals |
FVA |
FVE |
FVO |
Total |
| Cereals |
| Barley, whole grain flour |
35.2 |
- |
- |
35.2 |
| Buckwheat groats, thermally treated |
- |
- |
8.96 |
8.96 |
| Buckwheat, refined flour |
- |
- |
5.86 |
5.86 |
| Buckwheat, whole grain flour |
- |
0.9 |
36.14 |
37.04 |
| Common wheat, refined flour |
- |
18.4 |
0.08 |
18.48 |
| Common wheat, whole grain flour |
- |
77.29 |
0.11 |
77.4 |
Cocoa and its products, such as dark and milk chocolate, are flavonoid-rich foods (
Table 5). In these foods, the main flavonoids are flavanols, with cocoa containing 511.63 mg/100 g
[29][30].
Table 5. Flavonoid contents of cocoa (mg/100 g food)
[21].
| Cocoa |
FVA |
FVO |
Total |
| Cocoa |
| Chocolate dark |
212.36 |
25 |
237.36 |
| Chocolate milk |
19.22 |
- |
19.22 |
| Cocoa powder |
511.62 |
- |
511.62 |
Regarding oils, the data collected from the Phenol Explorer database refer only to oils made from olives (
Table 6). In ascending order, refined, virgin, and extra virgin olive oil contain 0.15 mg, 0.23 mg, and 1.53 mg of flavones in 100 g, respectively
[31][32].
Table 6. Flavonoid contents of oils (mg/100 g oil)
[21].
| Oils |
FVE |
Total |
| Oils |
| Extra virgin olive oil |
1.53 |
1.53 |
| Virgin olive oil |
0.23 |
0.23 |
| Refined olive oil |
0.15 |
0.15 |
For beverages, a distinction can be made between non-alcoholic (
Table 7) and alcoholic drinks (
Table 8). The non-alcoholic drinks with the highest levels of flavonoids are tea infusions, particularly black (83.35 mg/100 g) and green tea (77.44 mg/100 g), and these are mainly flavanols
[33][34]. The second most flavonoid-rich beverages are fruit juices, notably pure apple juice (54.99 mg/100 g), pure orange juice (48.02 mg/100 g), pure grapefruit juice (47.12 mg/100 g), and pure lemon juice (37.43 mg/100 g)
[35]. The main flavonoids in citrus juices and grapefruit juice are flavanones
[36]. However, the main flavonoids in pome juices are flavanols. Regarding alcoholic beverages, wine red contains the highest flavonoid level (83.96 mg/100 mL)
[37][38].
Table 7. Flavonoid contents of non-alcoholic beverages (mg/100 g drink)
[21].
| Non-Alcoholic Beverages |
ANT |
DYC |
FVA |
FNE |
FVE |
FVO |
IFA |
Total |
| Cocoa Beverage |
| Chocolate, milk |
- |
- |
20.33 |
- |
- |
- |
- |
20.33 |
| Fruit Juices |
| Berry Juices |
| Fox grape juice |
- |
- |
5.9 |
- |
- |
- |
- |
5.9 |
| Green grape juice |
- |
- |
3.88 |
- |
- |
- |
- |
3.88 |
| Grapefruit juice |
- |
- |
- |
46.44 |
- |
0.68 |
- |
47.12 |
| Citrus Juices |
| Lemon juice |
- |
- |
- |
32.66 |
4.77 |
- |
- |
37.43 |
| Lime juice |
- |
- |
- |
19.61 |
- |
- |
- |
19.61 |
| Orange juice |
3.17 |
- |
- |
37.63 |
6.14 |
1.08 |
- |
48.02 |
| Pummelo juice |
- |
- |
- |
8.48 |
- |
- |
- |
8.48 |
| Red raspberry juice |
- |
- |
- |
- |
- |
9.58 |
- |
9.58 |
| Rowanberry |
- |
- |
- |
- |
- |
7.04 |
- |
7.04 |
| Drupe Juices |
| Plum juice |
- |
5.85 |
24.7 |
- |
- |
- |
- |
30.55 |
| Pome Juices |
| Apple juice |
- |
4.39 |
48.45 |
- |
- |
2.15 |
- |
54.99 |
| Apple (cider) juice |
- |
4.78 |
22.66 |
- |
- |
- |
- |
27.44 |
| Pear juice |
- |
- |
3.24 |
- |
- |
- |
- |
3.24 |
| Tropical Juices |
| Kiwi juice |
- |
- |
0.38 |
- |
- |
0.09 |
- |
0.47 |
| Pomegranate juice |
10.13 |
0.1 |
- |
- |
- |
0.25 |
- |
10.48 |
| Herb Infusions |
| German chamomile, tea |
- |
- |
2.07 |
- |
- |
- |
- |
2.07 |
| Lemon verbena |
- |
- |
10.6 |
- |
- |
- |
- |
10.6 |
| Peppermint, tea |
- |
- |
10.23 |
- |
- |
- |
- |
10.23 |
| Tea Infusion |
| Fennel tea |
- |
- |
- |
- |
- |
3.26 |
- |
3.26 |
| Black tea |
- |
- |
73.29 |
- |
- |
10.06 |
- |
83.35 |
| Green tea |
- |
- |
71.18 |
- |
- |
6.26 |
- |
77.44 |
| Oolong tea |
- |
- |
35.72 |
- |
- |
- |
- |
35.72 |
| Soy Products |
| Soy milk |
- |
- |
- |
- |
- |
- |
18 |
18 |
Table 8. Flavonoid contents of alcoholic beverages (mg/100 g drink and mg/100 mL wine)
[21].
| Alcoholic Beverages |
ANT |
DYC |
DYF |
FVA |
FNE |
FVE |
FVO |
IFA |
Total |
| Beer |
| Beer (alcohol free) |
- |
0.0003 |
- |
0.11 |
0.01 |
- |
- |
- |
0.12 |
| Beer (ale) |
- |
0.01 |
- |
0.38 |
0.24 |
- |
- |
0.02 |
0.65 |
| Beer (dark) |
- |
0.03 |
- |
0.03 |
0.15 |
- |
- |
- |
0.21 |
| Beer (regular) |
- |
0.001 |
- |
0.61 |
0.04 |
0.004 |
0.09 |
0.02 |
0.77 |
| Wines |
| Red wine |
23.3 |
- |
5.44 |
47.02 |
0.85 |
- |
7.35 |
- |
83.96 |
| Rosé wine |
- |
- |
0.38 |
2 |
- |
- |
- |
- |
2.38 |
| White wine |
0.04 |
- |
0.57 |
2.07 |
0.23 |
- |
0.695 |
- |
3.61 |
Therefore, a diet rich in fruits, vegetables, seeds, and cereals will provide large amounts of flavonoids. However, it is important to know that there are some foods which contain high quantities of flavonoids, including berries, black olives, spinach, onions, soy products, cocoa, whole grain cereals, tea infusions, and red wine.
3. Pharmacokinetics
In order to determine the biological activity and physiological functions of flavonoids in vivo, their bioavailability must be known. Hence, it is necessary to understand the processes of absorption, digestion, metabolism, and excretion in the digestive tract.
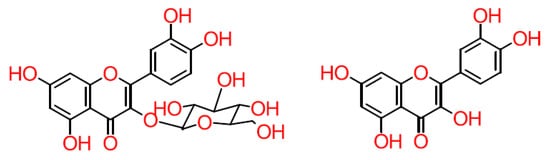
Although dietary flavonoids are mostly found in their glucoside form (
Figure 3), they are not found in plasma
[39][40] because, once flavonoids enter the oral cavity, they begin to be hydrolysed
[39]. In addition, their absorption throughout the digestive tract is associated with the hydrolysing activity of different enzymes
[41]. In the small intestine, deglycosylation occurs in which two enzymes that act as β-glucosidases are involved: lactase-phlorizin hydrolase (LPH) and cytosolic β-glucosidase (CBG), which are located in the brush border of epithelial cells and enterocytes, respectively
[39][42]. Flavonoid-O-β-D-glucosides, for which LPH has high specificity, can enter into cells by passive diffusion. However, glucosides enter enterocytes via sodium-glucose co-transporter type 1 (SGLT1))
[39][41][43]. Although β-glucosidases cannot hydrolyse non-monoglucosidic glycosides, gut microbiota compensate for this through the production of absorbable aglycon in the large intestine and cecum (
Figure 3)
[39].
Figure 3. Structure of glycoside and aglycone flavonoids.
Once flavonoids and aglycons are absorbed via the small and the large intestine, respectively, the second phase of enzymatic metabolism begins
[39][41]. In this stage, three types of enzymes are involved (uridine-5ʹ-diphosphate-glucuronosyltransferases, sulfotransferases, and catechol-O-methyltransferases) that can conjugate flavonoids with glucuronic acid, sulphate, and methyl groups, making them more water-soluble
[13][44]. This phase begins in the wall of the small intestine where metabolites pass to the portal vein and are transported to the liver. In the liver, metabolites are conjugated by sulphation and methylation processes
[39]. In the systemic circulation and urine, there are different chemical forms of flavonoids. However, in human plasma, aglycons are rarely detected
[39][45][46][47]. Certain plasmatic metabolites are usually excreted into the intestine through bile, and here, they are deconjugated by microbiota and reabsorbed
[39][48]. Thus, enterohepatic circulation increases the half-life of flavonoids in human plasma
[37].
The gut microbiome plays a main role in the metabolism and absorption of flavonoids. However, these processes could be modified due to flavonoids interaction with other nutrients
[49][50]. Among them, flavonoids could alter glucose absorption after high carbohydrate food intake, because inhibit carbohydrate-hydrolyzing enzymes (α-amylase and α-glucosidase)
[51]. Besides, flavonoids inhibit glucose transporter in the brush border
[51]. However, flavonoid bioavailability is modified with fats intake that improves flavonoid intestinal absorption due to the increment of bile salts secretion which enhances micellar incorporation of flavonoids
[51]. However, regarding proteins intake, flavonoid bioavailability became worse
[52]. It has been demonstrated that the interaction of phenolic acids with proteins affects antioxidant efficacy and protein digestibility
[53].
Depending on the type of flavonoid and its source, bioavailability may differ. Quercetin is one of the most frequently consumed flavonoids (the main sources of quercetin are onions, apples, tea, and wine), being mainly found in its glycosylated form
[13]. For example, quercetin glycosides from apples have lower bioavailability than those from onions
[13][54]. The plasma levels of quercetin metabolites range from 0.7 to 7.6 µM
[13].
Other studies have analysed the levels of flavonoids in human plasma after the intake of flavonoid-rich foods
[13]. They could be grouped according to the flavonoid subclass. Flavonols present in apples, onions, and buckwheat tea are found after intake at plasma levels of 0.30 µM, 0.74–7.60 µM, and 2.10 µM, respectively
[13][54]. For flavanols in red wine, black tea, green tea, and cocoa, the plasmatic concentration after intake is around 0.08 µM, 0.09–0.34 µM, 1.00–1.80 µM, and 4.92–5.92 µM, respectively
[13][55][56][57]. The base plasma levels of flavanones in orange juice and grapefruit juice are around 0.06–0.64 µM and 5.99 µM, respectively, after intake
[58]. Finally, the plasma levels of anthocyanidins after consuming red wine, elderberry extract, and blackcurrant juice are around 0.01 µM, 0.10 µM, and 0.11 µM, respectively
[13][58][59].
The highest concentration of plasma flavonoids in humans usually occurs 1 to 2 h after the consumption of flavonoid-rich foods
[33]. However, the level depends on the type of flavonoid, as anthocyanins and catechins have a half-life elimination that is 5 to 10 times less than that of flavonols
[52]. Although data on the concentration of flavonoids in human tissue are scarce, flavonoids have been shown to play an important role in antioxidant defence in both cells and tissues
[13].
 +1 credit