Ecosystem services refer to the natural resources and commodities comprising natural ecosystems, which can be directly used or consumed by humans, and maintain the environmental conditions for human survival and development. These services are the resource and environmental basis for human survival and development. For a long time, people’s lack of understanding of the importance of ecosystem services has caused many problems to excessive use of natural resources and affected regional and even global ecological security. Regional ecological and environmental problems are mainly derived from changes in urbanization and land cover changes to the structure and pattern of regional ecosystems. Human activities directly affect changes in ecosystem services and are an important driving force for changes in ecosystem services. Regional ecological and environmental problems are essentially the spatial difference or imbalance between the supply and demand of regional ecosystem services. With the rapid growth of population and intensification of human activities, human demand for ecosystem services is increasing, such as food and water. Meanwhile, the sustainable supply of ecosystem services is under threat. For example, river drying can cause water shortage, the deficiency of an air purification service in an urban area directly affects the health of citizens and soil erosion also can cause a series of ecological problems, which may intensify ecosystem service supply–demand risks. In this paper, ecosystem service supply–demand risks were defined as the possibility that the supply level of ecosystem services was insufficient to meet the local human needs, or the supply level decreased within a set time range. In human production and life, when the consumption of ecosystem service exceeds the threshold of ecosystem service supply, and the ecosystem services supply cannot meet the human demand, the ecosystem service is exposed to risks. Therefore, measuring the relationship between the supply and demand of ecosystem services and identifying the supply–demand risk is particularly important for the effective allocation of natural resources and the management of ecosystem services. Identification of ecosystem service supply–demand risk also has important practical significance for alleviating the contradiction between man and land and improving regional sustainable development.
1. Introduction
At present, the evaluation indicators of ecosystem service supply mostly select biophysical indicators, while those of ecosystem service demand select indicators of consumption, preference, or perception type
[1][2]. Some studies
[3][4] have attempted to establish a systematic evaluation system for the supply and demand of ecosystem services, but the regional differences yield to weak scalability. The establishment of ecosystem service supply and demand indicators should consider regional local characteristics and differences. The comprehensive assessment results of supply and demand of ecosystem services have been applied to many aspects, including the analysis of profit and loss of supply and demand of regional ecosystem services
[5][6][7][4][8][9][10][11], the analysis of ecosystem security patterns
[12][13], the diagnosis of ecosystem health
[14], the payment of ecosystem services
[15][16], the identification of the ecological source or ecologically important land
[13][17], and landscape planning
[18][19][20][21]. However, the application of the current comprehensive assessment results of the supply and demand of ecosystem services is still limited mainly because many studies are too simplistic to assess the needs of ecosystem services, such as spatialization of demands based solely on socioeconomic
[12][22] or night lighting data
[23]. At present, the models and methods for the spatialization of ecosystem services supply and demand mostly include land use estimation
[24][25], expert inspection and discrimination
[26][27], data space overlap
[28][29], ecological process simulation
[30], and ARIES (artificial intelligence for ecosystem services)
[31] and InVEST (integrate valuation of ecosystem services and tradeoffs) models
[32][33]. Separate quantitative results of the supply and demand of ecosystem services cannot meet the decision-making needs despite the continuously deepening research on ecosystem services. Thus, integrating multiple models and methods to correlate the supply and demand of ecosystem services is urgent. Linking the supply and demand of ecosystem services and identifying the relationship between ecosystem service supply–demand levels and risk levels is an important challenge for sustainable scientific research. Such research results are conducive to the concrete implementation of ecological management policies. In this context, the risk analysis of the supply and demand of ecosystem services has attracted attention, and related research has become an international hotspot. The supply and demand status of ecosystem services can be identified by quantifying the degree of ecosystem service supply–demand risk and discussing the matching of supply and demand at different times and space scales. From the perspective of literature search
[34][35][36], studies on the supply–demand risks of ecosystem services, which focus on theoretical discussions, are limited. In addition, most of the risk assessment studies on ecosystem services mainly use service supply as a measurement indicator
[37]. The practice and application of regional-scale ecosystem service supply–demand risk assessment must be further developed
[38].
2. Analysis on Results
2.1. Spatial-Temporal Changes in the Ecosystem Service Supply and Demand
2.1.1. Water Yield Supply and Demand
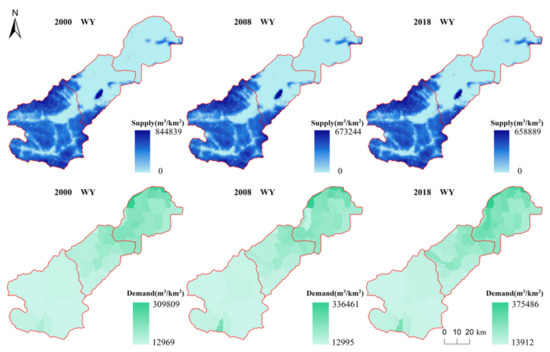
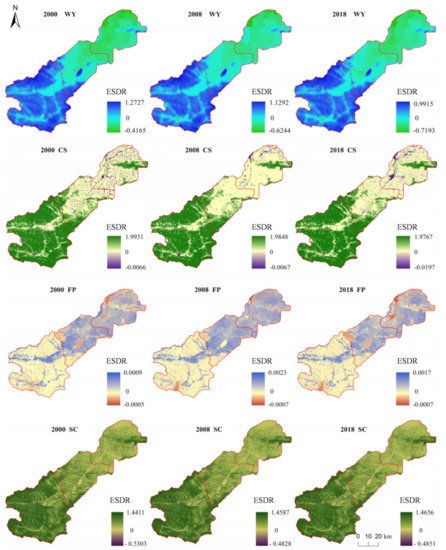
The spatial pattern of water yield supply capacity is high in the southwest and low in the northeast, and the upstream water production supply capacity is strong in our site (Figure 1). The water yield supply is consistent with the distribution of lakes and other water bodies. The total water yield of our site from 2000 to 2018 decreased from 1071 hm3/a in 2000 to 902 hm3/a in 2018, demonstrating a reduction of 15.78%. However, the annual water output in 2018 increased by only 2.85% compared with that in 2008, first decreasing and then increasing in the segment. Meanwhile, the total annual water output in our site from 2000 to 2018 decreased overall (Table 1). In the same year, the water yield of the Yihe River Basin showed a large difference in space, with the unit water yield of upstream > middle stream > downstream in the basin. From 2000 to 2008, the water yield in the upper, middle, and downstream reaches respectively decreased by 17.76%, 20.61%, and 20.61%. The water yield in the upper, middle, and lower reaches decreased from 2000 to 2008, and the reduction in the upper reaches was small. From 2008 to 2018, the upper, middle, and lower reaches showed a slow upward trend, of which the downstream water yield had a large increase of 6.31%, and the upper and middle reaches of the increase were 2.33% and 5.92%, respectively.
Figure 1. Spatial distribution of water yield supply and demand in the Yihe River Basin in 2000, 2008, and 2018. WY: water yield (the same below).
Table 1. Total supply and demand of water yield and changes in different years (hm3/a).
| Water Yield |
2000 |
2008 |
2018 |
CR2000–2008 |
CR2008–2018 |
CR2000–2018 |
| Total supply |
1071 |
877 |
902 |
−18.11% |
2.85% |
−15.78% |
| Total demand |
432 |
431 |
577 |
−0.23% |
33.87% |
33.56% |
The distribution of water yield demand (Figure 1) reveals the spatial pattern of water yield demand in the Yihe River Basin from 2000 to 2018. Overall, the demand for water yield in the northeast and southwest was respectively high and low, and the downstream area had a large demand for water yield. Water demand dropped slowly from 432 hm3/a in 2000 to 431 hm3/a in 2008, but that in 2018 increased by 33.56% compared with 2000, showing a trend of first decreasing and then increasing in the section. The total water demand of our site increased from 2000 to 2018 overall (Table 1). In the same year, the water demand of our site showed a large difference in space, the unit water demand of the basin was opposite to the water yield, and the downstream water demand was the largest. Except for a slight decrease in the downstream, water demand in other regions slightly increased during 2000–2008. The water demand from 2000 to 2018 in the upper, middle, and lower reaches increased to varying degrees, and the midstream demand increased by a maximum of 38.56%. The upstream and downstream water demands increased by 31.61% and 31.77%, respectively.
2.1.2. Carbon Sequestration Supply and Demand
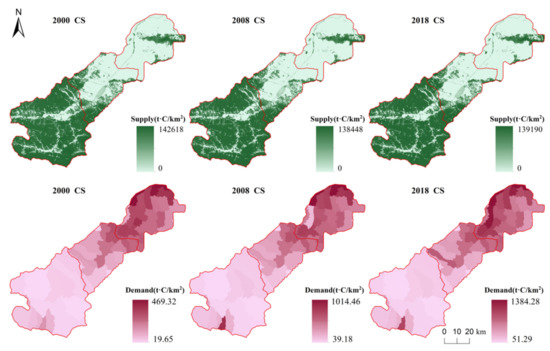
The supply of carbon sequestration in our site showed a spatially decreasing trend from southwest to northeast from 2000 to 2018, and high-value areas were found in the northeast of the river basin (
Figure 2). The supply of carbon sequestration mainly comes from vegetation and soil
[39][40]. The high values of carbon sequestration were mostly concentrated in Luanchuan. The vegetation coverage in these areas was high, and the area of forest land is large. The vegetation types were mainly cork oak, broad miscellaneous and Chinese pine
[41]. The watershed carbon sequestration supply was consistent with the vegetation distribution. The total amount of carbon sequestration supply decreased from 4.10 × 10
8 t·C/a in 2000 to 4.08 × 10
8 t·C/a in 2018. The total supply in 2008 was 3.97 × 10
8 t·C/a; therefore, the change in supply from 2000 to 2018 first decreased and then increased (
Table 2). The total supply of carbon sequestration in the study area decreased by 0.49% from 2000 to 2018.
Figure 2. Spatial distribution of carbon sequestration supply and demand in the Yihe River Basin in 2000, 2008, and 2018. CS: carbon sequestration (the same below).
Table 2. Total supply and demand of carbon sequestration and changes in different years (t·C/a).
| Carbon Sequestration |
2000 |
2008 |
2018 |
CR2000–2008 |
CR2008–2018 |
CR2000–2018 |
| Total Supply |
4.10 × 10⁸ |
3.97 × 10⁸ |
4.08 × 10⁸ |
−3.17% |
2.77% |
−0.49% |
| Total Demand |
7.12 × 10⁵ |
1.63 × 10⁶ |
2.42 × 10⁶ |
128.93% |
48.47% |
239.89% |
The total demand for carbon sequestration increased from 7.12 × 10⁵ t·C/a in 2000 to 1.63 × 10⁶ t·C/a in 2008 and then increased to 2.42 × 10⁶ t·C/a in 2018 (Table 2). The demand for carbon sequestration showed an overall upward trend, and the downstream areas were substantially higher than those in the upper and middle reaches (Figure 2). High values were mainly concentrated in the middle and lower reaches of the basin. The middle and lower reaches were densely populated and highly urbanized, which consumed additional energy, leading to substantial pressure on carbon emission reduction. In addition, the demand for carbon sequestration increased with the development of the middle and lower reaches of the population economy.
2.1.3. Food Production Supply and Demand
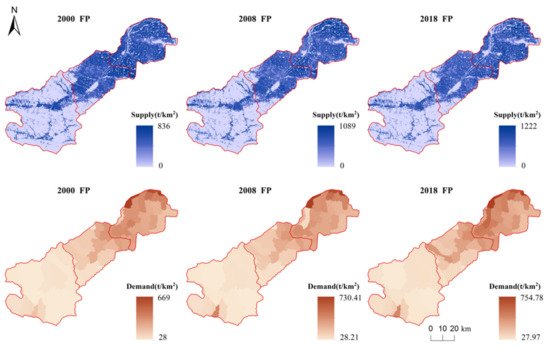
Figure 3 shows that the spatial pattern of food production in our site from 2000 to 2018 was stable, spatially high in the northeast and low in the southwest, and the supply capacity of downstream food production was higher than that in the upper and middle reaches. The supply of food production in our site in 2000 was 15.50 × 10⁸ kg/a, which increased to 21.90 × 10⁸ kg/a in 2018. The value in 2018 decreased by 0.06% compared with that in 2008 (Table 3). The decline in the supply of food production from 2008 to 2018 was mainly caused by the decrease in the cultivated area. In the same year, the supply of food production in the study area were quite different in space. The areas with strong supply capacity were concentrated in the downstream areas, and the supply capacity in the upstream was small. The downstream supply in 2000 and 2018 respectively accounted for 44.29% and 44.30% of the entire study area. The food production and supply level in the watershed were stable in time and space.
Figure 3. Spatial distribution of food production supply and demand in our site in 2000, 2008, and 2018. FP: food production (the same below).
Table 3. Total supply and demand of food production and changes in different years (kg/a).
| Food Production |
2000 |
2008 |
2018 |
CR2000–2008 |
CR2008–2018 |
CR2000–2018 |
| Total Supply |
15.50 × 10⁸ |
22.03 × 10⁸ |
21.90 × 10⁸ |
42.13% |
−0.59% |
41.29% |
| Total Demand |
9.32 × 10⁸ |
9.35 × 10⁸ |
11.60 × 10⁸ |
0.32% |
24.06% |
24.46% |
The spatial distribution of demand for food production in the Yihe River Basin was stable from 2000 to 2018, showing an increasing trend from southwest to northeast. The high values were mainly concentrated in Yanshi and Yichuan (Figure 3). The demand for food production in the Yihe River Basin gradually increased from 9.32 × 10⁸ kg/a in 2000 to 11.60 × 10⁸ kg/a in 2018, and the demand increased by 24.46% (Table 3). In the same year, high-demand areas were concentrated in the middle and lower reaches of the basin, and the upstream demand was small. The demand for food production per unit area of the basin was uneven, but the law was consistent.
2.1.4. Soil Conservation Supply and Demand
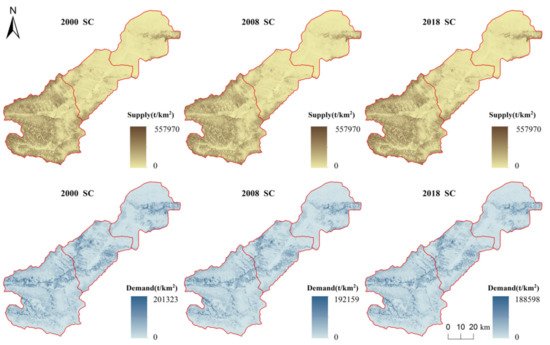
The distribution of soil conservation in our site was stable from 2000 to 2018 and only demonstrated minimal changes (Figure 4). The results of soil conservation supply showed that forest land was the highest, followed by grassland, and water and construction land were low. The supply of soil conservation services changed from 9.47 × 10¹¹ t/a in 2000 to 9.48 × 10¹¹ t/a in 2018, and the amount of soil conservation first decreased and then increased (Table 4). From 2000 to 2008, the areas with a reduced supply of soil conservation were concentrated in the areas with large topographic undulations in the upper reaches of Luanchuan. The areas with an increased supply of soil conservation were mainly the downstream flat areas. The supply of soil conservation in the middle and lower reaches gradually increased from 2008 to 2018, and the supply of Miaozi, Tantou, Taowan, and Shimiao Towns in the upper reaches considerably decreased. Most of the high values of soil conservation supply in the Yihe River Basin were concentrated in the upper reaches. The upstream forest land resources were rich, the soil structure was good, and the disturbance of upstream human activities was small, which can account for the high amount of soil conservation in the upper reaches. However, the amount of soil conservation in cultivated land, construction land, and water areas, which were located in the middle and lower reaches of the region, was low. The terrain was flat; therefore, the amount of soil conservation was small.
Figure 4. Spatial distribution of soil conservation supply and demand in our site in 2000, 2008, and 2018. SC: soil conservation (the same below).
Table 4. Total supply and demand of soil conservation and changes in different years (t/a).
| Soil Conservation |
2000 |
2008 |
2018 |
CR2000–2008 |
CR2008–2018 |
CR2000–2018 |
| Total Supply |
9.47 × 10¹¹ |
9.46 × 10¹¹ |
9.48 × 10¹¹ |
−0.11% |
0.21% |
0.11% |
| Total Demand |
5.33 × 10⁹ |
5.52 × 10⁹ |
5.37 × 10⁹ |
3.56% |
−2.72% |
0.75% |
The total demand for soil conservation in 2000 was 5.33 × 10⁹ t/a, which changed to 5.37 × 10⁹ t/a in 2018. The demand increased first and then decreased (Table 4). The area where demand for soil conservation increased accounted for 30.65%, and the decreased area was 34.67% from 2000 to 2008. From 2008 to 2018, the area with increased demand for soil conservation was 19.93%, and the decreased area was 34.77%. This finding indicates a slight decrease in the soil conservation demand of the watershed in recent years. The demand for soil conservation in our site showed spatial differences from 2000 to 2018. The areas with high demand for soil conservation were mainly on both sides of the river in the upper and middle reaches and parts of the northeast of the lower reaches (Figure 4). The large difference in the spatial distribution of the demand for soil conservation is mainly due to the slope of the terrain. Areas with large terrain undulations had substantial soil erosion, and high demand for soil conservation. In addition, the areas with high demand were mostly at the junction of different land types. Meanwhile, the areas with poor vegetation coverage, broken terrain, and low demand for soil conservation were mainly concentrated in the lower reaches primarily due to the flat terrain in the lower reaches and the existence of several construction land.
2.2. Supply and Demand Matching of Ecosystem Services
2.2.1. Supply and Demand Matching of Individual Ecosystem Services
The water yield supply–demand ratio of the Yihe River Basin from 2000 to 2018 maintained high and low spatial patterns in the southwest and northeast, respectively (Figure 5). The upstream maintained a high level of supply–demand ratio. Affected by nature and society, the demand for water in the middle and lower reaches was larger than the supply of water yield, which is in a state of water shortage, and the scope of the deficit increased. The middle and lower reaches of the water demand cannot be met. The regional differentiation was serious, and the supply distribution was uncoordinated, causing the gradual increase in deficits in the downstream.
Figure 5. Spatial distribution of the four ESDR in our site from 2000 to 2018 (ESDR: ecosystem service supply–demand ratio).
The supply of carbon sequestration in our site was far larger than the demand (Table 2). The matching status of supply and demand in 2000, 2008, and 2018 is shown in Figure 4. From the spatial distribution viewpoint, the upstream supply and demand matched well in each year. The area of mismatch between supply and demand in 2000 and 2018 was larger than that in 2008. The area where supply exceeded demand was 94.97% in 2008. The supply–demand matching of carbon sequestration markedly improved in 2018 compared with that in 2000. Overall, the supply of carbon sequestration was high in the areas with dense vegetation, and the mismatch areas were mostly in the areas with rapid urbanization process and the two sides of the Yihe River Basin.
The spatial pattern of the supply–demand ratio of food production from 2000 to 2018 was lower in the southwest region than in the northeast during the study period, the supply in the middle and lower reaches was larger than the demand, and the supply in the upper reaches was insufficient (Figure 5). The supply in the study area met the demand during the study period, and the supply level was the highest in 2008. The supply–demand ratio of food production in our site fluctuated around a value of zero, and the degree of matching between supply and demand was good, which is close to a balanced state.
The supply–demand ratio of soil conservation was generally at a high level from 2000 to 2018, with the highest in the southwest of the river basin (Figure 5). The area with a deficit in soil conservation accounted for a small proportion of the total area, and the supply and demand of soil conservation in our site maintained a high matching level.
2.2.2. Supply and Demand Matching of Comprehensive Ecosystem Services
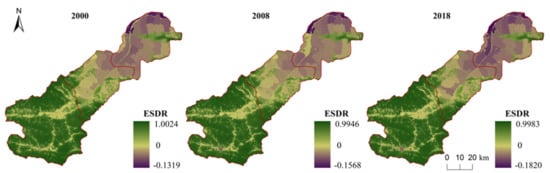
Figure 6 and Table 5 show the comprehensive supply–demand ratio of the four ecosystem services in our site from 2000 to 2018. The comprehensive supply–demand situation of ecosystem services in the entire river basin shows that supply exceeded demand, and the comprehensive supply–demand ratio gradually decreased from 2000 to 2018. The difference between supply and demand matching was observed in the same year, the upstream comprehensive net supply value was the highest, and the middle and downstream comprehensive net supply values were low. The comprehensive supply–demand ratio of upstream ecosystem services increased during the study period, but the comprehensive supply–demand ratio of mid and downstream ecosystem services decreased. The increase in demand in the middle and lower reaches led to a worsening of their deficits, reflecting the gap in social and economic development in different regions of the river basin.
Figure 6. Comprehensive supply–demand ratio of four ecosystem services in our site from 2000 to 2018 (ESDR: ecosystem service supply–demand ratio).
Table 5. Average value of comprehensive supply–demand ratio of four ecosystem services in our site.
| Year |
Entire Basin |
Upstream |
Midstream |
Downstream |
| 2000 |
0.2937 |
0.5207 |
0.1585 |
0.0120 |
| 2008 |
0.2825 |
0.5095 |
0.1461 |
0.0011 |
| 2018 |
0.2771 |
0.5134 |
0.1401 |
−0.0208 |
2.3. Supply–Demand Risks of Four Ecosystem Services
2.3.1. Supply–Demand Risks at the Grid-Scale
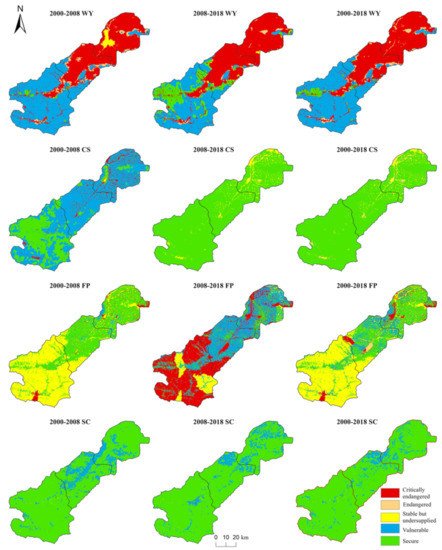
The supply–demand risk levels of various ecosystem services in the three periods of 2000–2008, 2008–2018, and 2000–2018 in the Yihe River Basin are obtained by combining the three indicators of supply–demand ratio, supply–demand ratio trend, and supply trend (Figure 7). Water yield was mainly vulnerable and critically endangered from 2000 to 2018, with high-risk and low-risk grades accounting for 50.02% and 49.98%, respectively. Low-risk grades were concentrated upstream, while high-risk areas were concentrated in the middle and lower reaches. The proportions of high-risk and low-risk grades of water yield in 2000–2008 and 2008–2018 were 49.64%, 50.36%, 50.02%, and 49.98%, indicating the slight increase in the supply–demand risks of water yield.
Figure 7. Grid-scale spatial distribution of the supply and demand risks of the four ecosystem services in our site. High-risk levels include critically endangered, endangered, and stable but undersupplied, while low-risk levels include vulnerable and secure.
The carbon sequestration was mainly at a secure level from 2000 to 2018, and the proportions of high-risk and low-risk levels were 6.39% and 93.61%, respectively. The proportion of high-risk and low-risk grades in 2008–2018 is the same as that in 2000–2018. However, the proportion of undersupplied grades in high-risk areas is higher than that in 2000–2018, while that of endangered grades in 2000–2018 is higher than that in 2008–2018. The carbon sequestration was mainly based on vulnerable and secure levels from 2000 to 2008, with high-risk and low-risk levels accounting for 5.03% and 94.97%, respectively. The overall supply–demand risk of carbon sequestration in the basin was low, but the high-risk area of carbon sequestration slightly increased in recent years.
The food production from 2000 to 2018 was mainly secure but insufficiently supplied, with high-risk and low-risk grades accounting for 52.68% and 47.32%, respectively. Low-risk grades were concentrated in the midstream and downstream, and high-risk areas were concentrated upstream. The proportions of high-risk and low-risk levels in 2000–2008 and 2008–2018 were 50.15%, 49.85%, 52.61%, and 47.39%. The supply–demand risk of food production increased from 2008 to 2018, and the secure level was transformed into a vulnerable level.
The supply–demand risks of soil conservation mainly demonstrated secure levels from 2000 to 2018. The proportions of high-risk and low-risk levels were 0.44% and 99.56%, respectively. Meanwhile, the proportions of high-risk and low-risk levels in 2000–2008 and 2008–2018 were 0.54%, 99.46%, 0.44%, and 99.56%, indicating that the soil conservation risk level was stable and improved in 2008–2018.
2.3.2. Supply–Demand Risks at the Sub-Basin Scale
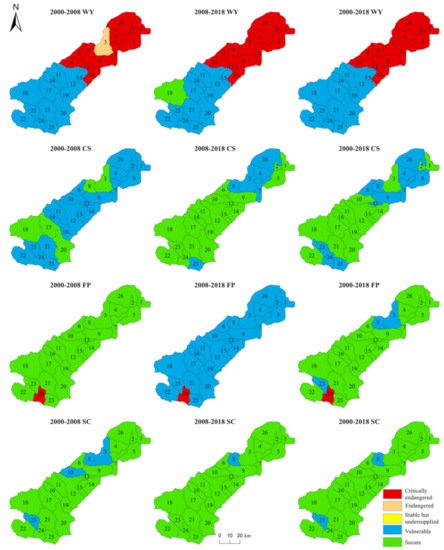
Considering the fluidity of ecosystem services, this study used sub-basin as a unit to express the supply–demand risk status of ecosystem services in our site (Figure 8). The supply–demand risks of water yield in the sub-basin from 2000 to 2018 were mainly critically endangered and vulnerable, and the number of high-risk and low-risk sub-basins each accounted for 50%. Considering periods, the water yield supply–demand risk of the Sub-Basin 3 changed from an endangered to a critically endangered level, and the sub-basin 18 changed from vulnerable to secure level. The supply–demand risks of carbon sequestration in the sub-watershed from 2000 to 2018 were mainly safe and vulnerable levels. The supply–demand risks of carbon sequestration in different periods were in a low-risk state and the supply could meet the needs of human carbon emissions. The food production supply–demand risk levels from 2000 to 2018, except for the Sub-Basin 24, were all low-risk levels, of which Sub-Basins 3, 8, and 23 were vulnerable, and the rest were secure levels. The supply–demand risk level of food production in 2008–2018 worsened compared with that in 2000–2008, and the secure level transformed to a vulnerable level. The supply–demand risks of soil conservation in the sub-basins were low risk at different times from 2000 to 2018, and the safety level demonstrated the most risk grade. Overall, the supply–demand risks of the Sub-Basins 3 and 10 gradually improved.
Figure 8. Spatial distribution of the supply–demand risks of the four-ecosystem service in the sub-basin. High-risk levels include critically endangered, endangered, and stable but undersupplied, while low-risk levels include vulnerable and secure.
2.3.3. Supply–Demand Risks in the Entire Basin
The supply–demand risks of ecosystem services can be determined in accordance with the supply trend, supply–demand ratio, and supply–demand ratio trend of ecosystem services in the entire river basin from 2000 to 2018 (Table 6). On the scale of the entire river basin, the supply–demand risk levels of the four ecosystem services were slightly consistent. The supply–demand risk levels of water yield, carbon sequestration, and soil conservation were vulnerable, but the food production supply–demand risk level was secure.
Table 6. Supply trend, supply–demand ratio, and supply–demand ratio trend of the four ecosystem services in the Yihe River Basin from 2000 to 2018.
| Reference Indicators |
WY |
CS |
FP |
SC |
| R |
>0 |
>0 |
>0 |
>0 |
| Rt |
<0 |
<0 |
>0 |
<0 |
| St |
<0 |
<0 |
>0 |
>0 |
2.4. Spatial Management Zoning Based on Ecosystem Service Supply–Demand Risks
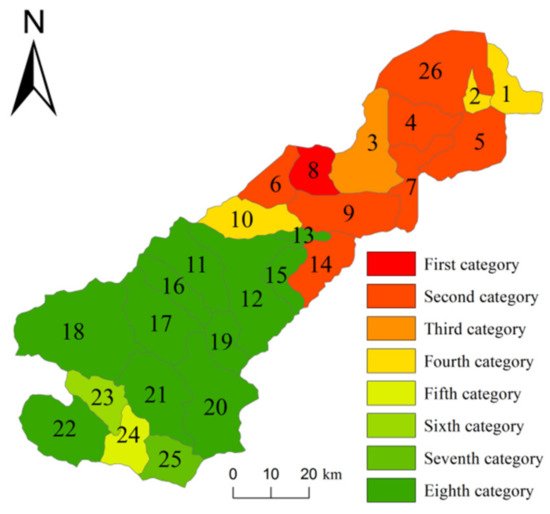
By using spatial overlay analysis on four ecosystem services supply–demand risk levels in sub-basin scale from 2000 to 2018, the eight supply–demand risk management zones of the Yihe River Basin were obtained (Figure 9). The first category is Sub-Basin 8, where the water yield was critically endangered, and the three other services were at the vulnerable level. The second category includes Sub-Basins 4, 5, 6, 7, 9, 13, and 26, where water yield was critically endangered, and the three other services were at the vulnerable level. The third category is the Sub-Basin 3, wherein the water yield was critically endangered, the food production was vulnerable, and the two other services were at a secure level. The fourth category includes Sub-Basins 1, 2, 10, and 14, where water yield was critically endangered, and the three other services were at the secure level. The fifth category is Sub-Basin 24, wherein the food production was critically endangered, the water yield and carbon sequestration were vulnerable, and the soil conservation was at a secure level. The sixth category is Sub-Basin 23, wherein the four services were at the vulnerable level. The seventh category is Sub-Basin 25, which refers to water yield and food production as the vulnerable levels, and the rest were secure levels. The eighth category includes Sub-Basins 11, 12, 15, 16, 17, 18, 19, 20, 21, and 22, wherein water yield was vulnerable, and the three other services were at the secure level.
Figure 9. Supply–demand risk spatial management division of ecosystem services in the Yihe River Basin. The first category is the WY critically endangered and CS-FP-SC vulnerable zone. The second category is the WY critically endangered and CS vulnerable zone. The third category is the WY critically endangered and FP vulnerable zone. The fourth category is the WY critically endangered zone. The fifth category is the FP critically endangered and WY-CS vulnerable zone. The sixth category is the WY-CS-FP-SC vulnerable zone. The seventh category is the WY-FP vulnerable zone. The eighth category is the WY vulnerable zone.
3. Current Insights
3.1. Framework of Supply–Demand Risks Evaluation System of Ecosystem Services
The risks of ecosystem services to human beings, the degree of risks, and the available trends need to be determined to provide a strong basis for ecosystem service risk management and related policy formulation. Some conceptual models, such as the EPPS (ecosystem properties, potentials, services, and benefits) framework
[42], the delivery chain of ecosystem services
[43], and the comprehensive assessment framework for the ecosystem service supply and demand
[2][44][45], are created to view the supplier and demand sides of integrated ecosystem services. These conceptual models provide a theoretical and practical basis for the research on the supply–demand risks of ecosystem services. The assessment of the supply–demand risks aim to link the supply–demand relationships and the risks of ecosystem services. Following this, we can divide the degree of risk faced by ecosystem services from the risk perspective and this provides a new viewpoint for the management of ecosystem services. Research on ecosystem service risks has received widespread attention in recent years. One focused on risk assessment based on the supply of ecosystem services, and the degree of reduction in supply is used as the basis for risk division. The other is based on the evaluation of the supply–demand relationship of ecosystem services, emphasizing the matching degree between supply and demand. The former is too simplistic and lacks consideration of human needs, complicating the use of research results in actual management. By contrast, the latter lacks practical case studies due to the difficulty in identifying the demand for ecosystem service. Our research constructed a framework to identify the supply–demand risk levels by analyzing the three indicators of supply–demand ratio, supply–demand ratio trend, and supply trend based on the quantification of the supply and demand of ecosystem services. The framework of ecosystem service supply–demand risks evaluation system is conducive to examining the change in time series and regional consumption of natural resources and the spatiotemporal evolution characteristics of ecosystem service supply–demand risks. The identification of the supply–demand risks of ecosystem services is also conducive to an overall grasp of the supply and demand status of regional ecosystem services and rational investment of limited resources into different risk zones to promote the sustainable development of regional ecosystems.
Based on the framework of supply–demand risks evaluation system, the ecosystem service supply–demand risk models were employed to assess the supply–demand risk levels of four services in the Yihe River Basin, including water yield, carbon sequestration, food production, and soil conservation. The spatial heterogeneity of the study area is strong. The upper reaches are mountainous areas with abundant forest resources, the middle reaches are loess hilly areas with abundant resources, and the lower reaches are plain areas, which are the main grain-producing areas. Dividing the supply–demand risk levels of ecosystem services in the river basin is conducive to the management of ecosystem services and the targeted implementation of policies. Moreover, the study integrated the supply–demand risk levels of four services on the scale of sub-basin for spatial management zoning of risks. The risk management zoning of the Yihe River Basin can identify the ecological and economic development problems faced by different river basins. Some Sub-Basins, such as the Sub-Basins 1, 2, 10, and 14, only face water shortages. However, some sub-basins encountered many ecological and environmental problems. For example, Sub-Basin 24 is facing the risk of food shortages and insufficient water resources. Therefore, the risk management division of the supply and demand of ecosystem services is helpful to the effective management of ecosystem services in a river basin.
3.2. Factors Affecting Supply–Demand Risks of Ecosystem Services
The factors affecting the supply–demand risks of ecosystem services in the Yihe River Basin involve natural ecosystems and socio-economic systems, including natural and socio-economic factors
[2]. The supply and demand of the river basin show temporal and spatial heterogeneity due to natural and socio-economic factors. The difference of service types and the total amount in different times and geographical locations leads to considerable temporal and spatial effects of supply–demand risks. The upstream ecological background resources were satisfactory, and the water yield, carbon sequestration, and soil conservation supply levels were high because of the influence of the differences in the natural ecological characteristics of the basin. The downstream terrain was flat, and only the food production supply level was high. However, the demand for most ecosystem services in the downstream were high because of the high population density. For example, the supply–demand risk factors of water yield and carbon sequestration were mainly the natural ecological environment and population. The upstream mountainous areas were rich in water and forest resources, while the downstream plains were densely populated with large amounts of water consumptions and carbon emissions, resulting in uneven distribution of water yield and carbon sequestration supply and demand. Under the combined influence of the two factors, the supply–demand risk of water yield in almost all downstream sub-basins was critically endangered, and the supply–demand risk of carbon sequestration in most downstream sub-basins was vulnerable.
Changes in the supply–demand risks of ecosystem services at different time nodes are mainly affected by the human socio-economic system. The socio-economic system changes more drastically than the natural ecosystem on a short time scale
[44]. Therefore, the demand-side drivers of ecosystem services (such as population growth and economic development) may have a larger impact on service supply–demand risks than supply-side drivers. For example, the increase in food production supply will be affected by social and economic factors, such as agricultural chemical inputs, a series of policies to benefit agriculture and agricultural science and technology innovation. Moreover, the demand for food production will be affected by the increase in population. Food production is strongly affected by the former; therefore, the supply–demand risks faced by food production have slightly improved in recent years. In addition, the supply level of soil conservation will also increase with the strengthening of ecological protection awareness and the impact of human ecological protection projects and policy implementation. Therefore, the supply–demand risks faced by soil conservation were also improved in some sub-basins in recent years.
3.3. Policy Enlightenment
Management divisions based on the supply–demand risks of multiple ecosystem services can reflect the risk levels of supply and demand of multiple ecosystem services. The risk level of supply and demand of ecosystem services in each sub-basin can be identified on the basis of the risk management zone, and the region can be guided to realize the rational allocation of resources. Based on eight risk management zones and characteristics of four ecosystem services supply–demand risk, we propose three guidelines of ecosystem services optimization in our site. The optimization suggestions help to realize the reasonable spatial allocation of resources between supply–demand risk zones through ecosystem service flow.
The sixth, seventh, and eight types of risk zones are core protected areas and the key to this is ecosystem conservation. Considering the Yihe River Basin, the supply and demand risks of the four ecosystem services in the three types of regions are all at a low-risk level and do not require many control measures. However, most of these areas are concentrated in upstream, which is an important ecological function area in the watershed. Therefore, monitoring water yield, carbon sequestration, and soil conservation, grasping the dynamic trend of the supply of different services, and strictly preventing their degradation are necessary. In addition, the conservation of water and forest resources should be emphasized. The habitat conditions in the upper reaches have a direct impact on the ecosystem services in the middle and lower reaches.
The fifth category of risk zone is the food production promotion area, and the key is development agriculture. Except for food production, ecosystem services in the fifth category of areas are at a low-risk level. In this category, focusing on changes in the supply level of food production, strengthening the integrated innovation of agricultural science and technology and the development of benefit farming policy, promoting the growth of food production in the region are necessary to reduce the supply–demand risk level of food production.
The first to fourth types of risk zones are water recharge promotion area and face the high risk of water shortages. The water resources are in short supply, and the supply–demand risk of water yield is high. From a spatial viewpoint, these areas mainly located in the middle and lower reaches, with convenient transportation and high population density. The intensity of urban development in each sub-basin is higher than that in the upstream sub-basin. Preventing excessive waste of water resources is necessary for the urbanization process. Areas with a high-risk level of water yield must form a sound water-saving policy, regulation, and standard system, raise people’s awareness of water-saving, adjust water prices in a timely and appropriate manner, and increase the repetition rate of water resources and the rate of ecological benefits. Moreover, water yield service supply–demand risk can be spatially regulated in the form of ecosystem service flow.
 +1 credit