Your browser does not fully support modern features. Please upgrade for a smoother experience.
Submitted Successfully!
 +1 credit
Thank you for your contribution! You can also upload a video entry or images related to this topic.
For video creation, please contact our Academic Video Service.
| Version | Summary | Created by | Modification | Content Size | Created at | Operation |
|---|---|---|---|---|---|---|
| 1 | Yuki Sugiura | + 2730 word(s) | 2730 | 2021-07-09 10:47:03 | | | |
| 2 | Dean Liu | -45 word(s) | 2685 | 2021-07-26 06:08:31 | | |
Video Upload Options
We provide professional Academic Video Service to translate complex research into visually appealing presentations. Would you like to try it?
Cite
If you have any further questions, please contact Encyclopedia Editorial Office.
Sugiura, Y. ITK in TSCC. Encyclopedia. Available online: https://encyclopedia.pub/entry/12389 (accessed on 07 February 2026).
Sugiura Y. ITK in TSCC. Encyclopedia. Available at: https://encyclopedia.pub/entry/12389. Accessed February 07, 2026.
Sugiura, Yuki. "ITK in TSCC" Encyclopedia, https://encyclopedia.pub/entry/12389 (accessed February 07, 2026).
Sugiura, Y. (2021, July 25). ITK in TSCC. In Encyclopedia. https://encyclopedia.pub/entry/12389
Sugiura, Yuki. "ITK in TSCC." Encyclopedia. Web. 25 July, 2021.
Copy Citation
Interleukin-2–inducible T-cell kinase (ITK) is a member of the Tec family of non-receptor tyrosine kinases and is expressed in T-cells and mast cells.
tongue squamous cell carcinoma
IL2-inducible T-cell kinase (ITK)
trifunctional purine biosynthetic protein adenosine-3 (GART)
1. Introduction
A number of molecular-targeted drugs, including kinase-targeted drugs, are used clinically in the treatment of many types of cancer to improve the survival time of patients. However, cetuximab, a monoclonal antibody that blockades the epidermal growth factor receptor (EGFR), is the only kinase-targeted drug available for treating tongue squamous cell carcinoma (TSCC) [1]. Thus, additional therapeutic strategies focused on the inhibition of a wide variety of kinases are needed to treat patients more effectively with TSCC.
Interleukin-2–inducible T-cell kinase (ITK) is a member of the Tec family of non-receptor tyrosine kinases and is expressed in T-cells and mast cells. In T-cells, ITK functions downstream of the T-cell receptor and plays an important role in T-cell activation, development, differentiation, and production of pro-inflammatory cytokines [2]. It was recently reported that ITK gene expression is higher in tumor tissues than in normal tissues and associated with poor prognosis in head and neck cancer [3]. ITK protein expression reportedly increases with nevus to metastatic melanoma progression and is associated with tumor development and progression in melanoma [4]. However, little is known about ITK protein expression and function in almost all types of solid tumors. Trifunctional purine biosynthetic protein adenosine-3 (GART) is an enzyme in the de novo purine biosynthesis pathway. Purine metabolism is reportedly enhanced in proliferating cancer cells [5]. However, the mechanism of the de novo purine biosynthesis pathway through GART in TSCC has not been elucidated in detail.
2. ITK Protein Expression in Patients with TSCC
The expression of ITK protein in patients with TSCC was examined using IHC with an anti-ITK rabbit monoclonal antibody that was purchased from CST (details described in the ‘Methods’ section; antibody clone number Y401). First, we confirmed the specificity of the anti-ITK rabbit monoclonal antibody and observed no cross-reactivity for other molecules of the Tec family. Expression of ITK protein was not observed in normal tongue mucosa adjacent to the tumor (Figure 1A,B), and lymphocytes were stained by the ITK antibody in all 86 patient TSCC tissues on the same pathology sections as the internal controls (Figure 1E,H). Immunofluorescence double staining was performed with anti-CD4 antibody and anti-ITK rabbit monoclonal antibody. ITK-positive CD4+ T-cells were stained with both anti-CD4 antibody and anti-ITK rabbit monoclonal antibody. Of 86 patients with TSCC, 73 (84.9%) were ITK negative (Figure 1C,D), and 13 (15.1%) were ITK positive (Figure 1F,G). The Kaplan–Meier curves showed a statistically significant difference between the ITK-negative and ITK-positive groups in both OS (log-rank trend test P = 0.0129) (Figure 1I) and DFS (log-rank trend test P = 0.0002) (Figure 1J). The correlations between clinical findings and ITK expression pattern are summarized in Table 1. Statistically significant differences were observed between ITK expression and mode of invasion (P = 0.0000), late metastasis of cervical lymph nodes (P = 0.0006), and lymphovascular invasion (P = 0.0101). No statistically significant associations were observed between ITK expression and age, sex, clinical stage, clinical histologic differentiation (poorly/moderately differentiated versus well-differentiated), or perineural invasion (Table 1).
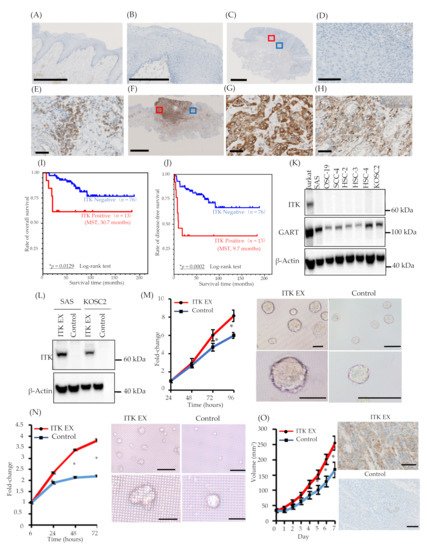
Figure 1. Expression of interleukin-2–inducible T-cell kinase (ITK) in surgically removed tongue squamous cell carcinoma tissue, correlation between ITK expression and prognosis, and proliferation of oral cancer cell lines associated with ITK expression in vitro and in vivo. (A and B) Representative expression of ITK protein in the normal tongue mucosa (bar, 1 mm) (A). (B) shows a magnified image of the normal tongue mucosa (bar, 250 μm). (C–E) Representative images of ITK-negative cases. (B: bar, 2.5 μm; C: bar, 100 μm; D: bar, 50 μm). Red square denotes the part of the cancer lesion image that was magnified (D). Blue square denotes the part of the lymphocyte image that was magnified (E). (F–H) Representative images of ITK-positive cases (E: bar, 5 μm; F and G: bar, 50 μm). Red square denotes the part of the cancer lesion image that was magnified (G). Blue square denotes the part of the lymphocyte image that was magnified (H). (I) OS curves for the ITK-positive (red line, n = 13) and ITK-negative (blue line, n = 76) subgroups (p = 0.0129). (J) DFS curves for the ITK-positive (red line, n = 13) and ITK-negative (blue line, n = 76) subgroups (P = 0.0002). Statistical significance was assessed using the log-rank test. (K) Western blot analysis of ITK and GART expression in oral cancer cells. β-Actin was blotted as a loading mock control. (L) Western blot analysis of ITK expression in two lines of oral cancer cells that stably express ITK (ITK EX) and mock control cells (Control). β-Actin was blotted as a loading control. (M) Proliferation of ITK-expressing SAS cells and mock control cells and representative photographs of ITK-expressing SAS cell spheroids and mock control cell spheroids after 96 hours of culture. Top panels are overall views (bars, 200 μm); bottom panels are magnified images (bars, 200 μm). (N) Proliferation of ITK-expressing KOSC2 cells and mock control cells and representative photographs of ITK-expressing KOSC2 cell spheroids and mock control cell spheroids after 72 hours of culture. Top panels are overall views (bars, 200 μm); bottom panels are magnified images (bars, 50 μm). (O) Tumor volume of ITK-expressing SAS cells and mock control cells in an inoculation model involving subcutaneous injection of SAS cells in nude mice, and immunohistochemistry using an anti-ITK antibody of transplanted ITK-expressing cells and mock control cells in mice (bars, 100 μm). Error bars indicate standard error. * p < 0.01 (Student’s t-test).
Table 1. Association of ITK protein expression with clinicopathologic characteristics in stage I/II tongue squamous cell carcinoma.
| Number of Cases (%) | ITK-Negative | ITK-Positive | p-value a | |
|---|---|---|---|---|
| Total | 86 | 73 | 13 | |
| Age (years) | 0.3655 | |||
| <64 | 43 (50.0) | 38 | 5 | |
| ≥64 | 43 (50.0) | 35 | 8 | |
| Sex | 0.1715 | |||
| Male | 48 (55.8) | 43 | 5 | |
| Female | 38 (44.2) | 30 | 8 | |
| Stage b | 0.9776 | |||
| I | 46 (53.5) | 39 | 7 | |
| II | 40(46.5) | 34 | 6 | |
| Histologic differentiation | 0.1760 | |||
| Poor/Moderate | 25 (29.1) | 18 | 6 | |
| Well | 61 (70.9) | 55 | 7 | |
| Mode of invasion c | 0.0000 * | |||
| 1,2 | 58 (67.4) | 56 | 2 | |
| 3,4 | 28 (32.6) | 17 | 11 | |
| Late metastasis of cervical lymph nodes | 0.0006 * | |||
| Negative | 68 (79.1) | 63 | 5 | |
| Positive | 18 (20.9) | 10 | 8 | |
| Lymphovascular invasion | 0.0101 * | |||
| Negative | 75 (87.2) | 67 | 8 | |
| Positive | 11 (12.8) | 6 | 5 | |
| Perineural invasion | ||||
| Negative | 82 (95.3) | 71 | 11 | 0.1067 |
| Positive | 4 (4.7) | 2 | 2 | |
ITK, interleukin-2–inducible T-cell kinase. a Fisher’s exact test, * p < 0.05. Statistical significance associations are highlighted in bold. b According to the International Union Against Cancer (UICC) TNM Classification of Malignant Tumors, 8th edition. c Anneroth’s histological grading system.
3. Hazard Ratios (HRs) for Death and Prognostic Significance of ITK Protein Expression in TSCC
We calculated the HR for death with respect to various parameters, including age, clinical stage, ITK protein expression, sex, histologic differentiation, mode of invasion, late metastasis of cervical lymph nodes, lymphovascular invasion, and perineural invasion, using univariate and multivariate Cox regression analyses. Univariate analyses revealed that ITK protein expression, histologic differentiation, mode of invasion, late metastasis of cervical lymph nodes, and lymphovascular invasion exhibited statistically significant HRs for death: 3.544 (95% confidence interval [CI] 1.225–10.247) for ITK protein expression, 3.401 (95% CI 1.264–9.149) for histologic differentiation, 5.112 (95% CI 1.768–14.783) for mode of invasion, and 4.497 (95% CI 1.684–12.010) for lymphovascular invasion (Table 2). Multivariate analyses indicated that ITK protein expression was an independent positive predictor of death in TSCC patients: HR 3.167 (95% CI 1.089–9.215) (Table 2).
Table 2. Hazard ratios for death with stage I/II tongue squamous cell carcinoma—Cox regression model.
| Covariate | Univariate Analysis (n = 86) | Multivariate Analysis (n = 86) | ||||||
|---|---|---|---|---|---|---|---|---|
| HR | 95% CI | p-Value | HR | 95% CI | p-Value | |||
| Age (years) | ||||||||
| <64 | Reference | Reference | ||||||
| ≥64 | 2.866 | 0.923 | 8.894 | 0.068 | 2.611 | 0.836 | 8.153 | 0.099 |
| ITK protein expression | ||||||||
| Negative | Reference | Reference | ||||||
| Positive | 3.544 | 1.225 | 10.247 | 0.020 * | 3.167 | 1.089 | 9.215 | 0.034 * |
| Sex | ||||||||
| Male | Reference | |||||||
| Female | 1.235 | 0.463 | 3.296 | 0.673 | ||||
| Stage a | ||||||||
| Stage I | Reference | |||||||
| Stage II | 1.519 | 0.567 | 4.068 | 0.405 | ||||
| Histologic differentiation | ||||||||
| Well | Reference | |||||||
| Poor and moderate | 3.401 | 1.264 | 9.149 | 0.015 * | ||||
| Mode of invasion b | ||||||||
| 1, 2 | Reference | |||||||
| 3, 4 | 5.112 | 1.768 | 14.783 | 0.003 * | ||||
| Late metastasis of cervical lymph nodes | ||||||||
| Negative | Reference | |||||||
| Positive | 4.497 | 1.684 | 12.010 | 0.003 * | ||||
| Lymphovascular invasion | ||||||||
| Negative | Reference | |||||||
| Positive | 3.497 | 1.210 | 10.110 | 0.021 * | ||||
| Perineural invasion | ||||||||
| Negative | Reference | |||||||
| Positive | N.A.c | |||||||
HR, hazard ratio; CI, confidence interval; ITK, interleukin-2–inducible T-cell kinase. * p < 0.05. Statistical significance associations are highlighted in bold. aAccording to the International Union Against Cancer (UICC) TNM Classification of Malignant Tumors, 8th edition b Anneroth’s histological grading system. c Could not be calculated.
4. Role of ITK in Cancer Cell Proliferation In Vitro and In Vivo
ITK expression was not detected in the oral cancer cell lines we investigated (Figure 1K). Consequently, we engineered SAS and KOSC2 oral cancer cells that stably express ITK (Figure 1L) and investigated the effect of ITK expression on cell proliferation in three-dimensional (3D) cultures. Proliferation of ITK-expressing SAS (Figure 1M) and KOSC2 (Figure 1N) cells was significantly enhanced compared with mock control cells. Figure panels 1M and 1N show photographs of spheroids of cultured SAS and KOSC2 cells, respectively. After 72 or 96 hours of culture, ITK-expressing cell spheroids were larger than mock control cell spheroids. We also investigated the effect of ITK expression on cell proliferation using in vivo models in which immunodeficient mice were inoculated subcutaneously with cancer cells. ITK-expressing SAS tumor cells grew faster than mock control cells (Figure 1O). Ki67 staining was stronger in ITK-expressing SAS tumor cells than in mock control cells. IHC confirmed the expression of ITK in tumor cells (Figure 1O). Neither ITK-expressing KOSC2 nor mock control cells colonized mice.
5. Proteomic Analysis of ITK Tyrosine Phosphorylation
Because ITK is a tyrosine kinase, we used mass spectrometry to investigate its tyrosine phosphorylation profile to identify novel biological behaviors in newly established oral cancer cell lines expressing ITK. Levels of tyrosine phosphorylation in SAS and KOSC2 cells were significantly higher in ITK-expressing cells than in mock control cells for 45 and 179 peptides, respectively. A total of 26 of the peptides were common to SAS and KOSC2 cells. Excluding ITK peptides, GART peptides exhibited the highest levels of tyrosine phosphorylation among the 26 common peptides in ITK-expressing cells. GART and ITK phosphotyrosine residues common to SAS and KOSC2 cells are shown in Figure 2A,B. Compared with mock control cells, levels of a GART-associated specific phosphotyrosine (Tyr348) were significantly increased by 51- to 121-fold in ITK-expressing SAS and KOSC2 cells, respectively (Figure 2AB). Tandem mass spectra representing the phosphorylated residues of GART.
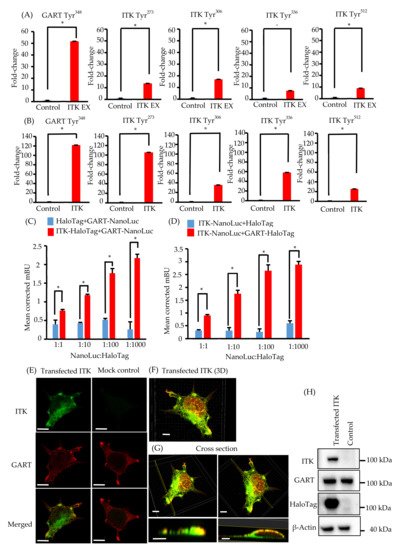
Figure 2. Phosphotyrosine proteomic analysis of interleukin-2–inducible T-cell kinase (ITK)-expressing cells and mock control cells, and protein–protein interaction between ITK and trifunctional purine biosynthetic protein adenosine-3 (GART). (A,B) Quantitative comparison of phosphotyrosine residues on GART and ITK in SAS cells (A) and KOSC2 cells (B). Error bars indicate standard deviation. * p < 0.05 (Student’s t-test). (C) BRET assay in HEK 293 cells. Red bars indicate HEK 293 cells transfected with HaloTag-fused ITK and NanoLuc-fused GART. Blue bars indicate HEK 293 cells transfected with HaloTag and NanoLuc-fused GART. (D) BRET assay in HEK 293 cells. Red bars indicate HEK 293 cells transfected with NanoLuc-fused ITK and HaloTag-fused GART. Blue bars indicate HEK 293 cells transfected with HaloTag and NanoLuc-fused ITK. Error bars indicate standard deviation. * p < 0.01 (Student’s t-test). (E) Immunofluorescence cytochemistry of HEK 293 cells with anti-ITK (green) and anti-GART (red) antibodies. ITK was transfected, and GART was the endogenous protein. Left panels show HaloTag-fused ITK-transfected HEK 293 cells. Right panels show HaloTag-transfected HEK 293 cells (bars, 5 μm). (F and G) 3D images of immunofluorescence cytochemistry with anti-ITK (green) and anti-GART (red) antibodies. These images show HaloTag-fused ITK-transfected HEK 293 cells. (F: bar, 5 μm; G: upper panel bars, 5 μm; lower panel bars, 3 μm). (H) Western blot analysis of ITK and GART expression in HaloTag-fused ITK-transfected or HaloTag-transfected HEK 293 cells as a mock control. β-Actin was blotted as a loading control.
6. Elucidation of the Association between ITK and GART
We investigated the direct association between ITK and GART, as GART is endogenously expressed in oral cancer cell lines and HEK 293 cells (Figure 1K and Figure 2H). In cells transfected with ITK or GART fused to NanoLuc or HaloTag, BRET occurred in a HaloTag concentration-dependent manner. By contrast, BRET was not detected in cells transfected with HaloTag not fused to ITK or GART (Figure 2C,D). Immunofluorescence analysis of the intracellular localization of ITK (green) and GART (red) (Figure 2E–G) indicated the partial colocalization of ITK and GART in HEK 293 cells (Figure 2E). Analyses of 3D images showed that ITK and GART interacted at the non-adherent surface of the cell or close to the tip of the cellar protrusions (Figure 2F,G). Expression of transfected ITK and endogenous GART in HEK 293 cells was confirmed by western blotting (Figure 2H).
7. Assessment of De Novo Synthesis of Purines in ITK-Expressing Cells
To clarify whether transfected ITK accelerates de novo synthesis of purines via activation of GART enzymatic activity, we performed 13C-glucose tracing analyses. After replacement of 13C6-glucose in the culture medium, we simultaneously quantified 13C-containing metabolites of the purine synthesis pathway, inosine monophosphate (IMP), and 5-phosphoribosyl-1-pyrophosphate (PRPP), as well as lactate and citrate (Figure 3A).
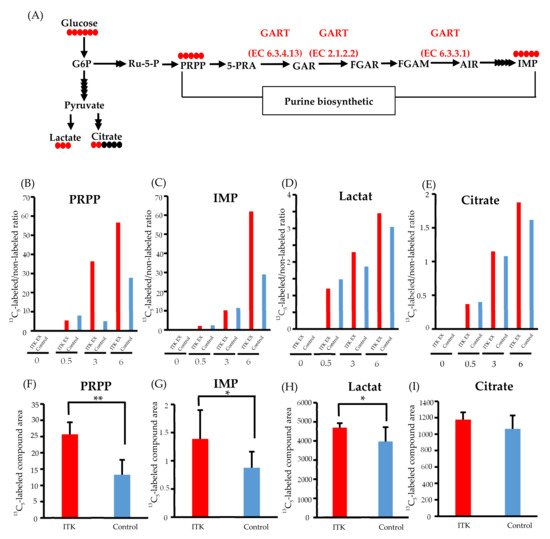
Figure 3. Metabolomic analysis of interleukin-2–inducible T-cell kinase (ITK)-expressing cells and mock control cells. (A) Purine biosynthesis pathway and glycolytic pathway (G6P, glucose 6-phosphate; Ru-5-P, ribulose-5-phosphate; PRPP, 5-phosphoribosyl 1-pyrophosphate; 5-PRA, 5-phosphoribosyl-1-amine; GAR, glycinamide ribonucleotide; FGAR and FGAM, formylglycinamide ribonucleotide; AIR, 5-aminoimidazole ribonucleotide; IMP, inosine monophosphate). Red and black circles indicate the number of 13C and 12C atoms in the metabolites, respectively. (B–E) Ratio of 13C- to 12C-labeled compounds at 0, 0.5, 3, and 6 hours after addition of 13C6-glucose in SAS cells (B: PRPP; C: IMP; D: lactate; E: citrate). (F–I) Absolute amount of each 13C-labeled compound at 0 and 6 hours after addition of 13C6 -glucose in SAS cells (F: PRPP; C: IMP; D: lactate; E: citrate). Error bars indicate standard deviation. * p < 0.05, ** p < 0.001 (Student’s t-test).
Time-course profiling of the 13C replacement rate (i.e., a ratio of 13C6-glucose to 12C6-glucose) indicated increased influx of 13C to the PRPP pool (>2-fold) between 3 and 6 hours post-replacement (Figure 3B). Such an increase in 13C influx into IMP was also demonstrated at 6 hours post-replacement, with an almost 2-fold increase (Figure 3C), while only small increases in the 13C replacement rate of lactate and citrate were observed (Figure 3D and E).
Increased purine de novo synthesis in ITK-expressing cells was confirmed by quantifying the amounts of 13C-labeled compounds (Figure 3F–I). Compared to mock control cells, the amounts of 13C5-PRPP, 13C5-IMP, and 13C3-lactate were significantly higher in ITK-expressing cells at 6 hours after replacement of 13C6-glucose (Figure 3F–H), while there was no statistically significant difference in citrate amount (Figure 3I).
8. Inhibition of CellG and Suppression of GART Phosphorylation and Purine Metabolism Using an ITK Inhibitor
In both SAS and KOSC2 cells, the ITK-associated increase in cell proliferation was diminished by treatment with the ITK inhibitor Cmpd-5 (Figure 4A,B). Spheroids of ITK-expressing cells treated with Cmpd-5 were smaller than those of untreated ITK-expressing cells. By contrast, the proliferation rate and spheroid volume of mock control cells were not affected by treatment with the ITK inhibitor (Figure 4A,B).
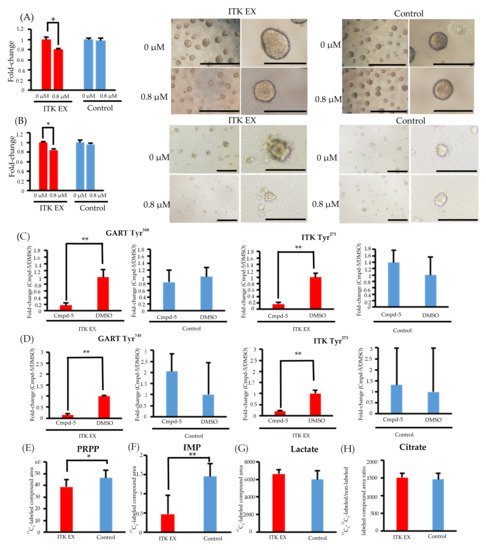
Figure 4. Effect of the interleukin-2–inducible T-cell kinase (ITK) inhibitor on ITK-expressing cells and mock control cells. (A) Rate of ITK-expressing SAS cells and mock control cells treated with DMSO or ITK inhibitor (Cmpd-5) for 144 hours. Images are representative photographs of ITK-expressing SAS cell spheroids and mock control cell spheroids treated with DMSO or ITK inhibitor for 144 hours. Left panels of ITK-expressing cell spheroids and mock control cell spheroids are overall views (bars, 1 mm), and right panels are magnified images (bars, 500 μm). * p < 0.001 (Student’s t-test) (B) Rate of ITK-expressing KOSC2 cells and mock control cells treated with DMSO or ITK inhibitor (Cmpd-5) for 144 hours. Images are representative photographs of ITK-expressing KOSC2 cell spheroids and mock control cell spheroids treated with DMSO or ITK inhibitor for 144 hours. Left panels of ITK-expressing cell spheroids and mock control cell spheroids are overall views (bars, 200 μm), and right panels are magnified images (bars, 50 μm). * p < 0.001 (Student’s t-test). (C,D) ITK-expressing cells and mock control cells were treated with DMSO or ITK inhibitor (Cmpd-5) for 24 hours, and phosphotyrosine residues on GART and ITK were examined (C: SAS cells; D: KOSC2 cells). ** p < 0.05 (Student’s t-test). (E–H) Absolute amount of each 13C-glucose metabolite at 0 and 6 hours after addition of 13C-glucose in ITK-expressing cells and mock control cells treated with ITK inhibitor (E: PRPP; F: IMP; G: lactate; H: citrate). * p < 0.01, ** p < 0.001 (Student’s t-test). Error bars indicate standard deviation.
Phosphoproteomic analyses revealed that phosphorylation of GART and ITK was significantly suppressed in both ITK-expressing SAS and KOSC2 cells treated with Cmpd-5 compared with untreated cells, whereas the ITK inhibitor had no effect on GART and ITK phosphorylation in the mock control cells (Figure 4C,D). In metabolomic analyses with the ITK inhibitor, the absolute amounts of 13C5-PRPP and IMP were significantly lower in ITK-expressing cells treated with Cmpd-5 at 6 hours after addition of 13C6-glucose compared to mock control cells treated with the ITK inhibitor (Figure 4E,F). There were no statistically significant differences in the absolute amounts of 13C3- lactate and citrate (Figure 4G,H).
References
- Vermorken, J.B.; Mesia, R.; Rivera, F.; Remenar, E.; Kawecki, A.; Rottey, S.; Erfan, J.; Zabolotnyy, D.; Kienzer, H.R.; Cupissol, D.; et al. Platinum-based chemotherapy plus cetuximab in head and neck cancer. N. Engl. J. Med. 2008, 359, 1116–1127.
- Andreotti, A.H.; Schwartzberg, P.L.; Joseph, R.E.; Berg, L.J. T-cell signaling regulated by the Tec family kinase, Itk. Cold Spring Harb Perspect. Biol. 2010, 2, a002287.
- Song, Y.D.; Pan, Y.H.; Liu, J. The relevance between the immune response- related gene module and clinical traits in head and neck squamous cell carcinoma. Cancer Manag. Res. 2019, 11, 7455–7472.
- Carson, C.C.; Moschos, S.J.; Edmiston, S.N.; Darr, D.B.; Nikolaishvili-Feinberg, N.; Groben, P.A.; Zhou, X.; Kuan, P.F.; Pandey, S.; Chan, K.T.; et al. IL2 Inducible T-cell Kinase, a Novel Therapeutic Target in Melanoma. Clin. Cancer Res. 2015, 21, 2167–2176.
- Fridman, A.; Saha, A.; Chan, A.; Casteel, D.E.; Pilz, R.B.; Boss, G.R. Cell cycle regulation of purine synthesis by phosphoribosyl pyrophosphate and inorganic phosphate. Biochem. J. 2013, 454, 91–99.
More
Information
Subjects:
Oncology
Contributor
MDPI registered users' name will be linked to their SciProfiles pages. To register with us, please refer to https://encyclopedia.pub/register
:
View Times:
647
Revisions:
2 times
(View History)
Update Date:
26 Jul 2021
Table of Contents


Notice
You are not a member of the advisory board for this topic. If you want to update advisory board member profile, please contact office@encyclopedia.pub.
OK
Confirm
Only members of the Encyclopedia advisory board for this topic are allowed to note entries. Would you like to become an advisory board member of the Encyclopedia?
Yes
No
${ textCharacter }/${ maxCharacter }
Submit
Cancel
Back
Comments
${ item }
|
${ item.createdUser.fullName }
${ item.createdAt }
${ item.vote }
${ item.reply }
Delete
${ reply.createdUser.fullName }
${ reply.createdAt }
${ reply.vote }
Delete
There is no reply to this comment~
${ item.replyTextCharacter }/${ item.replyMaxCharacter }
Submit
Cancel
More
No more~
There is no comment~
${ textCharacter }/${ maxCharacter }
Submit
Cancel
${ selectedItem.replyTextCharacter }/${ selectedItem.replyMaxCharacter }
Submit
Cancel
Confirm
Are you sure to Delete?
Yes
No