During a baling operation, the operator of the baler should decide when and where to drop the bales in the field to facilitate later retrieval of the bales for transport out of the field. Manually determining the time and place to drop a bale creates extra workload on the operator and may not result in the optimum drop location for the subsequent front loader and transport unit. Therefore, there is a need for a tool that can support operators during this decision process. The key objective of this study is to find the optimal traversal sequence of fieldwork tracks to be followed by the baler and bale retriever to minimize the non-working driving distance in the field. Two optimization processes are considered for this problem. Firstly, finding the optimal sequence of fieldwork tracks considering the constraints of the problem such as the capacity of the baler and the straw yield map of the field. Secondly, finding the optimal location and number of bales to drop in the field. A simulation model is developed to calculate all the non-productive traversal distances by baler and bale retrieval in the field. In a case study, the collected positional and temporal data from the baling process related to a sample field were considered. The output of the simulation model was compared with the conventional method applied by the operators. The results show that application of the proposed method can increase efficiency by 12.9% in comparison with the conventional method with edited data where the random movements (due to re-baling, turns in the middle of the swath, reversing, etc.) were removed from the data set.
1. Introduction
The limited marginal revenue, the increasing costs of agricultural production, and shorter time slots of field operations all require modern agriculture to become more productive in order to handle the growing global demand
[1][2]. Biomass as a renewable and clean source of energy has received considerable attention from multiple stakeholders
[3][4][5][6]. However, there are two main challenges in producing energy from biomass: low bulk density and high logistics costs
[7][8]. Therefore, the logistics of biomass is an important factor for the productivity and sustainability of bioenergy production systems
[9][10].
A biomass supply chain includes these main processes: harvesting, collecting straw/residues, and pretreatment, storing and transferring biomass to a biorefinery
[8][11][12][13]. The harvesting and collecting systems in the biomass supply chain can be classified into different types like chopping and baling systems
[14]. This paper only focuses on the bale hauling system, which is the proper method for harvesting and collecting biomass for the second generation of bioethanol such as grass and wheat straw. The general benefits of the baling system can be listed as follows: easy and controlled logistics, volume reduction, and lower cost of transportation and storage
[15]. In order to improve the efficiency of the bale hauling system, all field activities, such as in-field bale aggregation and transportation, should be planned and optimized
[9].
Precision agriculture is a farming management concept benefitting from applying technologies such as navigation-aid systems, auto-steering technologies, remote sensing, cloud computing, and telecommunication
[16][17][18][19][20]. Developing a decision support system for biomass collection and bales aggregation processes can reduce the total traversal distance in the field and increases the total efficiency of the system
[21].
In the baling system, usually, the logistics process starts by collecting the biomasses from the field
[22]. After harvesting, the balers can compress and compact the residuals in the form of large square bales (e.g., 500 kg weight and the dimension of 1.2 × 0.9 × 2.4 m)
[23]. Bales remain dispersed in the field before stacking them at a specific location close to one of the field’s edges or left randomly inside the field. Afterward, those stacked or single bales are transferred to the more permanent storage locations or biorefineries for further processes. The bale collecting problem consists of all the operations related to several agricultural machines and the goal is to determine the best sequence in which to spread the bales over the field and then collect them
[24]. Developing the optimization and simulation models for the bale collecting problem can help farmers to decide which solution is the best route for making and collecting the bales in the sense of minimizing the non-working traveled distance/time or the fuel consumption.
The bale collecting problem can be cast as the well-known vehicle routing problem (VRP), in which a single capacitated agent should visit multiple spots (customers) for delivery and it should return to the depot for refilling/unloading
[25]. In order to formulate the process of making bales and the further collection as a mathematical model, first, the agricultural field is going to be divided into tracks (swaths) based on the working width of the applied windrower. Afterward, a baler with a bale accumulator is going to cover all those swaths for making bales. This process can be optimized by finding a route through all the swaths to drop the bales in a position that can minimize the total non-working traveled distance/time for the further collection process by considering the capacity of the bale accumulator. Moreover, according to the position of the dropped bales in the field, the collecting process can be optimized by finding an optimal route through the field to collect the bales by considering the capacity of the bale wagon.
The VRP problem is classified as a non-deterministic polynomial-time hardness (NP-hardness) problem. Due to the computational difficulty of these types of problems, usually, meta-heuristics algorithms have been developed by researchers to find a near-optimal solution in a reasonable time. The application of VRP for planning the agricultural in-field operation has been demonstrated in several studies
[26][27][28][29][30][31]. Several meta-heuristic algorithms have been developed to solve combinatorial optimization problems such as VRP by considering varying optimization criteria (e.g., minimizing the total non-working distance or operational time). Bochtis et al.
[26] presented an algorithmic method (B-patters) to find the optimal sequences of fieldwork tracks for area coverage by agricultural vehicles. They applied the Clarke–Wright savings algorithm to find the optimal sequence of tracks and the results showed reductions in the non-working distance up to 58.65%. Jensen et al.
[27] developed an algorithmic approach based on the state-space search technique for the optimization of capacitated field operations. Khosravani Moghadam et al.
[28] developed two meta-heuristics algorithms, ant colony optimization, and simulated annealing, and compared the functionality of these two algorithms by applying them in a benchmark field.
2. Research Results
3.1. Case Study
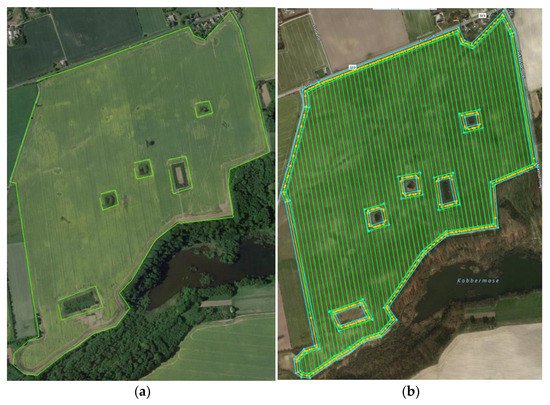
An agricultural field was considered as a case study to demonstrate the efficiency derived from applying the proposed optimization method to the bale production and collection operations. The location of the field is presented in the following figure (Figure 1). The field size is 79.37 hectares and the baling operation was done by two balers. The baler type was a Krone BigPack 1290 HDP II XC large square baler, with a working width of 10.5 m determined by the combine harvester swath width, and with a Kinematic turning radius of 7.6 m, producing bale sizes of 1.2 m × 0.9 m × 2.7 m with an average weight of 580 kg. A POMI bale collector was attached behind the baler to transport and unload up to three bales. Once the third bale was finished and stored on the POMI bale collector, the maximum load capacity in the number of bales was reached and the unloading had to take place. The position of the tractor pulling a baler were registered with Aplicom A1 units (Aplicom Oy, Äänekoski, Finland) and sent wirelessly via a GPRS network to a server and IoT platform (Clara Cloud, Conpleks A/S, Tokyo, Japan). The position of the baler during the operation was recorded at 0.5 Hz. The position of individual bales left behind by the baler on the fields was manually measured by RTK-GPS. Data were inspected manually in QGIS, e.g., double registrations of bales were removed. Data for the balers’ route was retrieved from the Clara Cloud IoT platform. The coordinate transformation from WGS84 latitude and longitude to UTM Northing and Easting was done by the Danish KMS Trans2 tool (Agency for Data Supply and Efficiency).
Figure 1. The case study field with size: 79.37 ha; (a) Representing the field boundary and obstacles inside the field; (b) Field representation after partitioning the field.
The grain yield was registered by yield sensors on a CLAAS Lexion 770 combine. The yield sensor was calibrated according to the combined instruction manual on the day of the harvest of the field. The straw yield can be estimated with the multiplication of the median of the crop yield per field by the straw-weight in the percentage of crop yield. The median of the crop yield can be calculated by the yield logging from the combine, which is equal to 9.46 (ton/hectars). The straw-weight percentage of crop yield is dependent on the local field conditions and the crop variety. For this sample field it is equal to 33.9%.
3.2. Determine the Driving Distance in the Sample Field
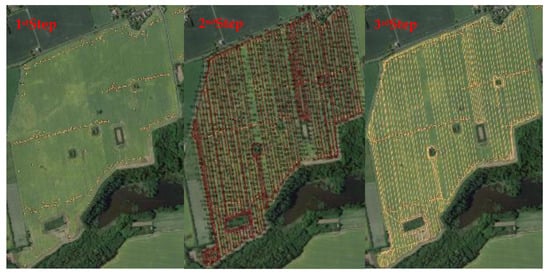
To calculate the traveled distance by a baler inside the sample field, the recorded GPS data from the baler was considered. In the first step, the recorded coordinates of the bale position were used to make a shapefile and then to plot the location of bales in the QGIS software. The source coordinate reference system was set to (EPSG: 25832-ETRS89/UTM zone 32N) to precisely show the location of bales in the sample field. Figure 2 (1st step) illustrates the location of bales in the sample field. The next step is to use the log file to demonstrate the driving patterns of the baler inside the field. In this way, the coverage of the field, as well as the paths and the maneuvers of the baler, can be studied. Each line of the log file refers to an event that has a time and two coordinates to show the location of the baler at that specific time. To define the direction of traveling inside the paths, different parameters should be calculated in advance. The first one is the amount of traveled distance between two events, which can be calculated as the Euclidean distance of the sequential events. The second parameter is the forward speed of the baler, which can be determined by dividing the traveled distance by the duration of time between events. The direction of travel in degrees (0–360) was determined by first calculating the distance between the subsequent position in the Northing (Y) and Easting (X) direction individually. Second, a calculation of the degree of the direction of travel is carried out by adding π or 2π depending on the sign of the distances in the X and Y direction, which affiliates the direction within quadrants of the unit circle. The direction of driving paths can be defined based on the calculated heading degree. To better study the movement of the baler inside the field, each event was labeled by a number based on its order in the log file. Figure 2 (2nd step), demonstrates the chronological order of events in the log file of the sample field. In the 3rd step, the QGIS plugin “POINTS TO PATH” was applied to plot the paths (driving lines) inside the field. Driving lines could be useful to show the type of maneuvers in the headland part as well as to determine the turning radius of the baler.
Figure 2. The steps for determining the driving distance in the sample field.
In order to validate the proposed method, the non-working traveled distance for the conventional method was calculated and compared with the solution derived from the proposed optimization algorithm. Therefore, the recorded log file for the sample field was analyzed to determine the total amount of non-working traveled distance. The amount of covered area in the conventional method is calculated by multiplying the total traveled distance by the baler into the working width of the baler (51,370.8 × 10.5). The same procedure was applied to the optimization method to find the area covered (64,346 × 10.5). The difference between the area covered in the conventional and optimized methods refers to the fact that in the conventional method the field was covered by two balers and the information corresponding to only one of them was available. However, in the optimized method, the entire field was covered by one baler. Dividing the total driven non-working distance by the amount of covered area shows the amount of non-working distance per hectare, which can be used later for comparison of the optimized and conventional methods. Table 1 demonstrates the comparison between optimized and conventional method.
Table 1. Comparison between the optimized and conventional method for the sample field.
| Method |
Non-Working Distance (Meter) |
Amount of Covered Area (ha) |
Non-Working Distance Per Hectare (Meter/ha) |
| Conventional |
9694 |
53.9 |
179.8 |
| Optimized |
10,571 |
67.5 |
156.6 |
The comparison of non-working distance per hectare shows that the optimization model can bring 12.9% efficiency in comparison with the conventional method in this field.
3.3. Scenarios
Different scenarios were defined to investigate the effects of the number of dropping lines and the location of aggregating points on the total non-working distance and operational time of the baler and collector. The machine considered for in-field hauling is a self-propelled, self-loading unit with the capacity to handle eight bales (big square four × four) at a time. This machine loads with a tilting action, which allows non-stop bales to pick up their speed up to 7 miles per hour. The traveled distance and time for the collector are calculated based on the defined aggregating point in the field.
4. Current Insights
The minimum number of dropping lines in the sample field can be calculated as follows: First of all, the straw in the headland part of the sample field was chopped by a combine harvester, and there is no swath in this part for the baler. Therefore, the headland is taken out and the corrected field area is equal to 68.70 hectares. The straw yield is estimated based on the harvest index and crop yield and is equal to 3.21 (ton/ha). The number of produced bales can be estimated based on Equation (1) and it is equal to 380 bales. The traveled distance for producing one bale inside the field can be determined according to the Equation (2) and it is equal to 172 m. Therefore, the minimum number of divisions for the longest track in the field is equal to two. By continuing the process of division for all the tracks, at the end there are a minimum of four dropping lines in total for the sample field. Other options with more than 10 dropping lines result in the same amount of baler non-working distance as 10 lines. Therefore, in this paper between 4 and 10 lines were considered as the options for the number of dropping lines in the sample field.
The results of the simulation model for traveled time and distance corresponding to the different number of dropping lines show that, by increasing the number of lines from 4 to 10, the amount of traveled time and distance is reduced. The reason behind this fact is that when the baler reaches the end of one track, based on the remaining capacity, there are limited options to choose for the next node for visiting to be sure that there is enough capacity to reach the next dropping line. As many divisions as there are in the tracks, there are many more options for the baler to choose from. Therefore, when there are at least 10 dropping lines in the sample field, the baler can follow the optimal route and at the same time, it can drop the bales on the dropping lines.
The comparison of simulation results for collecting units shows that based on the distance from dropping lines to the depot (aggregating point), the total traveled time and distance vary. In the first scenario, dividing the sample field into two halves with a horizontal line can better show how many bales are located in the north part of the field and closer to the depot.
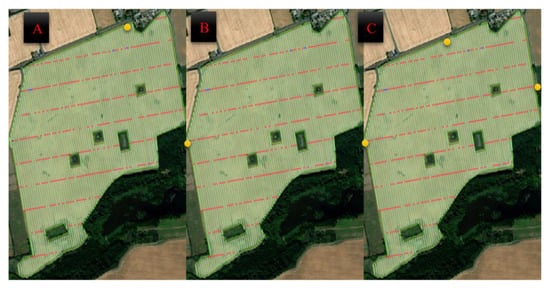
Location of aggregating points can affect the traveled time and distance of collecting units inside the field. As can be seen in scenario A (Figure 3), the depot is located north of the field, and it is too far from those bales that are located on the lower dropping lines. Changing the location of the aggregating point in scenario B reduces the amount of driving distance and time by the collecting units since the distance between the dropping lines and the depot is shorter in this scenario. Moreover, adding two more aggregating points in a different part of the field and close to the main road can reduce the traveled distance and time by 44%.
Figure 3. Defined scenarios based on the different locations for aggregating points in the field (with 10 dropping lines).
In this study, a self-propelled and self-loading bale collector was considered for in-field hauling operation. The capacity of this machine is eight bales for each load. The collecting process is carried out continuously and without stops and with a relatively high working speed (7 miles per hour). Other in-field hauling options such as bale loader and transporting wagons can be used. The capacity of these transporting wagons exceeds the capacity of the applied in-field hauling unit. However, due to the heavy weight of these wagons, they are quite slow. Moreover, these types of collecting units have a reduced capacity and the operator of the bale loader needs to have a special skill to do this operation efficiently.
There are different strategies and patterns for dropping the bales on the field during the collection of the residues along the fieldwork tracks. Clustering is a method in which the operator of the baler tries to drop the bales in a position where, at the end of covering the field, the bales are located closer to the center to form a cluster. After that, all the bales belong to a cluster aggregated in the center of that cluster. In the end, either all the aggregated bales in each cluster are directly transported to the biorefinery or they are transferred to the corner of the field closest to the road for further transportation. There is another method that tries to drop the bales as close to the headland part of the field as possible. Figure 2 shows that in this sample field, the operator of the baler tried to follow this method and drop the bales close to the headland part. The result shows that the proposed method in this study can bring higher efficiency (12.9%) in comparison with that method.
One of the challenges in collecting the bales inside the big fields where there are different elevations inside the fields is that sometimes it is so hard for the collecting units to find the location of scattered bales on the field. One of the benefits of the proposed method is that all the bales are located on a straight line and thus it is easy for the operator of the collecting units to collect them by driving straight through all the bales on a dropping line. Moreover, another benefit of this method is that it is possible to reduce the amount of traveled non-working distance in the field for the baler and collecting units. consequently, there is less fuel consumption and fewer greenhouse gas (GHG) emissions by applying this method in tandem with conventional methods.
Future perspectives include improving the presented method and providing a real time solution as well as the application of robotics in the baling system, especially how to apply a fleet of robots instead of collecting units to aggregate the bales and collect the residues from the field.
 +1 credit