Landfill gas produces ozone precursors such as nitrogen oxides and formaldehyde when combusted in flares or stationary engines. Solid waste landfills are also the third largest anthropogenic source of methane in the United States. Methane is both a greenhouse gas and a tropospheric ozone precursor. Despite its low photochemical reactivity, methane may noticeably affect urban ozone if released in large quantities along with other organic compounds in landfill gas. A fine-scale 3D Eulerian chemical transport model was used to demonstrate that, under meteorological and background chemical conditions conducive to high ozone concentrations, typical emissions of ozone precursors from a single hypothetical landfill may result in persistent daytime additions to ozone of over 1 part per billion (ppb) by volume tens of kilometers downwind.
1. Introduction
Solid waste landfills are the third largest anthropogenic source of methane (CH
4) emissions in the United States
[1]. Methane is a greenhouse gas with an atmospheric lifetime of about 9 years
[2]. It is also a global ozone (O
3) precursor due to its ability to alter the balance of tropospheric radicals. West and Fiore
[3] suggested that a 17% decrease in world emissions of methane may result in a 1 part per billion (ppb) by volume average reduction in global tropospheric ozone.
While the U.S. Environmental Protection Agency (USEPA) does not classify methane as a Volatile Organic Compound (VOC) due to its low photochemical reactivity
[4], methane may nevertheless contribute significantly to urban (as opposed to global background) ozone if released in large quantities, especially if coincident with high-density emissions of ozone precursors from mobile and stationary sources.
Large methane leaks are known to occur from underground natural gas pipelines. Emissions from natural gas distribution and end use may in fact be 2–3 times larger than predicted by existing inventory methodologies and industry reports
[5], with older, corrosion-prone distribution lines leaking ~25 times more methane than more modern pipelines
[6]. Phillips et al.
[7] identified 3356 methane leaks in Boston from measured ambient air concentrations exceeding up to 15 times the current global background level of over 1.8 parts per million (ppm) by volume
[8]. Recent studies suggest that landfills may have releases of methane to the atmosphere comparable to defective natural gas pipelines.
When estimating emissions, there are two general classes of methods, often referred to as “bottom-up” (i.e., based on emission factors and activity metrics) and “top-down” (i.e., based on ambient air measurements). “Bottom-up” estimates of methane emissions from landfills are often obtained from the USEPA’s Landfill Gas Emissions Model (LandGEM)
[9], and are typically well below 1000 kg/h of CH
4. The increasing availability of advanced optical methods such as cavity ring-down spectrometry (CRDS) has made it possible to make much more revealing measurements of methane emissions in real time using “top-down” analysis techniques.
The California Methane Survey
[10] deployed airborne visible and infrared imaging spectrometry to measure methane point sources (i.e., emissions from infrastructure elements or localized surface features) at 30 landfills and two composting facilities. These 32 sources collectively contributed about 43% to total point source emissions of methane in California, indicating the presence of super-emitters among the surveyed facilities. The strong methane plumes at some of the landfills may have been associated with gaps in intermediate cover, delays in construction projects, and/or leaking gas capture wells. Duren et al.
[11] compared airborne measurements of methane emissions at six California landfills analyzed by with bottom-up estimates reported to the USEPA. They found significant discrepancies between bottom-up and top-down estimates, especially for the super-emitters releasing over 2000 kg/h of CH
4.
Not all landfills manifest as large point sources of methane. A more recent study of landfills conducted by California Polytechnic State University (CPSU)
[12], based on both aerial CRDS (16 sites) and synchronous ground-based static flux chamber measurements (5 sites), found that methane emissions from small, medium, and large landfills varied from −25 to 11 kg/h, 90 to 638 kg/h, and 602 to 3275 kg/h respectively. Estimated gas collection efficiencies ranged from 23.2 to 91.4% from aerial data, 38.9 to 100% from ground data, and 24.5 to 75.9% from LandGEM. The results of the CPSU study also indicated that Non-Methane Organic Compounds (NMOCs), which include USEPA-delisted low-reactivity organics other than methane, are a significant fraction of landfill gas.
Ozone precursors are also generated when landfill gas is combusted in flares or by stationary engines used for gas-to-energy conversion. These precursors include nitrogen oxides (NOx = NO + NO
2) and the hazardous air pollutant (HAP), formaldehyde (HCHO), as well as other organic species. Formaldehyde is especially important to ozone formation as a radical precursor
[13]; that is, it photolyzes to yield external HOx (= OH + HO
2) radicals that convert emitted NO to NO
2, which is then converted to ozone by photolysis and molecular collisions. This is opposed to most VOCs, which only yield a chain of internal radicals upon reaction with already-available HOx. To use an analogy, HCHO and other radical precursors (HONO, higher aldehydes, etc.) are the “matches” that light the “flame” of ozone chain reactions involving NOx and VOCs.
Primary formaldehyde, that is HCHO directly emitted by industrial (and also natural) sources, is unfortunately under-reported or even ignored in official emission inventories, as the standard measurement technique for VOCs used in regulatory settings (flame ionization detection) does not account for HCHO. Moreover, there exists a widespread assumption that primary formaldehyde is dwarfed by secondary formaldehyde, that is, HCHO chemically produced by organic reactions in the atmosphere
[13][14]. In the case of landfills, stationary engine stack tests conducted for permit applications in the State of Michigan based on extractive Fourier Transform Infrared (FTIR) spectroscopy reveal HCHO-to-CO molar ratios of the order of 10% or more. This is confirmed by engine stack test data collected by the State of New Jersey
[15], which has since 2018 required more accurate measurement and reporting of primary formaldehyde from reciprocating internal combustion engines by permitted industrial facilities
[16].
Note that landfill gas combustion may be especially inefficient due to the presence of organic silicon compounds (e.g., siloxanes) that form silicon dioxide when burned. Silicon dioxide, commonly known as silica, is a solid at combustion gas temperatures. Silica deposits often cause maintenance and operational problems in engines.
For flares, the HCHO-to-CO molar ratio is of the order of 5%, based on data collected by Aerodyne Research, Inc. (Billerica, MA, USA) in 2010 at the John Zink experimental facility in Oklahoma
[17][18]. The combination of HCHO emissions from flares and engines, as well as other combustion sources such as duct burners, may result in many landfills exceeding the major source threshold of 10 short tons per year (tpy) of a single HAP, triggering the need for a U.S. Clean Air Act Title V permit.
Changes in landfill operation may trigger the need for another type of permit under the New Source Review (NSR) provisions of the U.S. Clean Air Act. NSR permit decisions for individual facilities in the State of Michigan consider whether the facility’s contribution to ambient ozone averaged over 8 h is likely to exceed a Significant Impact Level (SIL) of 1 ppb, among other factors. This impact is typically gauged from reported facility emissions and pre-computed ozone look-up tables for the region of interest
[19].
The goal of this paper was to demonstrate that, under meteorological and background chemical conditions conducive to high ozone concentrations, a single landfill facility may persistently contribute over 1 ppb to ambient ozone above the urban background based on typical emissions of ozone precursors. This was accomplished on the basis of explicit simulation with a state-of-the-art microscale air quality model.
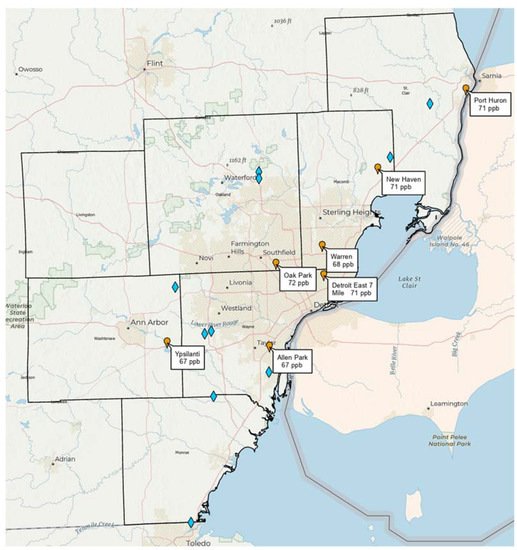
Note that Southeast Michigan (including metropolitan Detroit) is currently in non-attainment of the U.S. National Ambient Air Quality Standard (NAAQS) for ozone (set at 70 ppb averaged over 8 h), with recent design values (3-year average of the annual 4th highest daily maximum 8 h ozone) exceeding the NAAQS at the Oak Park, East 7 Mile, New Haven, and Port Huron monitoring stations run by the Michigan Department of Environment, Great Lakes, and Energy (EGLE). Figure 1 shows the distribution of landfills in Southeast Michigan and their spatial relationship to the monitoring network. Given that ozone exceedances in the region typically occur when the wind blows from the southwest, a plausible hypothesis is that Southeast Michigan landfills may have a combined impact on ozone design values at downwind monitors approaching or exceeding 1 ppb. If this hypothesis is true, then control of landfill emissions of methane, HCHO, and other ozone precursors is a potentially important strategy for ozone attainment in Southeast Michigan.
Figure 1. Locations of major solid waste landfills (blue diamonds) in the seven counties of the Southeast Michigan ozone non-attainment area relative to ozone monitoring stations (orange markers) run by the Michigan Department of Environment, Great Lakes, and Energy (EGLE). Stations are shown with corresponding 2018–2020 ozone design values.
2. Near-Source Simulation
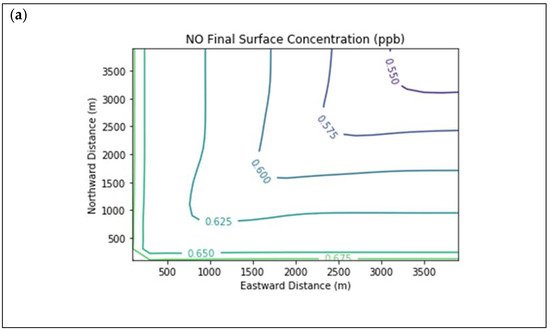
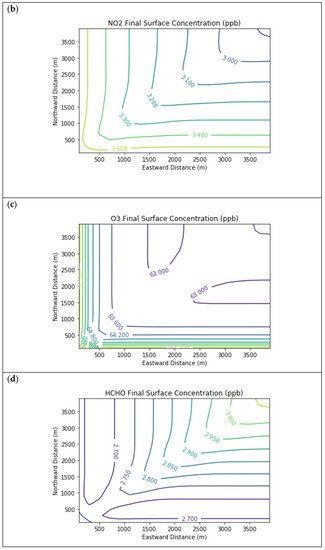
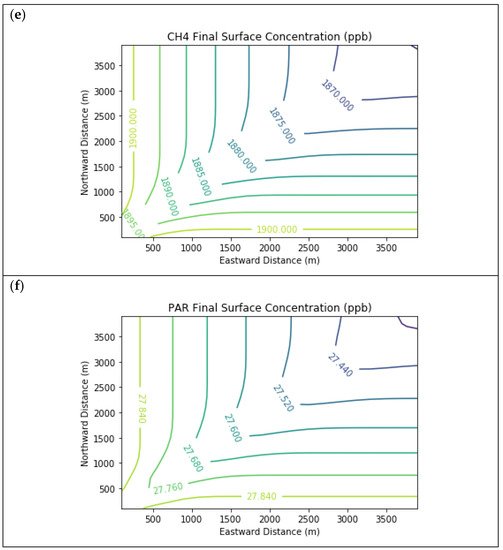
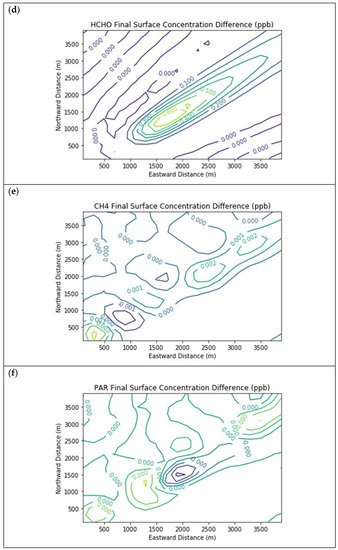
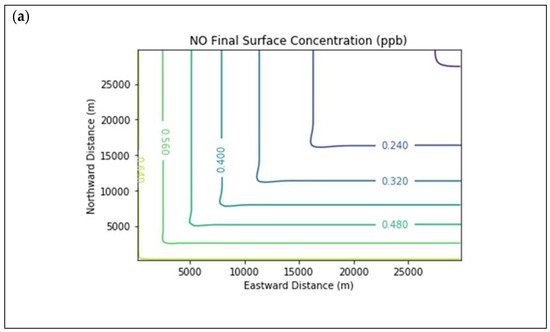
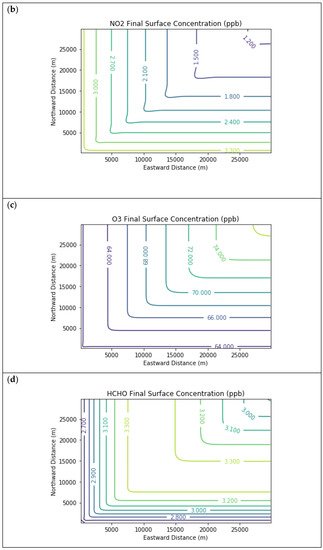
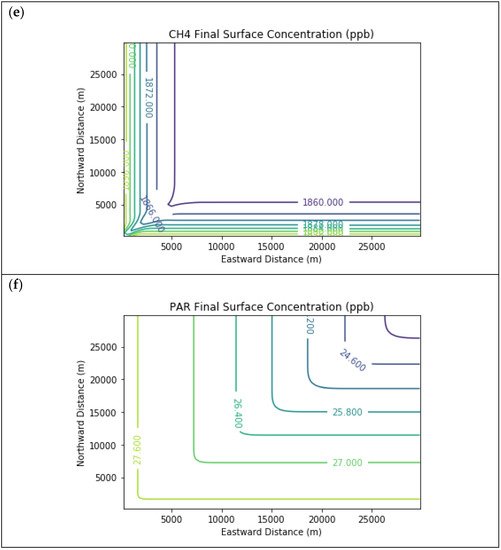
Results are first presented for the near-source simulation. Figure 2 displays surface concentration isopleths for ozone and key ozone precursors (NO, NO2, HCHO, CH4, and PAR) at the end of the three-hour simulation period for the Baseline scenario.
Figure 2. Near Source: Baseline Scenario.Final surface concentrations of (a) NO, (b) NO2, (c) O3, (d) HCHO, (e) CH4, and (f) PAR at the end of the 3 h simulation in the Baseline scenario for the 4 km × 4 km domain.
Note that the downwind ozone concentrations were below the inflow level of 70.3 ppb because of dry deposition within the model domain, as well as some titration of ozone by incoming NOx. Downwind HCHO was increased above the inflow concentration of 2.84 ppb due to secondary formation by decomposing incoming organic species.
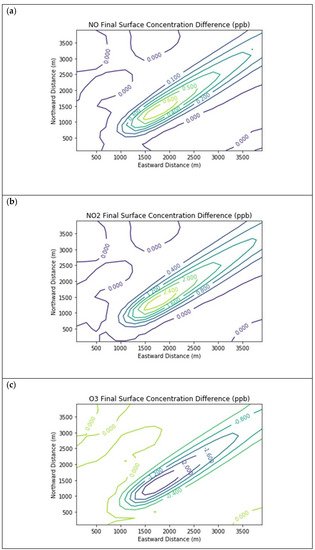
Figure 3 presents the end-of-simulation differences from the Baseline scenario due to landfill combustion sources in the Combustion Only scenario. Landfill NOx emissions increase the titration of ozone near the source, hence the negative contours in the ozone isopleths in the vicinity of the NOx enhancements. Incomplete combustion also significantly increases near-source formaldehyde exposure, with a peak enhancement of 0.68 ppb above the baseline concentration.
Figure 3. Near Source: Combustion Only ― Baseline. Difference plots of (a) NO, (b) NO2, (c) O3, (d) HCHO, (e) CH4, and (f) PAR between the Combustion Only and Baseline scenarios at the end of the 3-h simulation for the 4 km × 4 km domain.
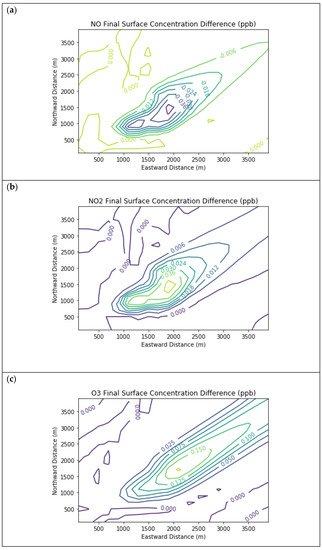
Figure 4 presents the end-of-simulation differences from the Combustion Only scenario due to the addition of fugitive emissions of methane and NMOC in the Fugitives + Combustion scenario. Note that the additional reactivity introduced by fugitives was not enough to overcome the effects of the combustion NOx titration of ozone near the source. The maximum enhancements of methane and PAR above background due to landfill fugitives were 22.6 ppm and 98.7 ppb respectively. The former value is comparable to urban methane concentrations in the vicinity of leaking natural gas pipelines
[7] and to some CRDS measurements of ambient methane outside Michigan landfills during EGLE inspections.
Figure 4. Near Source: Fugitives + Combustion − Combustion Only. Difference plots of (a) NO, (b) NO2, (c) O3, (d) HCHO, (e) CH4, and (f) PAR between the Fugitives + Combustion and Combustion Only scenarios at the end of the 3-h simulation for the 4 km × 4 km domain.
3. Far-Field Simulation
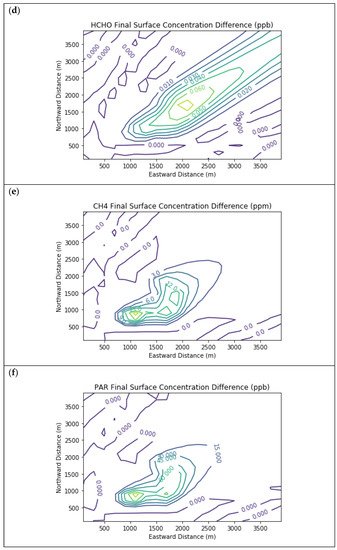
Figure 5 displays surface concentration isopleths for ozone and key precursors for the Baseline scenario, but for the larger 30 km × 30 km domain. In this scenario, the downwind edge of the far-field domain surpassed the inflow ozone concentration due to longer-range photochemical reactions, which also consumed NOx down to about a third of the boundary conditions. Meanwhile, the far-field methane concentration decayed nearly to the global background value with no interior sources in the domain. Formaldehyde peaked in the interior of the far-field domain at 3.3 ppb due to secondary formation.
Figure 5. Near Source: Fugitives + Combustion − Combustion Only. Final surface concentrations of (a) NO, (b) NO2, (c) O3, (d) HCHO, (e) CH4, and (f) PAR at the end of the 3-h simulation in the Baseline scenario for the 30 km × 30 km domain
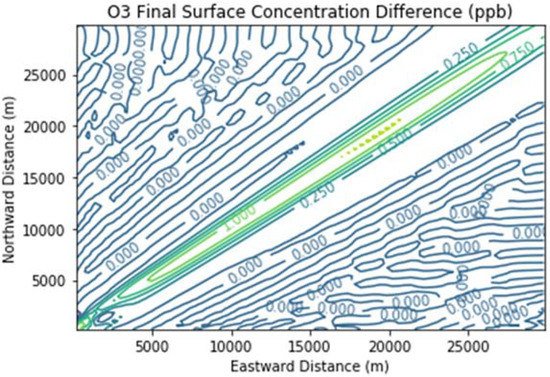
Figure 6 presents the additional ozone formed due to landfill combustion emissions in the Combustion Only scenario over and above that in the Baseline scenario. Maximum ozone enhancements were over 1 ppb over a broad segment of the downwind plume.
Figure 6. Ozone difference plot between the Combustion Only and Baseline scenarios at the end of the 3 h simulation for the 30 km × 30 km domain.
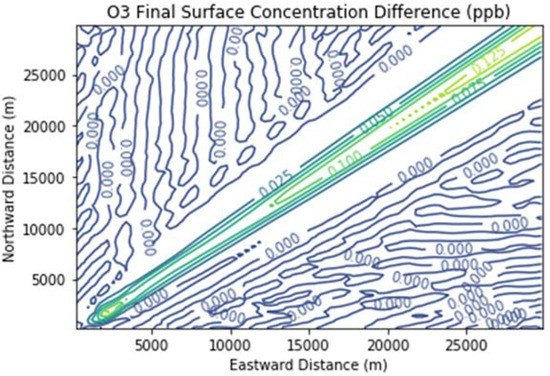
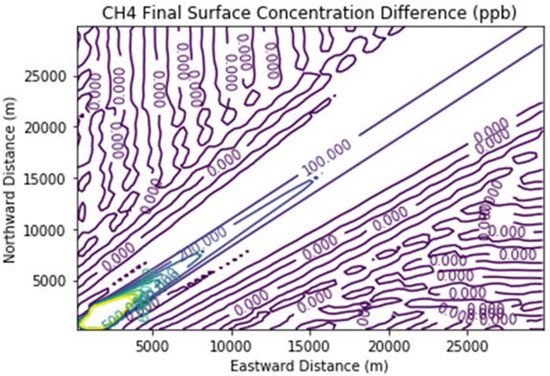
Figure 7 and Figure 8 show the ozone and methane increments resulting from the addition of landfill fugitive emissions of ozone precursors in the Fugitives + Combustion scenario. Note that the methane increment exceeded 100 ppb all the way to the downwind edge of the far-field domain. The ozone increment exceeded 0.1 ppb beginning at about 16 km downwind of the hypothetical landfill and maximized at the domain edge.
Figure 7. Ozone difference plot between the Fugitives + Combustion and Combustion Only scenarios at the end of the 3 h simulation for the 30 km × 30 km domain.
Figure 8. Methane difference plot between the Fugitives + Combustion and Combustion Only scenarios at the end of the 3 h simulation for the 30 km × 30 km domain.
The ozone increment of over 0.1 ppb due to landfill fugitive emissions is significant considering that it was due to a single source only. Additional ozone would result from landfill gas leaks if there were outside emissions of ozone precursors. Emissions from mobile sources, for example, would tend to counteract the NOx-limited conditions assumed in this study and attribute more importance to methane as a radical extender, as well as to formaldehyde as a radical precursor. It is therefore plausible that the ozone increment of a large leak of landfill gas in a real-life setting could be several tenths of a ppb, a significant fraction of the ozone design value reductions needed to bring Southeast Michigan into attainment of the U.S. federal ozone standard. This is in addition to the ozone increment of around 1 ppb due solely to landfill combustion activities.
 +1 credit