Your browser does not fully support modern features. Please upgrade for a smoother experience.

Submitted Successfully!
Thank you for your contribution! You can also upload a video entry or images related to this topic.
For video creation, please contact our Academic Video Service.
| Version | Summary | Created by | Modification | Content Size | Created at | Operation |
|---|---|---|---|---|---|---|
| 1 | Cristina Andrade | + 3028 word(s) | 3028 | 2021-06-17 08:17:04 | | | |
| 2 | Amina Yu | -30 word(s) | 2998 | 2021-07-14 03:45:21 | | | | |
| 3 | Amina Yu | -1 word(s) | 2997 | 2021-07-14 10:18:32 | | |
Video Upload Options
We provide professional Academic Video Service to translate complex research into visually appealing presentations. Would you like to try it?
Cite
If you have any further questions, please contact Encyclopedia Editorial Office.
Andrade, C. Climate Change and Residential Buildings. Encyclopedia. Available online: https://encyclopedia.pub/entry/12036 (accessed on 07 February 2026).
Andrade C. Climate Change and Residential Buildings. Encyclopedia. Available at: https://encyclopedia.pub/entry/12036. Accessed February 07, 2026.
Andrade, Cristina. "Climate Change and Residential Buildings" Encyclopedia, https://encyclopedia.pub/entry/12036 (accessed February 07, 2026).
Andrade, C. (2021, July 13). Climate Change and Residential Buildings. In Encyclopedia. https://encyclopedia.pub/entry/12036
Andrade, Cristina. "Climate Change and Residential Buildings." Encyclopedia. Web. 13 July, 2021.
Copy Citation
Climate change is expected to influence cooling and heating energy demand of residential buildings and affect overall thermal comfort. Towards this end, the heating (HDD) and cooling (CDD) degree-days along with HDD + CDD were computed from an ensemble of seven high-resolution bias-corrected simulations attained from EURO-CORDEX under two Representative Concentration Pathways (RCP4.5 and RCP8.5) for mainland Portugal.
heating degree-day (HDD)
cooling degree-day (CDD)
climate change
projections
energy demand of residential buildings
Portugal
1. Introduction
Climate changes have a profound impact on natural [1] and human systems. The projected impacts of 1.5 °C global warming [2][3] will increase the intensity and frequency of some climatic and extreme weather events [4][5], which in turn will result in negative impacts on resources, biodiversity, and ecosystems [6].
Several regions are most vulnerable to these projected changes; this is the Mediterranean region’s case [2][7], including southern Europe in which Portugal is included. Since exposure to multiple and compound climate-related risks is projected to increase, assessing its impacts on human systems is highly relevant.
The projected rise in temperatures [8] is expected to pose greater risks to urban areas. The extent of the risk depends on human vulnerability (for example, elder citizens are more vulnerable to higher temperatures) and adaptation effectiveness, namely in the construction sector. Household residences are of special concern since about 65% of the time is spent inside residences; therefore, deviations in thermal comfort conditions can have detrimental impacts in citizens, as previously mentioned elders and also children who spend more than 90% of the time indoors [9]. The fluctuations in outdoor air temperatures [10] will have not only a substantial impact on human comfort, but also on building energy use [11] mainly in the existing residential buildings. Therefore, estimated air temperature fluctuation projections have relevant implications for estimating its future impacts on residential heating and cooling related energy demand.
Several studies used multiple methods to estimate future residential heating and cooling energy demand in buildings. While some authors choose simple approaches such as using current climate, discarding climate variability [12] or choosing a warm past year to represent a warming climate [13], others opt to use climate models using several datasets, namely global climate simulation models (GCMs) [11][14][15][16][17][18][19]. The most common methods used to determine residential demand in the future use parametric energy balance and degree-day methods. The degree-day method is a simple and widely used approach to relate outdoor temperature with the heating/cooling energy requirements.
In this study, we employed the degree-day method following the procedure used by Petri and Caldeira [16] and, later, by Spinoni et al. [11]. This methodology defines a base temperature (Tb) for the heating and cooling season and allows the computation of the respective outdoor air temperature deviations from maximum and minimum temperatures. The base temperature is a point at which internal gains equal the heat loss, acting as a threshold below (or above) which heating (or cooling) appliances are needed or not to operate to maintain indoor thermal comfort. Under the Portuguese Regulation on the Energy Performance of Residential Buildings (REPRS) [20][21], these temperatures are 18 °C related to the degrees-day of heating (HDD) and 25 °C to the degrees-day of cooling (CDD). Further details will be provided in the Materials and Methods section; however, it is worth mentioning that the REPRS is in line with the European Directive 2010/31/EC [22], which aims at reducing the greenhouse gas emissions by 20% by 2020 and in 80% until 2050, in relation to the 1990 emissions levels. Therefore, this objective includes the adoption of standard methodologies for calculating energy consumption, quality requirements for new and existing building envelopes, periodic inspection of boilers and air conditioning central systems, as well as building energy certification.
Three key energy performance indicators were computed in this work: the HDD, the CDD and the global indicator HDD + CDD, obtained from an ensemble mean of seven biased corrected regional climate models (RCMs) for mainland Portugal. Three-time periods were analyzed: 1971–2000 (the historical baseline climate), 2011–2040 and 2041–2070. For the latter periods, two representative concentration pathways (RCPs) were considered: a mitigated scenario RCP4.5 and the RCP8.5 unmitigated climate scenario [2]. For the trend analysis, 2011–2070 period is also assessed along with 2041–2070 and the entire period comprised between 1971 and 2070.
Typically, the data from ground stations are interpolated to estimate meteorological characteristics over larger regions. Spatial interpolation makes it possible to estimate any meteorological characteristic at locations away from those for which direct measurements exist. Inverse distance weighted (IDW), ordinary kriging (OK), and ordinary cokriging (OCK) are the most frequently used techniques in environmental studies for spatial interpolation of data [23][24][25][26][27][28]. Several geostatistical techniques were performed in this study to attain the most accurate spatial representation of the different indicators.
This study’s main goal is to analyze the impacts of climate change on heating or cooling related energy demand for residential buildings thermal comfort by computing HDD, CDD and HDD + CDD for five regions of the Nomenclature of Territorial Units for Statistics (NUTS) NUTS II of mainland Portugal (Figure 1). The results presented herein under RCP4.5 and RCP8.5 until 2070 will serve as an indicator of projected climate change and help policymakers improve laws that lead to more sustainable construction techniques in terms of mitigation and adaptation. Architects and building engineers can no longer assume a constant static condition for their designs and need to consider the values of design variables for future years.
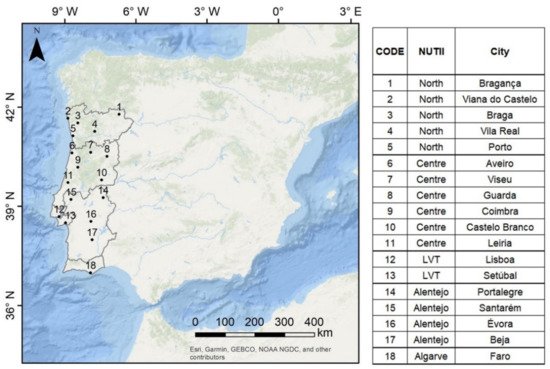
Figure 1. Portugal and NUTS II (grey area) location in the Iberian Peninsula.
2. Spatial Analysis of the Energy Indicators
An assessment of the spatial distribution of the historical baseline climate 1971–2000 was undertaken by the map based on the OK interpolated ensemble-means of HDD, CDD and HDD + CDD (Figure 2). Results show increasingly higher HDD values towards the north-eastern regions (values range between 786 and 2,755 °C × D per year), contrasting with the spatial distribution of CDD. This indicator, Figure 5b, shows a longitudinal contrast with increasingly higher values in inner central to southern Portugal with values ranging from 9 °C × D per year in the vicinity of the coastal and mountains to 239 °C × D per year. These results point out a stronger influence of oceanity-continentality factors when comparing with HDD (Figure 2a), for which a latitudinal contrast is prominent. Results also show that HDD(CDD) is higher(lower) in mountainous regions.
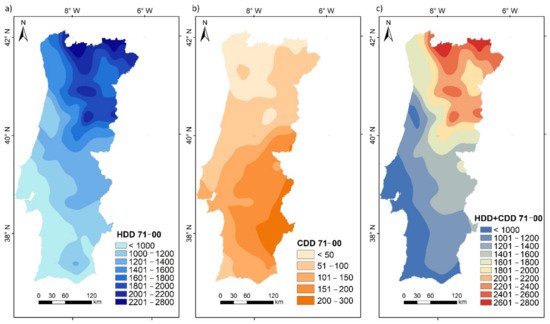
Figure 2. Mean values (in °C × D per year) of (a) HDD, (b) CDD, and (c) HDD + CDD for the historical period (1971–2000) from E-OBS for Portugal (OK interpolation).
Due to the differences in the magnitude of HDD and CDD and the fact that the HDD +CDD indicator is an unweighted sum, the spatial patterns resemble the ones observed for HDD (Figure 2c). In fact, for 1971–2000 the mean values for HDD were 1436 °C × D per year, 109 °C × D per year for CDD, and 1546 °C × D per year for HDD + CDD. Consequently, the map based on this interpolation (Figure 2c) shows larger values in the northern regions with high values in higher altitudes. This indicator’s values range from 880 to 2777 °C × D per year, with the low HDD + CDD values associated with a favorable balance between heating and cooling related energy demand (Figure 5c). These areas can be found near the coastal zones and in the southernmost regions. This composite index revealed spatial heterogeneity, with clear north–south and inner region contrasts that imply different energy needs to ensure thermal comfort. In fact, in the northern areas, the combined degree-day index increased, showing both cooling and heating related energy demands throughout the year.
The statistically significant HDD, CDD and HDD + CDD anomalies at a 5% significance level between the two future periods 2011–2040 and 2041–2070 under both emission scenarios RCP4.5 and RCP8.5 and the reference period (1971–2000) are presented in Figure 3 and Figure 4. It is worth mentioning that for all time-periods and under both RCPs the anomalies are statistically significant (gray pattern background in Figure 3 and Figure 4) for the entire country.
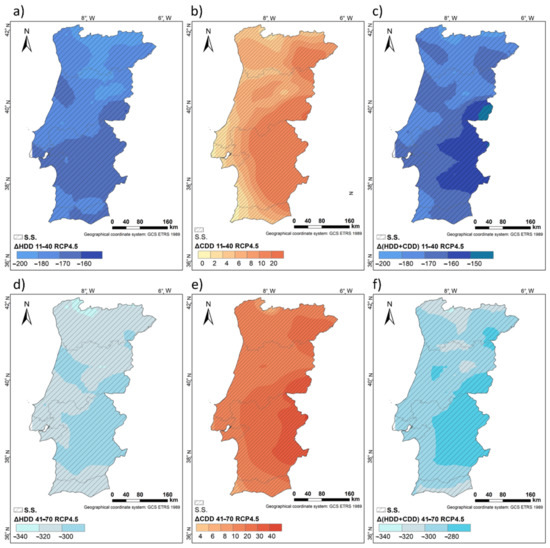
Figure 3. Statistically significant (S.S.) anomalies (Δ) in °C × D per year at a 5% significance level for (a,d) HDD, (b,e) CDD, and (c,f) HDD + CDD between 2011–2040 (upper) and 2041–2070 (lower) under RCP4.5. (Note that Δ = future period − 1971–2000).
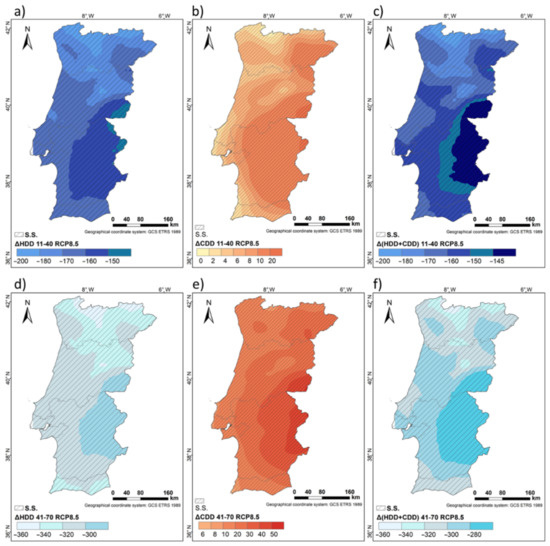
Figure 4. Statistically significant (S.S.) anomalies (Δ) in °C × D per year at a 5% significance level for (a,d) HDD, (b,e) CDD, and (c,f) HDD + CDD between 2011–2040 (upper) and 2041–2070 (lower) under RCP8.5. (Note that Δ = future period – 1971–2000).
Concerning HDD, results predict under both scenarios a spatial heterogeneity with statistically significant negative anomalies by 2011–2040 and 2041–2070 (Figure 3d and Figure 4d) throughout the country. This hints at different needs for heating demand depending on the region, and also to higher variability in projections for maximum and minimum temperature extremes between October and May under both RCPs. In absolute values, the RCP4.5 scenario projects variations from −300 to −280 HDD per year in Alentejo and −340 to −300 HDD per year in the remaining regions by 2041–2070 (Figure 3d). Conversely, for 2011–2040 under RCP4.5 results project higher needs in heating energy demand (Figure 3a) as expected. The HDD projected increase is higher in innermost regions in comparison with the reference period values, e.g., regions with higher HDD values. It is worth mentioning an exception in Serra da Estrela, for which the HDD was higher for 1971–2000; however, the projected future heating energy demands are not expected to increase in the same way compared to other inner regions.
For the CDD anomalies indicator, results predict an increase for all periods under both RCPs (Figure 3b,e and Figure 7b,e). The most significant rises are projected for the inland regions, particularly in Alentejo (in the southernmost inner region), for which in the reference period, the anomalies showed the highest values reaching 30 CDD per year (50 CDD per year) for 2011–2040 (2041–2070) under RCP4.5 (Figure 3b,e) and 30 CDD per year (60 CDD per year) for 2011–2040 (2041–2070) under RCP8.5 (Figure 4b,e). Furthermore, in absolute value the increase in CDD is projected to double by 2041–2070 under RCP8.5 in comparison with 2011–2040 under both RCPs.
The anomalies of the HDD + CDD indicator project a high spatial variability with negative values for Portugal again lower for 2041–2070 under both RCPs (Figure 3f and Figure 4f); in comparison with 2011–2040 (Figure 3c,f). Results show that the energy demand will increase mainly for 2041–2070 (Figure 3f and Figure 4c), for the inner areas, specifically in the innermost Alentejo and North regions. Conversely for Alentejo, the innermost northern regions present already the highest energy demand in the past (Figure 2c). Results also predict near the coast a slight decrease in the energy demand by 2011–2040 (Figure 3c and Figure 4c) under both RCPs, and by 2041–2070 that decrease is only projected for small areas in the Algarve Region. It is worth emphasizing that the amplitude of the HDD + CDD anomalies is higher for 2041–2070 under RCP8.5 (−360 to −260 °C × D per year).
3. Trend Analysis from 1971 Until 2070
Figure 5 and Figure 6 depict the statistically significant (at a 95% confidence level) linear trend values between 1971 and 2070 for the three energy performance indicators under RCP4.5 and RCP8.5. Three time periods were chosen: 2011–2070 (60‒year period) 2041–2070 (30‒year period), and 1971–2070 (100‒year period). It is worth mentioning that, when found, the statistically significant trends are represented by a grey area background in Figure 5 and Figure 6, and all linear trends are expressed for each indicator per year.
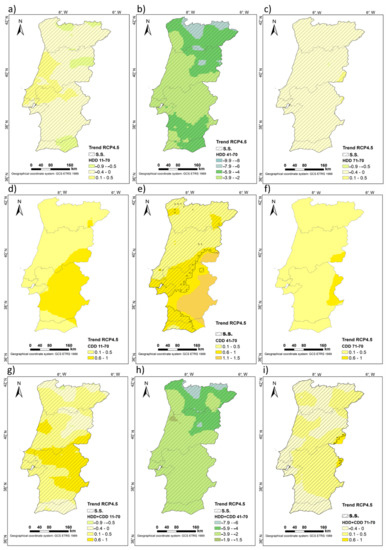
Figure 5. Statistically significant (S.S.) linear trends (at a 95% confidence level) of (a–c) HDD per year, (d–f) CDD per year, and (g,h,i) HDD + CDD per year under RCP4.5 for 2011–2070 (left), 2041–2070 (center) and 1971–2070 (right).
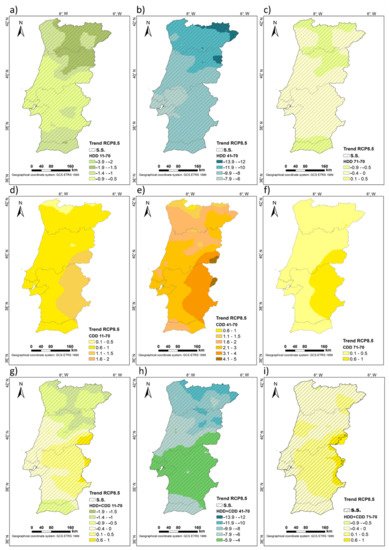
Figure 6. Statistically significant (S.S.) linear trends (at a 95% confidence level) of (a–c) HDD per year, (d–f) CDD per year, and (g–i) HDD + CDD per year under RCP8.5 for 2011–2070 (left), 2041–2070 (center) and 1971–2070 (right).
The projected decrease of HDD for Portugal is significantly larger for 2041–2070 under RCP8.5 (Figure 6b) than under RCP4.5 (Figure 5b). This statistically significant decrease is more pronounced towards North for all periods although with greater expression for 2041–2070 where values range from (−13.5 to −6 days per year) under RCP8.5 and (−9.9 to −2 days per year) under RCP4.5. Though statistically significant for the entire territory, between 2011–2070 and 1971–2070 these linear trends are smaller when comparing with the 2041–2070 period. Again, for these latter periods under RCP8.5, the trends are higher (Figure 6b).
Results show that these trends’ overall spatial distribution points to a decrease of energy demand to heat internal environments in Portugal, however in the northern-eastern regions the energy demand is higher in comparison with other regions and most significant under RCP8.5 (Figure 6a–c).
Conversely, it is projected an increase of CDD values for both scenarios; however, the only statistically significant linear trends were found for 2041–2070 under RCP4.5 (Figure 5e). Results suggest that the need for cooling is almost negligible for the remaining periods, though linear trend values are still considerably higher for 2041–2070 under RCP8.5. Under RCP4.5, statistically significant trends are found almost throughout the Portuguese territory for 2041–2070, as aforementioned, with values ranging between 0.1 and 2 CDD per year.
Given the results previously attained (Figure 5 and Figure 6), an analysis of the linear regression model of the area-mean values were undertaken for 2041–2070 under RCP4.5 (Figure 7). Results revealed an increasing tendency for CDD with a high correlation under RCP4.5 in clear accordance with the results shown in Figure 5e. Conversely, for both HDD and HDD + CDD weaker correlations are depicted, associated to decreasing linear trends at a 95% confidence level (Figure 7a,c). This hints at a statistically significant projected increase in the need for cooling for the mainland Portugal area for 2041–2070 under RCP4.5.
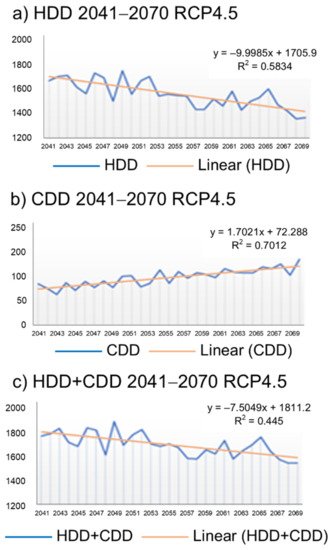
Figure 7. Annual ensemble-mean values of (a) HDD, (b) CDD, and (c) HDD + CDD for Portugal under RCP4.5 between 2041 and 2070 (blue lines) with the respective statistically significant linear trends (linear regression model equation and R2 coefficient) at a 95% confidence level (orange lines).
4. Case Study: NUTS II Regions
An analysis for a case study within the five NUTS II regions (Figure 1) was performed to get further insight regarding the projected cooling and heating related energy needs under future climate change conditions. Towards this aim, the evolution of the projected minimum, mean and maximum anomaly values was assessed for 2011–2040 and 2041–2070 under both RCPs by region (NUTS II) (Figure 1 and Figure 8). Overall, results show that regions with higher projected cooling or heating energy demands present higher increases under both RCPs until 2070. Therefore, it can be concluded that for CDD values although in future spatial distribution for 2011–2040 no significant trends are projected on a national scale under both RCPs, although, regarding absolute values on a regional scale, that might not be the case (Figure 8).
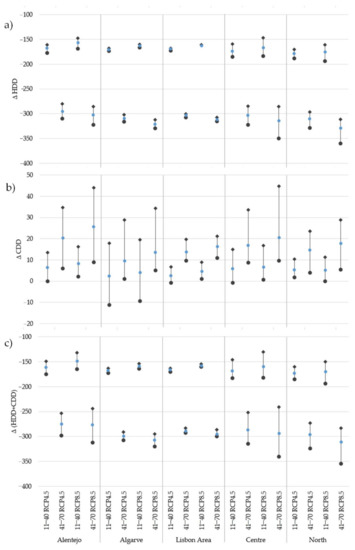
Figure 8. Mean (blue dot), Maximum (black square) and Minimum (black dot) values for the anomalies by region (NUTS II) for 2011–2040 and 2041–2070 and both emission scenarios. (a) HDD, (b) CDD, and (c) HDD + CDD in °C × D per year.
The inner-coastal contrasts are quite apparent for HDD and HDD + CDD anomalies in which Algarve and Lisbon Area (LVT in Figure 1) will present the smaller variations whereas Center region (a broader area that comprises Serra da Estrela and reaches the Spanish boarder, Figure 1) will present the highest amplitudes (Figure 8a,c). For CDD the lowest variations are projected for Lisbon Area, whereas the highest are depicted for Algarve (Figure 8b). It is projected for Alentejo the higher mean anomaly value of 25 CDD per year (Figure 8b) under RCP8.5. Overall, lower amplitudes are depicted for HDD and HDD + CDD anomalies in comparison with CDD anomalies. The low amplitudes found for all indicators in Lisbon Area (LVT in Figure 1), hint at maritime conditions’ influence to attenuate maximum and minimum contrasts in the future. It can be depicted in Figure 8 that these amplitudes (differences between maximum and minimum degree-day values) are predicted to be substantially higher for all indicators for 2041–2070, in which substantial lower ranges are projected for HDD and HDD + CDD(CDD) (Figure 8a,c) under RCP4.5; higher for CDD (Figure 8b). Overall, it can be predicted that all regions will present fewer heating energy demands for 2041–2070 when comparing with 2011–2040 under RCP4.5 (with higher anomalies under RCP8.5). Conversely, for all regions, it can be projected lesser energy demand for heating for both periods under RCP8.5.
For all regions CDD(HDD) anomalies are positive(negative) under both RCPs in clear accordance with Figure 3b,e and Figure 4b,e (Figure 3a,d and Figure 4a,d) pointing out to an increase(decrease) in the energy demand for cooling(heating) for both periods but higher under RCP8.5.
For each location within the five NUTS II regions a comparison between the historical period 1971–2000 and 2011–2070 and 2041–2070 (under both RCPs) was undertaken. HDD results revealed higher negative percentages for 2041–2070 when comparing with 2011–2040 also higher under RCP8.5 than RCP4.5 (Table 1). For 2041–2070 in Algarve and LVT regions projections present major values within the five regions, with Faro (−33.5% and −34.4%, under RCP4.5 and RCP8.5, respectively), Lisboa (−31.5% and −32.4%, under RCP4.5 and RCP8.5, respectively), and Setúbal (−30.9% and −31.8%, under RCP4.5 and RCP8.5, respectively) with the highest percentages, thus pointing out a decrease in heating energy demand in these locations. Conversely, projections for Bragança (−13.7% and −14.8%, under RCP4.5 and RCP8.5, respectively) in North and Guarda (−15.4% and −16.3%, under RCP4.5 and RCP8.5, respectively) in the Center reveal major heating requirements under both RCPs by 2041–2070. These results are quite similar for the ones projected for HDD + CDD, which is an indicator of locations that are thermally comfortable, with low heating and cooling energy demand. For this indicator, the Center and North regions present the lowest percentages projections again within the five regions for 2041–2070 under RCP4.5. Like previously, for Bragança (−12.8% and −13.9%, under RCP4.5 and RCP8.5, respectively) in North and Guarda (−14.3% and −15%, under RCP4.5 and RCP8.5, respectively) in Center lowest percentages are projected. Finally, regarding CDD, high positive percentages are projected for 2041–2070 under RCP8.5. For this indicator, the highest percentages are in the North and Center regions; namely, with projected percentages above 30% in Bragança (33.6% and 39.6%, under RCP4.5 and RCP8.5, respectively), Viana do Castelo (33.5% under RCP8.5), Braga (35% under RCP8.5), Vila Real (34.7% and 41.4%, under RCP4.5 and RCP8.5, respectively), Porto (32.2% under RCP8.5), and Guarda (32.5% under RCP8.5). These results predicted an increase of cooling requirements for these locations, whilst for Faro (5.3% and 10.1%, under RCP4.5 and RCP8.5, respectively) in Algarve (southern region of Portugal), the lower values were depicted for both RCPs and both periods.
Table 1. Anomalies in °C × D per year for HDD, CDD and HDD + CDD between 2011–2040 and 2041–2070 (under both RCPs) and 1971–2000 (historical period) for the city locations in NUTS II listed in Figure 1.
| City | HDD | CDD | HDD+CDD | ||||||||||||
|---|---|---|---|---|---|---|---|---|---|---|---|---|---|---|---|
| Value | Anomalies | Value | Anomalies | Value | Anomalies | ||||||||||
| 71–00 | RCP4.5 | RCP8.5 | 71–00 | RCP4.5 | RCP8.5 | 71–00 | RCP4.5 | RCP8.5 | |||||||
| 11–40 | 41–70 | 11–40 | 41–70 | 11–40 | 41–70 | 11–40 | 41–70 | 11–40 | 41–70 | 11–40 | 41–70 | ||||
| 1 | 2301 | −8.0% | −13.7% | −7.8% | −14.8% | 42 | 10.7% | 33.6% | 11.1% | 39.6% | 2344 | −7.6% | −12.8% | −7.6% | −13.9% |
| 2 | 1531 | −11.4% | −20.0% | −11.1% | −20.7% | 47 | 9.4% | 27.1% | 8.5% | 33.5% | 1579 | −10.8% | −18.6% | −10.8% | −19.1% |
| 3 | 1546 | −11.1% | −19.7% | −11.0% | −20.4% | 49 | 10.1% | 27.8% | 8.5% | 35.0% | 1590 | −10.5% | −18.3% | −10.5% | −18.7% |
| 4 | 2116 | −8.6% | −14.9% | −8.5% | −16.0% | 38 | 11.7% | 34.7% | 9.7% | 41.4% | 2156 | −8.3% | −14.0% | −8.3% | −15.0% |
| 5 | 1589 | −11.1% | −19.3% | −10.9% | −20.0% | 44 | 8.3% | 26.7% | 7.0% | 32.2% | 1632 | −10.6% | −18.0% | −10.6% | −18.6% |
| 6 | 1122 | −14.9% | −26.6% | −14.7% | −27.7% | 69 | 6.4% | 20.3% | 5.9% | 21.8% | 1188 | −13.7% | −23.9% | −13.7% | −24.9% |
| 7 | 1715 | −10.3% | −17.9% | −9.9% | −18.6% | 69 | 8.2% | 22.7% | 8.7% | 28.3% | 1797 | −9.5% | −16.2% | −9.5% | −16.7% |
| 8 | 2020 | −9.0% | −15.4% | −8.7% | −16.3% | 57 | 9.4% | 26.6% | 10.7% | 32.5% | 2076 | −8.5% | −14.3% | −8.5% | −15.0% |
| 9 | 1132 | −14.8% | −26.0% | −14.3% | −27.0% | 92 | 5.5% | 17.9% | 5.9% | 19.6% | 1222 | −13.3% | −22.8% | −13.3% | −23.5% |
| 10 | 1371 | −12.2% | −21.5% | −11.2% | −21.6% | 170 | 6.6% | 15.4% | 7.3% | 20.5% | 1538 | −10.1% | −17.5% | −10.1% | −17.1% |
| 11 | 1167 | −15.1% | −26.0% | −14.6% | −27.0% | 71 | 3.9% | 18.7% | 4.8% | 19.7% | 1244 | −13.9% | −23.3% | −13.9% | −24.2% |
| 12 | 961 | −17.6% | −31.5% | −16.9% | −32.4% | 116 | 2.1% | 11.6% | 3.9% | 13.9% | 1077 | −15.5% | −26.9% | −15.5% | −27.5% |
| 13 | 983 | −17.2% | −30.9% | −16.5% | −31.8% | 138 | 2.1% | 10.4% | 3.6% | 12.2% | 1120 | −14.8% | −25.8% | −14.8% | −26.3% |
| 14 | 1391 | −11.7% | −20.2% | −10.8% | −20.6% | 146 | 6.8% | 16.6% | 7.6% | 21.8% | 1535 | −10.0% | −16.7% | −10.0% | −16.5% |
| 15 | 1074 | −16.0% | −28.1% | −15.3% | −28.8% | 130 | 3.6% | 13.1% | 4.9% | 15.7% | 1205 | −13.9% | −23.6% | −13.9% | −24.0% |
| 16 | 1230 | −13.6% | −23.6% | −12.6% | −24.2% | 160 | 4.5% | 13.1% | 5.6% | 16.9% | 1390 | −11.6% | −19.3% | −11.6% | −19.4% |
| 17 | 1054 | −15.6% | −28.0% | −14.6% | −28.5% | 204 | 3.3% | 11.1% | 4.5% | 14.1% | 1258 | −12.5% | −21.6% | −12.5% | −21.6% |
| 18 | 929 | −18.2% | −33.5% | −17.5% | −34.4% | 122 | 2.2% | 5.3% | 3.5% | 10.1% | 1044 | −15.9% | −28.9% | −15.9% | −29.3 |
References
- Andrade, C.; Contente, J. Climate change projections for the Worldwide Bioclimatic Classification System in the Iberian Peninsula until 2070. Int. J. Climatol. 2020, 40, 5863–5886.
- Climate Change 2014: Synthesis Report. Contribution of Working Groups I, II and III to the Fifth Assessment Report of the Intergovernmental Panel on Climate Change; Pachauri, R.K.; Meyer, L.A. (Eds.) IPCC: Geneva, Switzerland, 2014; p. 151.
- Hoegh-Guldberg, O.; Jacob, D.; Bindi, M.; Brown, S.; Camilloni, I.; Diedhiou, A.; Djalante, R.; Ebi, K.; Engelbrecht, F.; Giout, J.; et al. Impacts of 1.5 °C global warming on natural and human systems. In Global Warming of 1.5 °C. An IPCC Special Report on the Impacts of Global Warming of 1.5 °C Above Pre-Industrial Levels and Related Global Greenhouse Gas Emission Pathways, in the Context of Strengthening the Global Response to the Threat of Climate Change, Sustainable Development, and Efforts to Eradicate Poverty; Masson-Delmotte, V., Zhai, P., Pörtner, H.O., Roberts, D., Skea, J., Shukla, P.R., Pirani, A., Moufouma-Okia, W., Péan, C., Pidcock, R., et al., Eds.; IPCC: Geneva, Switzerland, 2018.
- Santos, M.; Fonseca, A.; Fragoso, M.; Santos, J.A. Recent and future changes of precipitation extremes in mainland Portugal. Theor. Appl. Climatol. 2019, 137, 1305–1319.
- Viceto, C.; Pereira, S.C.; Rocha, A. Climate Change Projections of Extreme Temperatures for the Iberian Peninsula. Atmosphere 2019, 10, 229.
- Andrade, C.; Rodrigues, S.; Corte-Real, J.A. Preliminary assessment of flood hazard in Nabão River basin using an analytical hierarchy process. AIP Conf. Proc. 2018, 1978.
- Diffenbaugh, N.S.; Giorgi, F. Climate change hotspots in the CMIP5 global climate model ensemble. Clim. Chang. 2012, 114, 813–822.
- Andrade, C.; Fraga, H.; Santos, J.A. Climate change multi-model projections for temperature extremes in Portugal. Atmos. Sci. Lett. 2014, 15, 149–156.
- Andargie, M.S.; Touchie, M.; O’Brien, W. A review of factors affecting occupant comfort in multi-unit residential buildings. Build. Environ. 2019, 160, 106182.
- Fonseca, A.; Santos, J.A. High resolution temperature datasets in Portugal from a geostatistical approach: Variability and extremes. J. Appl. Meteor. 2018, 57, 627–644.
- Spinoni, J.; Vogt, J.V.; Barbosa, P.; Dosio, A.; McCormick, N.; Bigano, A.; Füssel, H.-M. Changes of heating and cooling degree-days in Europe from 1981 to 2100. Int. J. Climatol. 2018, 38, e191–e208.
- Yuan, S.; Stainsby, W.; Li, M.; Xu, K.; Waite, M.; Zimmerle, D.; Feiock, R.; Ramaswami, A.; Modi, V. Future energy scenarios with distributed technology options for residential city blocks in three climate regions of the United States. Appl. Energy 2019, 237, 60–69.
- van Hooff, T.; Blocken, B.; Hensen, J.L.M.; Timmermans, H.J.P. On the predicted effectiveness of climate adaptation measures for residential buildings. Build. Environ. 2015, 83, 142–158.
- Semmler, T.; McGrath, R.; Steele-Dunne, S.; Hanafin, J.; Nolan, P.; Wang, S. Influence of climate change on heating and cooling demand in Ireland. Int. J. Climatol. 2010, 30, 1502–1511.
- Lee, K.; Baek, H.; Cho, C. The estimation of base temperature for heating and cooling degree-days for South Korea. J. Appl. Meteor. 2013, 53, 300–309.
- Petri, Y.; Caldeira, K. Impacts of global warming on residential heating and cooling degree-days in the United States. Sci. Rep. 2015, 5, 12427.
- Wang, H.; Chen, Q. Impacts of climate change heating and cooling energy use in buildings in the United States. Energ. Build. 2014, 82, 428–436.
- Benestad, R.E. Heating Degree Day, Cooling Degree Days, and Precipitation in Europe. Norwegian Meteorological Institute. 2008. Available online: (accessed on 30 October 2020).
- Aebischer, B.; Catenazzi, G.; Jakob, M. Impact of Climate Change on Thermal Comfort, Heating and Cooling Energy Demand in Europe. ECEE 2007 Summer Study. 2007. Available online: (accessed on 7 October 2020).
- Regulation for Energy Performance of Residential Buildings (REPRS in Portuguese). Presidency of the Council of Ministers, Decree-Law 118/2013—Order No 15793-I/2013. Available online: (accessed on 1 October 2020).
- Aguiar, R.; Goncalves, H. Climatologia e Anos Meteorológicos de Referência para o Sistema Nacional de Certificação de Edifícios (Versão 2013); Relatório para ADENE—Agência de Energia; Laboratório Nacional de Energia e Geologia, I.P.: Lisabon, Portugal, 2013; 55p.
- CEC. Energy performance of building directive, Directive 2010/31/EU. Off. J. Eur. Communities 2010, 3, 13–35.
- Goovaerts, P. Geostatistics for Natural Resources Evaluation; Oxford University Press: New York, NY, USA, 1997.
- Hartkamp, A.D.; de Beurs, K.; Stein, A.; White, J.W. Interpolation Techniques for Climate Variables; CIMMYT: Texcoco, Mexico, 1999.
- Goovaerts, P. Geostatistical approaches for incorporating elevation into the spatial interpolation of rainfall. J. Hydrol. 2000, 228, 113–129.
- Brown, D.P.; Comrie, A.C. Spatial modelling of winter temperature and precipitation in Arizona and New Mexico, USA. Clim. Res. 2002, 22, 115–128.
- Lloyd, C.D. Assessing the effect of integrating elevation data into the estimation of monthly precipitation in Great Britain. J. Hydrol. 2005, 308, 128–150.
- Bilgili, B.C.; Erşahin, S.; Özyavuz, M. Spatial Prediction of air temperature in east central Anatolia of Turkey. ISPRS Ann. Photogramm. Remote Sens. Spatial Inf. Sci. 2017, IV-4/W4, 153–159.
More
Information
Subjects:
Meteorology & Atmospheric Sciences
Contributor
MDPI registered users' name will be linked to their SciProfiles pages. To register with us, please refer to https://encyclopedia.pub/register
:
View Times:
1.2K
Revisions:
3 times
(View History)
Update Date:
14 Jul 2021
Notice
You are not a member of the advisory board for this topic. If you want to update advisory board member profile, please contact office@encyclopedia.pub.
OK
Confirm
Only members of the Encyclopedia advisory board for this topic are allowed to note entries. Would you like to become an advisory board member of the Encyclopedia?
Yes
No
${ textCharacter }/${ maxCharacter }
Submit
Cancel
Back
Comments
${ item }
|
More
No more~
There is no comment~
${ textCharacter }/${ maxCharacter }
Submit
Cancel
${ selectedItem.replyTextCharacter }/${ selectedItem.replyMaxCharacter }
Submit
Cancel
Confirm
Are you sure to Delete?
Yes
No


