Your browser does not fully support modern features. Please upgrade for a smoother experience.
Submitted Successfully!
 +1 credit
Thank you for your contribution! You can also upload a video entry or images related to this topic.
For video creation, please contact our Academic Video Service.
| Version | Summary | Created by | Modification | Content Size | Created at | Operation |
|---|---|---|---|---|---|---|
| 1 | Nesrein Hashem | + 1771 word(s) | 1771 | 2021-07-12 05:49:47 | | | |
| 2 | Dean Liu | Meta information modification | 1771 | 2021-07-12 09:53:13 | | |
Video Upload Options
We provide professional Academic Video Service to translate complex research into visually appealing presentations. Would you like to try it?
Cite
If you have any further questions, please contact Encyclopedia Editorial Office.
Hashem, N. Cleome droserifolia (Forssk.) Del.. Encyclopedia. Available online: https://encyclopedia.pub/entry/11944 (accessed on 07 February 2026).
Hashem N. Cleome droserifolia (Forssk.) Del.. Encyclopedia. Available at: https://encyclopedia.pub/entry/11944. Accessed February 07, 2026.
Hashem, Nesrein. "Cleome droserifolia (Forssk.) Del." Encyclopedia, https://encyclopedia.pub/entry/11944 (accessed February 07, 2026).
Hashem, N. (2021, July 12). Cleome droserifolia (Forssk.) Del.. In Encyclopedia. https://encyclopedia.pub/entry/11944
Hashem, Nesrein. "Cleome droserifolia (Forssk.) Del.." Encyclopedia. Web. 12 July, 2021.
Copy Citation
The antioxidant, antimicrobial, and immunomodulatory activities of the Cleome droserifolia (Forssk.) Del. (Cd) shrub were investigated considering the biological activity of its phytogenic compounds.
phytogenic
phenols
antioxidant
antimicrobial activity
immunity
1. Introduction
Medicinal plants can serve as a natural source of therapeutic drugs, nutraceuticals/food supplements, and feed additives that can be safely used to improve human and animal health. The interest in exploring plants as a new source of different drugs, specifically antimicrobials, has increased in recent decades as an attempt to fight multidrug-resistant bacteria [1][2]. Among the medicinal plants, the Cleome genus is one of the largest genera belonging to the family Cleomaceae. This genus encompasses about 180–200 species that are geographically distributed in Egypt, Libya, Palestine, Syria, and other arid and semi-arid regions [3]. Moreover, they are perennial, low, and aromatic cushion-like shrubs with a length of 25–60 cm that exhibit intricately branched stems and broad oval-shaped, three-nerved leaves with swollen glandular hairs [3][4]. The shrubs that belong to this genus have medicinal and ecological importance. Cleome genus shrubs are well-known in folk medicine for treating stomachache, skin allergies, and open wounds, as well as for exhibiting anticancer and hepatoprotective properties [5][6][7]. In addition, Cleome genus shrubs have shown strong antidiabetic properties; the aqueous extract of Cleome has been found to contain a very high percentage of flavonols that showed 63.3% activity, similar to that of the metformin synthetic drug [8]. Cleome genus shrubs have antioxidant, antiparasitic, and antimicrobial activities [6]. These biological effects are related to the vast array of secondary metabolites that occur naturally in Cleome genus shrubs. Several terpenes, flavonoids, glucosinolates, anthocyanin alkaloids, and polyphenols have been isolated from Cleome genus shrubs [3]. Given these biological activities of Cleome genus shrubs, additional studies are required to explore the active secondary metabolites of these shrubs and their eligibility to innovate natural feed and food supplements that could be applied for improving animal and human health.
2. RP-HPLC Assessment of Total Phenol and Flavonoid Contents and Phenolic Compound Profile
The values of TPC and TFC of the Cd methanolic extract were 32.55- ± 2.26-mg GA/g DM and 12.78- ±1.86-mg CAT/g DM, respectively (Table 1). The phenolic profile of the Cd methanolic extract detected by RP-HPLC is shown in Table 1. These results revealed that, among the 16 phenolic compounds identified here, the most abundant phenolic compounds, ranging between 1460.62 and 7657.15 μg/g DM, were benzoic acid, rutin, ellagic acid, naringenin, and o-coumaric acid. The second-most abundant phenolic compounds, ranging between 432.14 and 264.06 μg/g DM, were rosmarinic acid, p-hydroxybenzoic acid, resveratrol, kaempferol, quercetin, and ferulic acid. The third-most abundant phenolic compounds were caffeic acid, p-coumaric acid, chlorogenic acid, catechin, syringic acid, and catechin, which were detected in low quantities, ranging between 10.43 and 59.59 μg/g DM.
Table 1. Contents of the total phenolic, total flavonoid, and individual phenolic compounds (as detected by reverse-phase high-performance liquid chromatography; RP-HPLC) in the Cleome droserifolia (Forssk.) Del. methanolic extract (Cd extract).
| Analysis | Content |
|---|---|
| Total phenols (mean ± SE, mg GA equivalent/g DM) | 32.55 ± 0.23 |
| Total flavonoids (mean ± SE, mg CAT equivalent/g DM) | 12.78 ± 0.19 |
| Individual detected phenolic compounds (µg/g DM) | |
| Benzoic acid | 7657.15 |
| Rutin | 2987.63 |
| Ellagic acid | 1641.98 |
| Naringenin | 1516.25 |
| o-Coumaric acid | 1460.62 |
| Rosmarinicacid | 955.27 |
| p-Hydroxybenzoic acid | 924.57 |
| Resveratrol | 895.77 |
| Kaempferol | 778.80 |
| Quercetin | 432.14 |
| Ferulic acid | 264.06 |
| Caffeic acid | 59.59 |
| p-Coumaric acid | 39.55 |
| Chlorogenic acid | 29.33 |
| Syringic acid | 19.29 |
| Catechin | 10.43 |
GA = gallic acid, CAT = catechol, and DM = dry matter.
3. Antioxidant Activity of the Cd Extract
The antiradical capacity (scavenging activity) of the Cd methanolic extract, as determined by the DPPH and ABTS colorimetric tests, is shown in Table 2. The percent inhibition values of the Cd extract were not much greater than those of the standard antioxidant (ascorbic acid). The Cd extract showed a linear increase in the DPPH and ABTS radical scavenging activities with increasing concentrations, reaching 66.09% ± 1.92% and 81.14% ± 1.26% scavenging activity for DPPH and ABTS, respectively, at concentrations of 1000 μg/mL vs. 87.52% ± 0.62% and 92.44% ± 0.14% for ascorbic acid. The half-maximal inhibitory concentration (IC50) of the Cd extract was 470.27 ± 2.24 μg/mL for DPPH and 387.53 ± 3.11 μg/mL for ABTS vs. 16.62 ± 0.91 μg/mL and 14.03 ± 0.67 μg/mL for ascorbic acid, respectively.
Table 2. Antioxidant activity of the Cleome droserifolia (Forssk.) Del. methanolic extract (Cd extract), as assessed by the 2,2-diphenyl-1-picrylhydrazyl (DPPH) and 2,2′-azino-bis (3-ethylbenzothiazoline-6-sulfonic acid (ABTS) tests.
| Antioxidant Concentration (µg/mL) | DPPH Scavenging Activity, % | ABTS Scavenging Activity, % | ||
|---|---|---|---|---|
| Cd Extract | Ascorbic Acid | Cd Extract | Ascorbic Acid | |
| 7.81 | 12.87± 0.91 b | 62.66 ± 0.12 a | 23.16 ± 0.76 b | 64.58 ± 0.24 a |
| 15.6 | 16.03 ± 0.84 b | 75.68 ± 0.45 a | 25.09 ± 0.84 b | 76.10 ± 0.92 a |
| 31.25 | 26.88 ± 0.86 b | 77.6 ± 0.86 a | 34.16 ± 0.92 b | 80.21 ± 1.04 a |
| 62.5 | 31.45 ± 1.12 b | 79.11 ± 1.14 a | 43.79 ± 1.16 b | 82.30 ± 0.86 a |
| 125 | 34.56 ± 1.24 b | 80.20 ± 0.88 a | 49.28 ± 1.13 b | 85.12 ± 0.45 a |
| 250 | 46.87 ± 1.16 b | 83.2 ± 0.62 a | 54.03 ± 0.76 b | 88.07 ± 0.93 a |
| 500 | 53.16 ± 0.85 b | 85.4 ± 0.56 a | 64.51 ± 0.85 b | 89.02 ± 0.88 a |
| 1000 | 66.09 ± 1.92 b | 87.52 ± 0.62 a | 81.14 ± 1.26 b | 92.44 ± 0.14 a |
| Half-maximal inhibitory concentration | ||||
| (IC50) (μg/mL) | 470.27 ± 2.24 a | 16.62 ± 0.91 b | 387.53 ± 3.11 a | 14.03 ± 0.67 b |
The mean values indicated in the same rows within variable with different superscripts (a and b) were significantly different (p < 0.05).
4. In Vitro Antimicrobial Activity
The methanolic extract of Cd exhibited striking inhibitory actions against Staphylococcus aureus NCTC 10788, Salmonella senftenberg ATCC 8400, Escherichia coli BA 12296, and Candida albicans ATCC MAY-2876 (Table 3 and Figure 2). Conversely, the Cd extract was inactive against Lissteria monocytogenes ATCC 19116 (Table 3 and Figure 2).
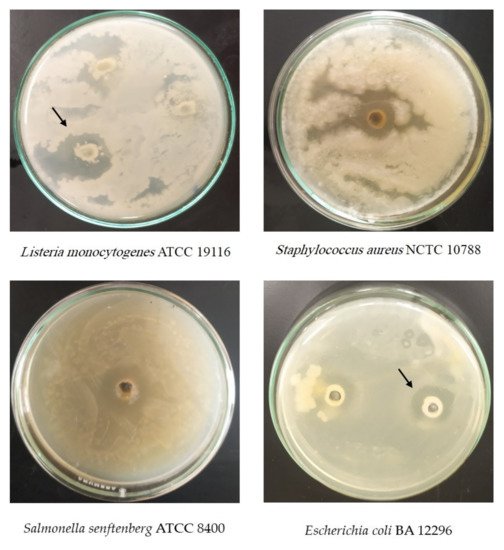
Figure 2. Antimicrobial activity of Cleome droserifolia (Forssk.) Del. extract against pathogenic microorganisms.
Table 3. In vitro antimicrobial activity of Cleome droserifolia (Forssk.) Del. against pathogenic microorganisms.
| Pathogens Microorganisms | Inhibition Zone (mm) |
|---|---|
| Staphylococcus aureus NCTC 10788 | 15.63 ± 1.30 a |
| Salmonella senftenberg ATCC 8400 | 12.70 ± 0.81 a |
| Escherichia coli BA 12296 | 8.06 ± 1.72 b |
| Candida albicans ATCC MYA-2876 | 7.16 ± 2.92 b |
| Listeria monocytogenes ATCC 19116 | NI |
NI, no inhibitory action.
5. Effect of Treatment on Weight, Feed Intake, and Health Indicators in Rabbits
The treatments with different concentrations of Cd (0, 1.25, or 2.5 g/kg of DM diet) did not affect the overall mean body weight and feed intake of rabbits during the 30-day experimental period (Table 4). The treatment with Cdh tended (p < 0.085) to decrease the fecal score compared with the other treatments (Table 4). Compared with the control, the two concentrations of Cd decreased significantly the overall mean rectal temperature (Table 4).
Table 4. Body weight, feed intake, fecal score, and rectal temperature of rabbits treated with different concentrations of Cleome droserifolia (Forssk.) Del. (Cd) (0: C, Cdl: 1.25 g/kg of DM diet, or Cdh: 2.5 g/kg of DM diet).
| Treatment | Variable (Mean± Standard Error of the Mean, n = 10/Treatment) | |||
|---|---|---|---|---|
| Body Weight, g | Feed Intake, g/day | Fecal Score | Rectal Temperature, °C | |
| C | 1454 ± 37.01 | 99.47 ± 17.36 | 1.19 ± 0.083 | 39.07 ± 0.112 a |
| Cdl | 1413 ± 33.75 | 100.06 ± 15.88 | 1.21 ± 0.073 | 38.80 ± 0.091 b |
| Cdh | 1393 ± 37.82 | 99.14 ± 17.31 | 1.13 ± 0.063 | 38.74 ± 0.123 b |
| p-Value | 0.478 | 0.968 | 0.085 | 0.007 |
The mean values indicated in the same columns with different superscripts (a and b) were significantly different (p < 0.05).
6. Effect of Treatment on Hemato-Chemistry and Redox Status
The hematological attributes, blood plasma metabolites, and antioxidant activity of rabbits treated with different concentrations of Cd (0, 1.25, or 2.5 g/kg of DM diet) are shown in Table 5. No differences were observed for any of the variables at day 0, confirming the homogeneity of the experimental groups before the beginning of the treatment. At day 30 (the end of the experimental period), the treatment had not affected the hematological attributes or blood plasma metabolites. However, both concentrations of Cd significantly increased the levels of the total antioxidant activity and significantly decreased the levels of malondialdehyde in the blood plasma.
Table 5. Hematological attributes, blood plasma metabolites, and antioxidant activity of rabbits treated with different concentrations of Cleome droserifolia (Forssk.) Del. (Cd) (0: C, Cdl: 1.25 g/kg of DM diet, or Cdh: 2.5 g/kg of DM diet).
| Treatment | Variable (Mean± Standard Error of the Mean, n = 6) | |||||||
|---|---|---|---|---|---|---|---|---|
| Red Blood Cell Count (106/mL) | Packed Cell Volume(%) |
Hemoglobin, g/dL | Total Protein, g/dL |
Albumin, g/dL |
Glucose, mg/dL |
Total Antioxidant Capacity, Mm/L |
Malondialdehyde, nmol/mL | |
| At day 0 | ||||||||
| C | 6.31 ± 1.01 | 32.67 ± 2.45 | 10.16 ± 0.32 | 6.34 ± 0.15 | 4.37 ± 0.11 | 93.61 ± 2.27 | 492.75 ± 0.53 | 5.23 ± 0.43 |
| Cdl | 5.85 ± 1.09 | 33.05 ± 3.45 | 10.79 ± 0.58 | 6.72 ± 0.19 | 4.01 ± 0.07 | 91.51 ± 1.15 | 425.40 ± 1.64 | 4.92 ± 0.06 |
| Cdh | 6.36 ± 0.97 | 34.45 ± 3.47 | 10.58 ± 0.79 | 6.65 ± 0.27 | 4.08 ± 0.12 | 93.31 ± 1.24 | 430.23 ± 1.59 | 5.20 ± 0.13 |
| p-Value | 0.764 | 0.947 | 0.764 | 0.742 | 0.641 | 0.369 | 0.4752 | 0.379 |
| At day 30 | ||||||||
| C | 5.94 ± 1.21 | 31.35 ± 3.72 | 10.91 ± 0.67 | 6.44 ± 0.23 | 4.37 ± 0.24 | 91.92 ± 1.01 | 440.40 ± 0.30 b | 4.19 ± 0.25 a |
| Cdl | 5.85 ± 0.98 | 30.37 ± 1.99 | 10.91 ± 0.37 | 6.28 ± 0.24 | 4.59 ± 0.06 | 91.56 ± 1.62 | 444.09 ± 0.95 a | 3.83 ± 0.04 b |
| Cdh | 5.61 ± 1.23 | 30.01± 2.01 | 9.86± 0.34 | 6.14 ± 0.11 | 4.38 ± 0.15 | 92.41 ± 0.97 | 443.37 ± 0.92 a | 3.73 ± 0.04 b |
| p-Value | 0.967 | 0.641 | 0.143 | 0.281 | 0.287 | 0.258 | 0.034 | 0.002 |
Mean values indicated in the same columns with different superscripts (a and b) were significantly different (p < 0.05).
7. Effect of Treatment on Immune Indicators
7.1. Innate Immune System
The innate immune indicators of rabbits treated with different concentrations of Cd (0, 1.25, or 2.5 g/kg of DM diet) are shown in Table 6. No differences were observed for any of the variables at day 0, confirming the homogeneity of the experimental groups before the beginning of the treatment. At day 30 (the end of the experimental period), the treatment had not affected the white blood cell count/differential count, PI, or PA. The treatment with Cdh significantly increased the blood plasma lysozyme activity compared with the C and Cdl treatments. Moreover, the treatment with Cdh significantly decreased the levels of interleukin-β1 in the blood plasma compared with the C treatment, whereas Cdl yielded an intermediate value.
Table 6. Innate immune indicators of rabbits treated with different concentrations of Cleome droserifolia (Forssk.) Del. (Cd) (0: C, Cdl: 1.25 g/kg of DM diet, or Cdh: 2.5 g/kg of DM diet).
| Treatment | Variable (Mean± Standard Error of the Mean, n = 6) | ||||||||
|---|---|---|---|---|---|---|---|---|---|
| White Blood Cells, 103/mm3 |
Lymphocytes, % |
Neutrocytes, % |
Echinocytes, % |
Monocytes, % |
Phagocytic Index |
Phagocytic Activity, % | Lysozyme Activity, U/mL |
Interleukin-β1, pg/mL | |
| At day 0 | |||||||||
| C | 7.29 ± 1.26 | 39.90 ±1.28 | 38.85 ± 2.33 | 12.49 ± 0.78 | 13.18 ± 2.00 | 1.94 ± 0.27 | 24.90 ± 1.24 | 0.113 ± 0.37 | 16.91 ± 0.34 |
| Cdl | 6.47 ± 0.88 | 38.88 ± 1.91 | 33.75 ± 5.29 | 10.79 ± 1.18 | 11.65 ± 2.61 | 2.04 ± 0.13 | 19.39 ± 0.80 | 0.092 ± 0.01 | 15.21 ± 0.72 |
| Cdh | 6.33 ± 1.42 | 38.71 ± 1.99 | 37.59 ± 3.32 | 10.12 ± 1.09 | 12.91 ± 0.69 | 1.96 ± 0.41 | 20.95 ± 0.12 | 0.101 ± 0.01 | 15.74 ± 0.82 |
| p-Value | 0.560 | 0.240 | 0.338 | 0.327 | 0.679 | 0.804 | 0.258 | 0.175 | |
| At day 30 | |||||||||
| C | 6.49 ± 0.84 | 39.56 ± 1.32 | 32.69 ± 1.35 | 11.74 ± 0.52 | 13.22 ± 1.20 | 2.10 ± 0.35 | 20.56 ± 1.63 | 0.104 ± 0.02 b | 18.66 ± 0.22 a |
| Cdl | 6.33 ± 0.56 | 42.01 ± 1.68 | 33.65 ± 3.05 | 10.22 ± 0.65 | 11.28 ± 1.53 | 2.19 ± 0.54 | 20.63 ± 1.01 | 0.106 ± 0.12 b | 17.01 ± 0.81 ab |
| Cdh | 6.02 ± 1.40 | 44.52 ± 1.21 | 37.63 ± 1.92 | 11.51 ± 0.89 | 10.97 ± 1.37 | 2.49 ± 0.24 | 21.2 ± 2.01 | 0.142 ± 0.01 a | 15.25 ± 0.92 b |
| p-Value | 0.449 | 0.123 | 0.236 | 0.531 | 0.195 | 0.446 | 0.561 | 0.046 | 0.001 |
Mean values indicated in the same columns with different superscripts (a and b) were significantly different (p < 0.05).
7.2. Humoral Immune System
The humoral immune indicators of rabbits treated with different concentrations of Cd (0, 1.25, or 2.5 g/kg of DM diet) are shown in Table 7. No differences were observed for any of the variables at day 0, confirming the homogeneity of the experimental groups before the beginning of the treatment. At day 30 (the end of the experimental period), the two concentrations of Cd had significantly increased the levels of IgG in the blood plasma compared with the control. Conversely, the treatments did not affect the levels of IgA and IgE in the blood plasma.
Table 7. Humoral immune indicators (immunoglobulins (Igs)) of rabbits treated with different concentrations of Cleome droserifolia (Forssk.) Del. (Cd) (0: C, Cdl: 1.25 g/kg of DM diet, or Cdh: 2.5 g/kg of DM diet).
| Treatment | Variable (Mean± Standard Error of the Mean, n = 6) | ||
|---|---|---|---|
| IgG, mg/dL | IgA, mg/dL | IgE, mg/dL | |
| At day 0 | - | ||
| C | 981.32 ± 6.65 | 84.77 ± 2.68 | 7.73 ± 1.35 |
| Cdl | 989.90 ± 10.41 | 85.79 ± 4.82 | 6.69 ± 0.67 |
| Cdh | 985.74 ± 8.83 | 88.47 ± 3.45 | 7.99 ± 0.49 |
| p-Value | 0.516 | 0.329 | 0.1602 |
| At day 30 | - | ||
| C | 974.57 ± 3.84 b | 91.78 ± 2.39 | 7.99 ± 0.78 |
| Cdl | 987.91 ± 6.01 a | 93.86 ± 2.78 | 6.88 ± 0.38 |
| Cdh | 982.99 ± 7.48 a | 93.06 ± 4.26 | 7.73 ± 0.28 |
| p-Value | 0.016 | 0.647 | 0.359 |
Mean values indicated in the same columns with different superscripts (a and b) were significantly different (p < 0.05). IgG, immunoglobulin G; IgE, immunoglobulin E; and IgA, immunoglobulin A.
7.3. Intestinal and Cecal Microflora Composition
The gastrointestinal (small intestine and cecum) microflora composition of rabbits treated with different concentrations of Cd (0, 1.25, or 2.5 g/kg of the DM diet) is shown in Table 8. At day 30 (the end of the experimental period), the counts of intestine and cecum Salmonella and Coliform species were significantly reduced in the Cd-treated groups compared with the control group. The two concentrations of Cd significantly increased the counts of intestinal and cecal yeast and Lactobacillus species compared with the control.
Table 8. Small intestinal and cecal microflora composition of rabbits treated with different concentrations of Cleome droserifolia (Forssk.) Del. (Cd) (0: C, Cdl: 1.25 g/kg of DM diet, or Cdh: 2.5 g/kg of DM diet).
| Treatment | Variable (Mean± Standard Error of the Mean, n = 6) | |||
|---|---|---|---|---|
| Yeast | Lactobacillus | Salmonella | Coliform | |
| Intestinal microflora (log cfu/g) | ||||
| C | 4.83 ± 0.65 b | 6.80 ± 0.91 a | 5.96 ± 0.55 a | 6.30 ± 0.70 a |
| Cdl | 7.60 ± 0.52 a | 8.10 ± 0.94 a | 3.10 ± 0.65 b | 4.86 ± 0.77 a |
| Cdh | 8.06 ± 0.66 a | 8.06 ± 0.70 a | 3.13 ± 0.85 b | 4.83 ± 0.85 a |
| Cecal microflora (log cfu/g) | ||||
| C | 3.56 ± 0.81 b | 5.40 ± 0.55 a | 7.63 ± 0.86 a | 8.13 ± 0.61 a |
| Cdl | 5.60 ± 1.13 a | 6.57 ± 1.70 a | 5.50 ± 0.45 b | 6.06 ± 1.30 b |
| Cdh | 5.27 ± 0.83 ab | 6.93 ± 1.53 a | 5.34 ± 0.67 b | 6.20 ± 0.79 b |
Mean values indicated in the same rows with different superscripts (a and b) were significantly different (p < 0.05).
References
- Hashem, N.; Soltan, Y.; El-Desoky, N.; Morsy, A.; Sallam, S. Effects of Moringaoleifera extracts and monensin on performance of growing rabbits. Livest. Sci. 2019, 228, 136–143.
- Awad, O.M.E.; El Sohaimy, S.; Ghareeb, D.A.; Aboulenein, A.; Saleh, S.R.; El-Aziz, N.M.A. Phytochemical analysis and toxicity assessment of artichoke by-product extract. Pak. J. Biol. Sci. 2019, 23, 81–91.
- Moustafa, A.; Sarah, R.; Qiqa, S.; Mansour, S.; Alotaibi, M. Cleome droserifolia: An Egyptian natural heritage facing extinction. Asian J. Plant Sci. Res. 2019, 9, 14–21.
- El-Askary, H.; Handoussa, H.; Badria, F.; El-Khatib, A.H.; Alsayari, A.; Linscheid, M.W.; Motaal, A.A. Characterization of hepatoprotective metabolites from Artemisia annua and Cleome droserifolia using HPLC/PDA/ESI/MS–MS. Rev. Bras.Farm. 2019, 29, 213–220.
- Abdel-Kader, M.S.; Alqasoumi, S.I.; Al-Taweel, A.M. Hepatoprotective constituents from Cleome droserifolia. Chem. Pharm. Bull. 2009, 57, 620–624.
- Ezzat, S.M.; Motaal, A.A. Isolation of new cytotoxic metabolites from Cleome droserifolia growing in Egypt. Z. FürNat. C 2012, 67, 266–274.
- Maksoud, H.A.; Zaid, O.A.A.; Elharrif, M.G.; Omnia, M.; Alaa, E. Selenium Cleome droserifolia nanoparticles (Se-CNPs) and it’s ameliorative effects in experimentally induced diabetes mellitus. Clin. Nutr. ESPEN 2020, 40, 383–391.
- Motaal, A.; Ezzat, S.; El-askary, H. Antihyperglycemic Activity and standardization of the bioactive extract of Ceome droserifolia growing in Egypt. Pharmacogn. J. 2014, 6, 15–21.
More
Information
Subjects:
Agriculture, Dairy & Animal Science
Contributor
MDPI registered users' name will be linked to their SciProfiles pages. To register with us, please refer to https://encyclopedia.pub/register
:
View Times:
1.2K
Revisions:
2 times
(View History)
Update Date:
12 Jul 2021
Table of Contents


Notice
You are not a member of the advisory board for this topic. If you want to update advisory board member profile, please contact office@encyclopedia.pub.
OK
Confirm
Only members of the Encyclopedia advisory board for this topic are allowed to note entries. Would you like to become an advisory board member of the Encyclopedia?
Yes
No
${ textCharacter }/${ maxCharacter }
Submit
Cancel
Back
Comments
${ item }
|
${ item.createdUser.fullName }
${ item.createdAt }
${ item.vote }
${ item.reply }
Delete
${ reply.createdUser.fullName }
${ reply.createdAt }
${ reply.vote }
Delete
There is no reply to this comment~
${ item.replyTextCharacter }/${ item.replyMaxCharacter }
Submit
Cancel
More
No more~
There is no comment~
${ textCharacter }/${ maxCharacter }
Submit
Cancel
${ selectedItem.replyTextCharacter }/${ selectedItem.replyMaxCharacter }
Submit
Cancel
Confirm
Are you sure to Delete?
Yes
No