 +1 credit
| Version | Summary | Created by | Modification | Content Size | Created at | Operation |
|---|---|---|---|---|---|---|
| 1 | Wojciech Kosman | + 3736 word(s) | 3736 | 2020-05-11 11:32:15 | | | |
| 2 | Rita Xu | Meta information modification | 3736 | 2020-05-12 04:48:48 | | | | |
| 3 | Rita Xu | -25 word(s) | 3711 | 2020-10-28 10:34:22 | | |
Video Upload Options
One may apply a molten salt storage to core power plants in the energy system with renewable energy sources. The application allows to extend the range of the load of the core power plants and thus better respond to and compensate the fluctuations of the power supplied from the renewables. The application may include the steam turbines from power cycles where fossil fueled boilers were withdrawn. The integration of the core units, the older turbines and the molten salt storage requires a detailed analysis of the existing systems. The entry describes several suggestions for this application and shows the results of the numerical simulations of their operation.
1. Methodology
The numerical model described in the preceding section allows one to simulate the performance of the investigated power plant in the chosen cases of the modernization. The simulations were conducted for a rather wide range of loads from 35% to 100% for the subcritical steam turbine and 35% to 90% for the supercritical steam turbine. Since the design power outputs are different for both turbines the load percentages translate into different values in megawatts. A number of combinations of the loads were analyzed.
During a typical operation the power demand undergoes continuous fluctuations and the turbine output must match the demand. In order to compare different options of the modernization one may chose two approaches. The first one is to assume a particular curve of the demand over time and conduct the simulations for that curve matching it with the turbine load. However, the shape of the demand curve strongly depends on the location of the power plant and local conditions of the operation (cooling possibilities, ambient conditions etc.). For that reason a second approach was applied. It was assumed that the energy storage loading and unloading is conducted under a constant power supply to the grid. The power supply may be different for the loading and the unloading but remains constant during both processes.
Each run of the simulation model started with the given values of the power delivered to the grid from the supercritical and the subcritical turbine. The subcritical turbine always matches its power output to the power demand from the grid. The supercritical turbine matches the power demand in the options 2 and 3 of the modernization but in the option 1 it operates always at 100% delivering the excess power to the electric heater that increases the temperature of the molten salt.
The simulation model then matched the turbines performance to the selected levels of the power demand. The model calculated the required flow rates and the parameters of steam in the characteristic locations of the power plant (inlets and outlets of the turbine sections and heat exchangers, etc.). Based on the parameters in the steam cycles the flow rates of the molten salt were calculated and then the time required for the energy loading and the unloading processes. Finally the efficiency of the electric energy generation could be determined.
The numerical simulations were conducted for a constant value of the energy delivered to the steam cycle in the supercritical boiler. This constant value is equal to the value for the full load operation of the supercritical steam cycle. The algorithm that drove the calculations and assured the convergence of the numerical model for the options 2 and 3 had to match the two main flows. The flow of the life steam at the inlet to the supercritical turbine had to match the given power demand from the supercritical turbine and the flow of the steam generated in the supercritical boiler had to match the constant value of the energy delivered to the steam cycle in the boiler.
The modeling results are presented in the next section of the paper in the form of the graphs that present the efficiency and the loading time for different combinations of the power demand from the analyzed turbines.
2. Modernization Effects
2.1. Option 1
The addition of the energy storage system to the steam cycles generally lowers the power generation efficiency. This decrease is shown in Figure 1 for the first option of the modernization. The graph in the figure presents the values calculated from Equation (6) for different levels of the electric power supply/demand. The power supplied to the grid from the supercritical turbine Nel,spr refers to the loading process. This is a relative value in Figure 1 and its reference value is the nominal (design) power output of the supercritical turbine Nel,n,spr. According to the assumptions for the option 1 the supercritical turbine operates under the full load independent of the current power demand and the excess power is used for the loading of the energy storage.
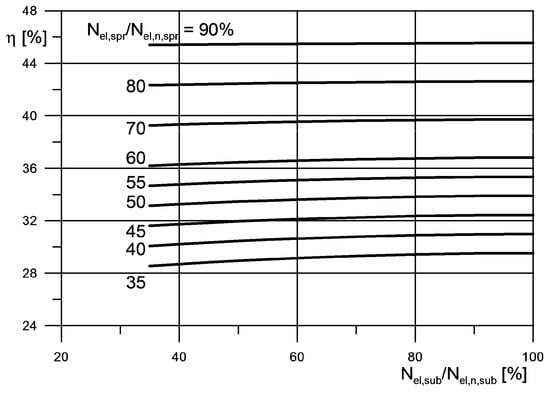
Figure 1. Power generation efficiency—option 1.
The power demand for the subcritical turbine Nel,sub is given for the unloading process. The subcritical turbine power is always equal to the power supplied to the grid. Its value in Figure 1 is relative and its reference value is the nominal (design) power output of the subcritical turbine Nel,n,sub.
The graph shows that the efficiency depends mostly on the level of the power demand during the loading process. This is due to the difference of the nominal power between the two turbines—the nominal power of the supercritical turbine is over two times larger than the power of the subcritical turbine. The values in Figure 1 should be compared to the values in Figure 4. The current efficiencies of the supercritical and subcritical turbines for a full load operation are 48.4% and 42.0%, respectively.
An important piece of information in the evaluation of the combined cycle is the time required to load the energy storage system. Figure 2 presents the dependency between the time of the loading process and the power demands during the two processes: the loading and the unloading. According to the assumptions described in the preceding sections this time is always determined for the amount of energy that allows the subcritical turbine to operate for 24 h during the given load. Of course the amount of the stored energy is different for different loads. The graph is divided into two sections with different ranges on the vertical axes due to the large density of the lines.
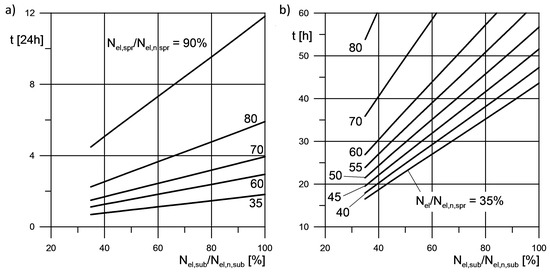
Figure 2. Loading time of the energy storage for the 24 h of the subcritical turbine operation—option 1—full graph (a) and its enlarged section (b).
The low power demand during the loading process results in more excess power supplied to the electric heater to increase the temperature of the molten salt and to store the energy. The time required to load the storage is then shorter. If the power demand from the supercritical turbine is under 50 percent of the nominal turbine power then the loading period is around two days.
The values of the molten salt flow rate and the total required amount of the molten salt in the hot tank are shown in Figure 3. Both values are shown in relation to the subcritical turbine load.
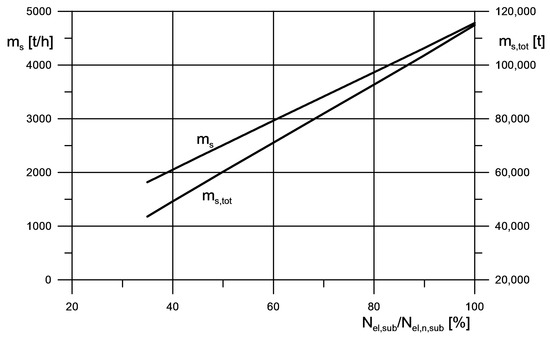
Figure 3. Molten salt flow rate and total amount for the 24 h of subcritical turbine operation—option 1.
The design of the tanks, the electric heater and the steam-salt heat exchangers must match the largest values shown in the Figure 3. The design is a separate subject not discussed in this paper.
It should be noted that due to the difference in the nominal power outputs between the turbines the unloading will probably be conducted under the higher load then the power demand during the loading process.
2.2. Option 2
In the modernization options 2 and 3 the power output of the supercritical turbine during the energy storage loading always matches the current demand from the power grid. However, the amount of the heat supplied to the steam cycle in the boiler is always equal to its nominal value. The excess steam flows to the steam—salt exchangers and increases the temperature of the salt to store the energy.
The power generation efficiency for the energy storage loading and the unloading are shown in Figure 4 for option 2. Compared to option 1 this technical solution has lower efficiency, especially for the lower power demands. the change is the result of different type of the energy conversion. In option 1 the temperature of the molten salt is due to the electric power, while in option 2 it is due to the heat carried in the hot steam.
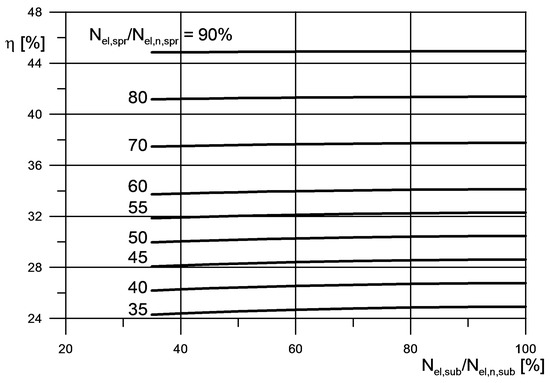
Figure 4. Power generation efficiency—option 2.
The loading time of the energy storage required for the 24 h operation of the subcritical turbine is longer than in option 1. The length of the loading period is shown in Figure 5. The graph is again divided into two sections with different ranges on the vertical axes due to the density of the lines. The difference between options 1 and 2 is around 10 h with option 1 providing the shorter period. The total amount of the molten salt required to guarantee the 24 h operation of the subcritical turbine and the flow rate of the salt is the same as in option 1.
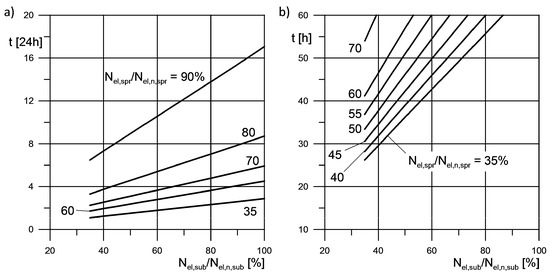
Figure 5. Loading time of the energy storage for the 24 h of the subcritical turbine operation—option 2—full graph (a) and its enlarged section (b).
The results described so far for option 2 are from the simulations where the life steam pressure at the inlet to the supercritical turbine depends on the steam flow in the boiler according to Equation (2). The results are different if the pressure is adjusted to the load according to Equation (3). The values of the pressure for both Equations (2) and (3) are shown in Figure 6a. The line for Equation (2) is not horizontal in the figure because the constant value in the calculations was the amount of energy delivered to the steam cycle in the boiler and not the steam flow.
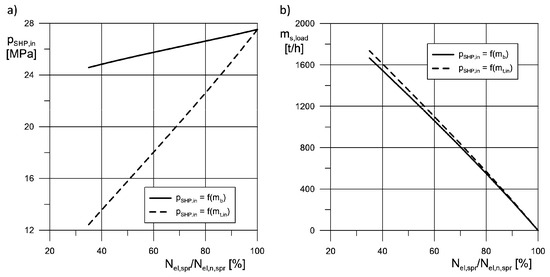
Figure 6. Life steam pressure (a) and the flow of the molten salt during the loading of the energy storage (b) for the option 2, steam pressure depends on the flow in the boiler pSHP,in = f(mb) or at the turbine inlet pSHP,in = f(mt).
According to Figure 6b the cycle with the lower pressure of the life steam delivers more molten salt to the hot tank while the amount of energy delivered to the steam cycle in the supercritical boiler is the same. The larger flow of the molten salt results in a shorter period of the loading of the energy storage. Figure 7 compares the chosen cases of the loading process for different levels of the power demand during the loading, different load during the unloading and two types of the function that determines the life steam pressure (Equations (1) or (2)).
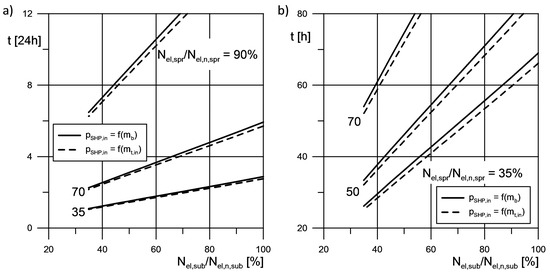
Figure 7. Loading time of the energy storage for 24 h of subcritical turbine operation—option 2, life steam pressure adjusted to the steam flow in the boiler or at the turbine inlet—full graph (a) and its enlarged section (b).
The efficiency of the power generation for the whole combined cycle also increases. The comparison of the efficiency values is presented in Figure 8. The figure includes the results of the simulations for the low levels of the loads. The differences between the two types of the adjustment of the life steam pressure are smaller for the operation that is close to the full load because the steam that flows to the turbine is almost equal to the total flow of the steam generated in the boiler and both pressure adjustment Equations (1) and (2) give similar results.
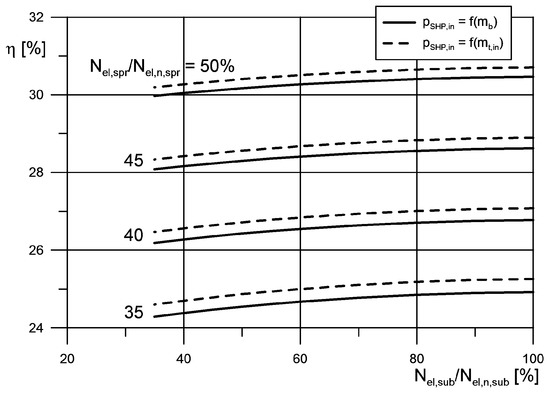
Figure 8. Power generation efficiency—option 2, life steam pressure adjusted to the steam flow in the boiler or at the turbine inlet.
The adjustment of the life steam pressure and its lower values for the part-load operation generally lead to the improvement of the power generation efficiency. In the combined cycle with the energy storage system presented here this improvement is visible for the whole cycle.
A larger improvement of the power generation efficiency may be achieved through the decrease of the life and the reheat steam temperature for the subcritical turbine. Of course, this leads to a decrease of the current efficiency of the subcritical turbine but it improves the efficiency of the whole combined system. Lower temperature of the steam generated for the subcritical turbine requires a lower temperature of the molten salt in the hot tank. This allows one to increase the flow rate of the molten salt in the steam-salt exchangers while keeping constant the amount of energy delivered to the supercritical cycle. The flow rate of the salt is compared in Figure 9 for two different values of the temperature of the steam for the subcritical turbine.
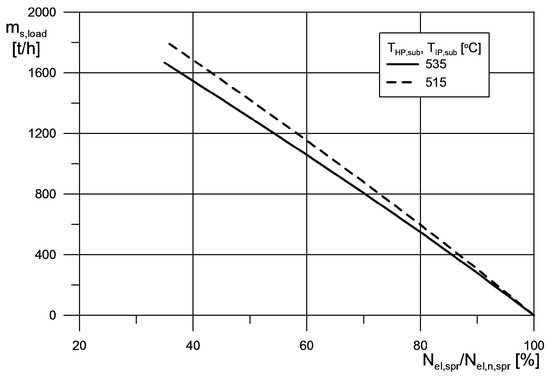
Figure 9. Flow rate of the salt during the loading process for different temperature of the steam for the subcritical turbine—option 2.
A larger flow rate results in a shorter loading period and this leads to a better efficiency of the power generation of the whole cycle with the energy storage. The values of the efficiency are compared in Figure 10a. The improvement of the efficiency in the reference to the nominal values of the steam temperature for the subcritical turbine is around 0.5 percentage points.
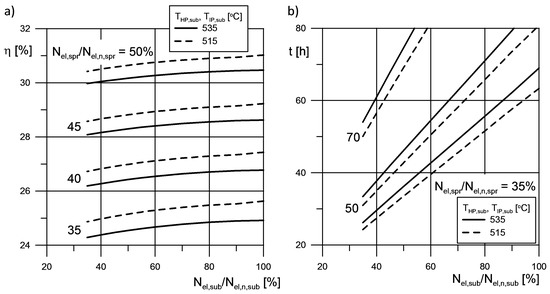
Figure 10. Power generation efficiency (a) and the loading time (b) for different life and reheat steam temperature for the subcritical turbine—option 2.
The shortened time of the loading process is shown in Figure 10b. The hot tank is filled faster when the subcritical steam temperature is lower. The comparison to the results with the nominal temperature value shows that the loading process is 2–3 h shorter, depending on the load. This is especially important for the low loads because the 2–3 h are 10% of the total loading time.
The results in Figure 9 and Figure 10 were obtained in the simulations under the assumption that the values of the life and the reheat steam temperature are equal. The values of 535 and 515 °C are respectively the nominal value and the minimal value that may be applied without the increased erosion process in the low-pressure part of the subcritical turbine.
2.3. Option 3
The steam temperature at the outlet of the intermediate steam-salt exchanger (XSIP in Figure 2 or Figure 3) is relatively high. Its value is well above the saturation temperature. For this reason option 3 was investigated. In this option the heat in the steam at the outlet of the exchanger is used to increase the temperature of the feed water that flows to the supercritical boiler (Figure 3). A new steam cooler is installed downstream of the boiler. The results of the simulation including the power generation efficiency and the time of the loading process for the energy storage for this option are gathered in Figure 11.
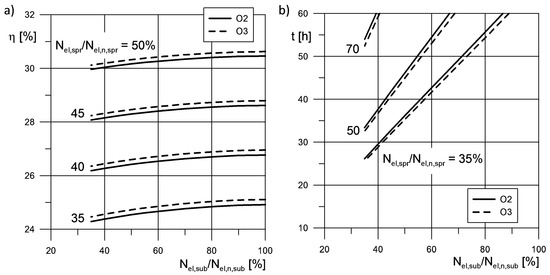
Figure 11. Power generation efficiency (a) and the loading time for 24 h of operation of the subcritical turbine (b)—options 2 and 3.
The addition of the new steam cooler increases the power generation efficiency and decreases the loading period. However, the results of the simulations prove that the profit in terms of the efficiency and time is small. The investment costs of the new steam cooler would probably not be justified in an economical analysis.
It should be emphasized here that the variants of option 2 described earlier did not include the new steam cooler but involved the adjustments of the supercritical steam pressure or the subcritical steam temperature. These adjustments do not require additional investment cost but the change of the parameters of the working fluid in the already existing machines.
2.4. Direct Integration with Renewables
All the technical solutions presented here are meant for the foundation of a power system. Again it should be recalled that the main task of the foundation is the compensation of the fluctuations of the power generated in the renewable energy sources. According to the assumptions given in the Introduction the source of the energy for the foundation is fossil fuel.
The structure of the presented power plant with a storage system allows one to use renewable energy sources (RES) in the foundation. This may be done through the connection of the renewables not directly to the power grid but rather to the energy storage system in the cycles presented here. This idea is depicted in Figure 12.
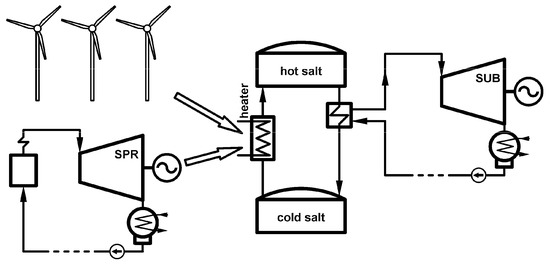
Figure 12. Cycle with a storage system for energy from the renewable sources and the supercritical turbine.
The thermodynamic cycle from Figure 12 is a modified version of option 1 from Figure 1. The difference is in the renewable source that is connected to the energy storage installation. The electric power from wind, sun or another is used to increase the temperature of the molten salt in the electric heater. The electric power from the RES is stored only if its level exceeds the current demand in the grid. This solution is similar to the solutions in the countries with sufficient solar irradiance or the strength of the wind, where the renewables feed the energy storage. In the countries with worse conditions for the extraction of the energy from the renewables the presence of the supercritical turbine guarantees the continuity of the power supply to the grid.
The results of the simulations for the cycle integrated with the renewables are shown in Figure 13 and Figure 14. They were conducted without defining the particular type of the renewable energy source. Figure 13 presents the efficiency of the power generation for different shares of the power from the renewables. In order to compare this case with the previous cases the simulations were conducted for constant levels of the power from the renewables. The efficiency is defined as:
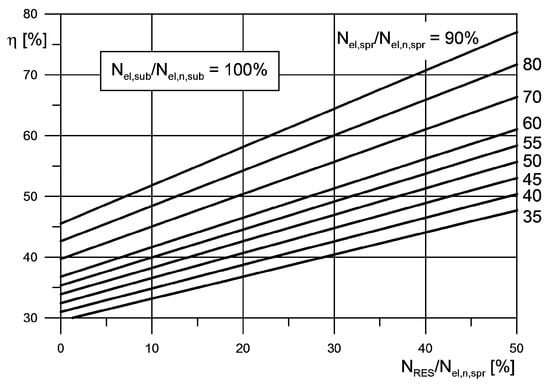
Figure 13. Power generation efficiency for different share of the power from the renewables—modernization according to the option 1.
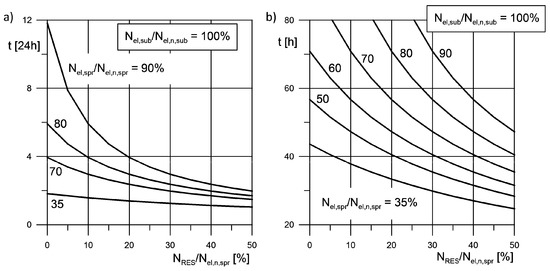
Figure 14. Loading time of the energy storage for 24 h of operation of the subcritical turbine with different share of the power from the renewables—option 1—full graph (a) and its enlarged section (b).
In the above equation the share of the power from the renewables is relative to the nominal power of the supercritical turbine. The values of the efficiency from Figure 13 are high because the power from the renewables is treated here as an effect that does not require an input in the form of a delivered energy. The graph in Figure 13 was obtained for a simulation with the full load operation of the subcritical turbine, so Nel,sub/Nel,n,sub is 100%.
The integration of the steam turbines and the renewables significantly shortens the loading time of the energy storage. A comparison of loading times is shown in Figure 14.
It should be emphasized that a constant power supply from the renewables during the loading was assumed in order to compare the options and variants of the thermal cycles analyzed in the study. In practice the renewable sources, especially the wind, exhibit significant fluctuations of a current power.
2.5. Comparison
The results of the simulations for different cases are compared in Figure 15. The figure presents the power generation efficiency for the energy storage loading with the power supply from the supercritical turbine of 35%. The following options are compared:
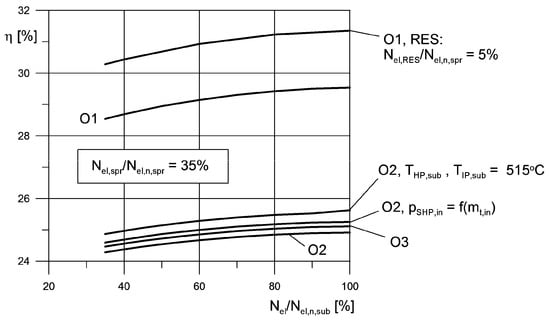
Figure 19. Power generation efficiency for the analyzed cases.
-
O1, O2 and O3—options 1, 2 and 3, respectively,
-
O2, pSHP,in = f(mt,in)—option 2, supercritical steam pressure adjusted according to Equation (3),
-
O2, THP,sub, TIP,sub = 515 °C,
-
O1, RES—option 1 integrated with RES, the power supplied from the RES is 5% of the nominal supercritical steam turbine power.
The comparison of the options shows that the option 1 always provides the largest efficiency of the power generation. The conversion of the electric power into the heat stored in the molten salt is more efficient than the conversion of the heat in the hot steam. The efficiency may be improved if the steam parameters are adjusted. This applies to the steam parameters in the supercritical and the subcritical turbine.
Option 3 that is a variant of option 2 with an additional steam cooler provides an efficiency gain but it is smaller than the gain from the adjustment of the steam parameters. Of course the adjustment should also be made for option 3. However the cost of the additional steam cooler may not justify the upgrade. It should be noted that the adjustment of the steam parameters is done without any investment cost.
3. Conclusions
The application of the energy storage system as a buffer between a supercritical and a subcritical turbine allows one to create a unit that generates power over a very wide range of loads. A unit of this type may be an important part of a power system with a large number of the renewable energy sources. The wide range of the loads allows one to decrease the total number of similar units that are required in the system foundation. It also makes the unit less dependent on the ambient conditions.
The presented solutions are designed for power grids that undergo a transformation from fossil fuels to green energy. The solution involves the machines from existing systems that are still operational. Their harmful impact on the natural environment is reduced due to the integration with newer technologies.
Among the options presented here the option that allows to use the renewable energy sources in the power plant that is a foundation of a power grid showed the best efficiency. However, this was obtained in the simulations under the assumption that the energy supplied from the RES is constant, which is hardly true. The integration of the RES with a core power plant should be carefully analyzed for a particular location and local conditions regarding the availability of the renewables.
The difference between the options presented here is the type of the energy conversion during the loading process. Option 1 with the electric energy supplied to the heater that increases the temperature of the molten salt performed better in the simulations in terms of the power generation efficiency. Option 2 with the heat in the steam converted to the heat in the molten salt had lower efficiency even with the adjusted parameters of the steam. Option 3 is just a minor improvement when compared to option 2.
In all the options the supercritical steam boiler always operates with the highest possible efficiency. This translates to the lowest possible emissions per a unit of the produced electric power. The energy storage system with the molten salt that was analyzed here is very often applied to solar power plants. The salt is pushed through vertical solar tower in a number of tubes exposed to the sun. The flow must be divided into a considerable large number of pipes due to the exposure to the sunlight. The salt heater in the cycles described here is free from this restriction.


