 +1 credit
| Version | Summary | Created by | Modification | Content Size | Created at | Operation |
|---|---|---|---|---|---|---|
| 1 | Fangzhou Zheng | + 1537 word(s) | 1537 | 2021-05-19 11:12:30 | | | |
| 2 | Lindsay Dong | Meta information modification | 1537 | 2021-06-25 03:45:25 | | |
Video Upload Options
Water-induced channel is one of the main forms of soil erosion in cultivated fields. Channelized erosion is often measured by the volume of the channels. Traditionally, the measurements were conducted with rulers or measuring tapes. However, these traditional methods are generally time- and labor-consuming and can cause soil surface disturbance. Close-range photogrammetry with a Consumer-Grade Camera (CGC-CRP) provides an alternative way of measuring channel volume and can overcome limitations of traditional methods and provides much higher spatial resolution. The optimum setting of the camera is with the image overlapping greater than 70% and with the shooting angle ranging from 60° to 80°. In addition, the channel orientation paralleled to the camera shooting direction is recommended.
1. Introduction
Water erosion is one of the main forms of soil erosion in cultivated fields, causing soil loss and crop yield reduction on site and environmental concerns off-site [1][2][3][4]. Water erosion is often shown as morphological changes or resultant morphological features. At the beginning of a water erosion event, erosion can be caused by raindrop splashing and surface runoff (in the form of sheet flow). It results in relatively uniform soil loss across the slope, which is termed sheet erosion. As the runoff depth increases, it starts to concentrate and incise into soil surface to form channels. Channels firstly appear as randomly located parallel small rills. As a rill develops, runoff cuts deeper into the rill bottom and widens the channel. Big channels that can be filled by regular tillage operation are called ephemeral gullies. The locations of these channels are often defined by topography so that they usually reappear at roughly the same locations each time even they are filled by tillage every year. When channels become too big to be erased by normal tillage operations, they are termed classic gullies [5][6][7].
Traditionally, the measurements of the channel cross-section are conducted with rulers or measuring tapes. Compared to the traditional method, photogrammetry has the advantage of minimal soil disturbance and low labor and time requirement. Recently, photogrammetry became more popular with the Structure from Motion (SfM) technique [8]. SfM is a technique used to reconstruct three-dimensional structures from two-dimensional image sequences that can be coupled with motion signals. With the SfM, photogrammetry becomes more reliable due to the robustness and efficiency of the algorithm proposed by Lowe [9]. Photogrammetry is classified based on camera location during photography into aerial photogrammetry and close-range photogrammetry. For the aerial photogrammetry, the camera is usually mounted under an aircraft (e.g., Unmanned Aerial Vehicles (UAVs)), whereas, for the close-range photogrammetry, the camera is usually mounted on a tripod or handheld by a photographer. The aerial photogrammetry has long been used to monitor or measure soil erosion, especially ephemeral gully erosion [10][11][12][13][14]. With the advances in technology, numerous studies have applied aerial photogrammetry for assessing channelized erosion at different scales [15][16][17][18][19][20][21][22][23][24]. Recently, close-range photogrammetry has also been utilized to monitor processes of soil erosion in many studies [40,41,42,43,44,45,46,47,48,49,50]. Many researchers used Consumer-Grade Cameras (CGC) in their studies. From a practical perspective, image capturing with a handheld camera should be the easiest and lightest way to reconstruct gully morphology.
2. Using Close-Range Photogrammetry to Measure Channelized Erosion with a Consumer-Grade Camera
2.1. Artificial Surface
2.1.1. Visual Observation of the DEMs
In all generated DEMs, all objects were clearly identifiable and in the correct locations (Figure 1 and Figure 2). For camera shooting angle settings, there was a general trend of increasing noise with the decrease of shooting angle, whereas for image overlapping rate settings, there was a general trend of increasing noise with the decrease of image overlapping rate. At the lowest shooting angle (30°) and lowest image overlapping rates (60% and 50%), some objects were significantly deformed.
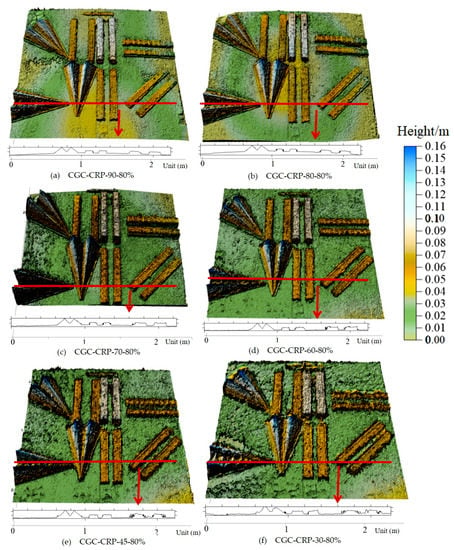
Figure 1. Maps generated from DEMs obtained using the CGC-CRP method with different camera shooting angle settings, (a) 90°, (b) 80°, (c) 70°, (d) 60°, (e) 45°, and (f) 30°, with an overlapping rate of 80%. An example transect extracted from each DEM was shown at the bottom of the map.
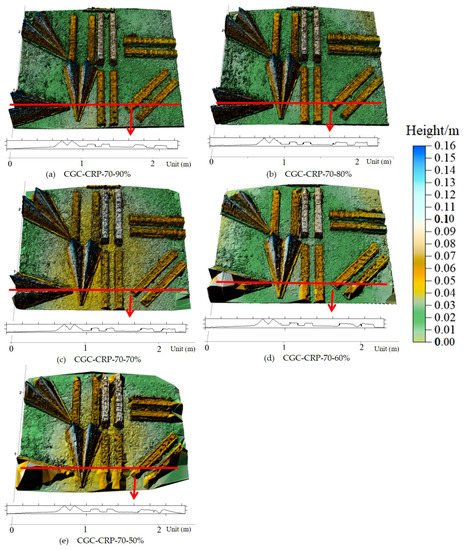
Figure 2. Maps generated from DEMs obtained using the CGC-CRP method with different image overlapping rate settings, (a) 90%, (b) 80%, (c) 70%, (d) 60%, and (e) 50%, with a shooting angle of 70°. An example transect extracted from each DEM was shown at the bottom of the map.
2.1.2. U-Channels
For U-channel objects, the channel size maintained the same for each individual object so that the cross-sectional area measurements can be considered repeated measurements. For the vertically oriented U-channel (VU), manually measured cross-sectional area averaged at 39.0 cm2 with a CV of 1.4%. The CGC-CRP-derived area (Table 1) ranged from 25.5 cm2 to 36.2 cm2, and averaged at 31.0 cm2 with a SD of 3.4 cm2, a ME of −8.0 cm2 and a RMSE of 8.6 cm2. There was a systematic underestimation with the U-channel, probably due to the errors casued by cutting out corners.
Table 1. Average, standard deviation (SD), mean error (ME), and root mean square error (RMSE) of the cross-sectional area (cm2) of selected transects derived from the CGC-CRP method for U-channels on the artificial surface.
| Channel | Shooting Angle (with 80% Overlap) | Image Overlap Rate (with 70° Angle) | ||||||||||
|---|---|---|---|---|---|---|---|---|---|---|---|---|
| 90° | 80° | 70° | 60° | 45° | 30° | 90% | 80% | 70% | 60% | 50% | ||
| VU | Average | 29.0 | 30.0 | 31.0 | 28.6 | 27.0 | 21.3 | 27.4 | 31.0 | 26.9 | 25.8 | 20.4 |
| SD | 3.8 | 1.2 | 3.4 | 3.7 | 3.6 | 5.6 | 2.9 | 3.4 | 3.8 | 3.3 | 13.6 | |
| ME | −10.0 | −9.0 | −8.0 | −10.4 | −12.0 | −17.7 | −5.5 | −8.0 | −12.1 | −13.1 | −18.6 | |
| RMSE | 10.6 | 9.0 | 8.6 | 10.9 | 12.5 | 18.5 | 6.1 | 8.6 | 12.6 | 13.5 | 22.4 | |
| AU | Average | 26.7 | 27.3 | 28.6 | 30.6 | 27.9 | 19.6 | 24.6 | 28.6 | 29.0 | 27.2 | 13.8 |
| SD | 4.9 | 3.5 | 2.9 | 3.1 | 13.0 | 9.2 | 3.5 | 2.9 | 2.0 | 4.7 | 7.1 | |
| ME | −14.4 | −13.8 | −12.4 | −10.6 | −13.2 | 21.4 | −9.7 | −12.4 | −12.0 | −14.0 | −27.4 | |
| RMSE | 15.1 | 14.3 | 12.7 | 11.0 | 18.0 | 23.2 | 10.3 | 12.7 | 12.2 | 14.7 | 28.3 | |
| HU | Average | 28.4 | 25.5 | 33.1 | 34.6 | 22.4 | 18.0 | 27.3 | 33.1 | 34.0 | 24.6 | 18.7 |
| SD | 5.1 | 3.4 | 3.0 | 7.8 | 7.6 | 9.9 | 3.3 | 3.0 | 2.9 | 7.4 | 11.8 | |
| ME | −10.4 | −13.4 | −5.7 | −4.2 | −16.4 | −20.8 | −3.4 | −5.7 | −4.8 | −14.2 | −20.1 | |
| RMSE | 11.6 | 13.8 | 6.3 | 8.4 | 17.8 | 22.7 | 4.7 | 6.3 | 5.5 | 16.0 | 23.1 | |
| DU | Average | 60.6 | 56.5 | 52.1 | 63.4 | 55.0 | 44.5 | 64.5 | 52.1 | 48.8 | 50.6 | 72.3 |
| SD | 4.9 | 4.5 | 4.0 | 8.5 | 6.3 | 12.0 | 3.1 | 4.0 | 2.9 | 4.4 | 27.4 | |
| ME | −17.8 | −21.8 | −26.3 | −14.9 | −23.4 | −33.7 | −22.3 | −26.3 | −29.6 | −27.8 | −6.5 | |
| RMSE | 18.2 | 22.1 | 26.5 | 17.0 | 24.1 | 35.5 | 22.6 | 26.5 | 29.7 | 28.2 | 27.0 | |
| WU | Average | 64.8 | 59.9 | 62.8 | 67.0 | 72.2 | 65.6 | 64.7 | 62.8 | 66.7 | 63.6 | 49.7 |
| SD | 3.0 | 2.5 | 3.0 | 9.4 | 6.8 | 16.7 | 2.8 | 3.0 | 5.0 | 3.7 | 11.9 | |
| ME | −9.6 | −18.1 | −15.2 | −11.0 | −5.6 | −12.4 | −8.4 | −15.2 | −11.2 | −14.4 | −28.3 | |
| RMSE | 13.5 | 18.4 | 15.6 | 14.0 | 8.8 | 19.9 | 9.0 | 15.6 | 12.4 | 14.7 | 30.6 | |
2.1.3. V-Channels
For V-channel objects, the channel size changed along the channel so that the cross-sectional area measurements varied. For the vertically oriented V-channel (VV), the manual measurements of the cross-sectional area (Table 2) ranged from 0.1 cm2 to 113.9 cm2, whereas the CGC-CRP-derived value ranged from 0.0 cm2 to 114.2 cm2. Unlike the U-channel, there was no systematic under- or overestimation with the V-channel (Figure 3). Moreover, the absolute values of error for V-channel were approximately 15% less than those of U-channel. This could be rooted from that the sidewalls of V-channel were angled, not straight down and perpendicular to the ground. Therefore, the errors due to cutting out corners were expected to be much lower.
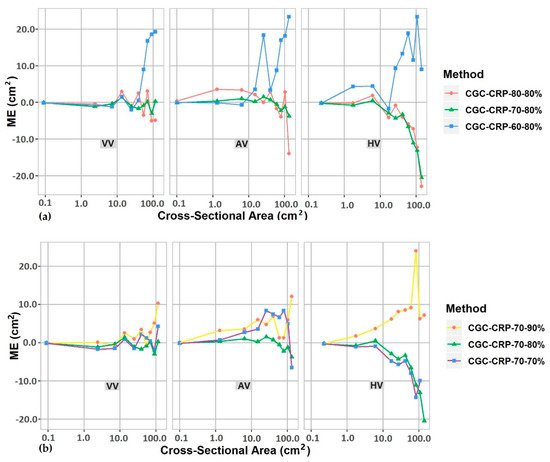
Figure 3. Mean error (ME) of cross section area (cm2) derived from the CGC-CRP method with (a) selected camera shooting angle settings and (b) selected image overlapping rate settings. The x-axis is in logarithmic scale. VV: vertical channel, AV: angled channel, HV: horizontal channel.
Table 2. ME and RMSE of the cross-sectional area (cm2) of selected transects derived from the CGC-CRP method for V-channels on the artificial surface.
| Channel | Shooting Angle (with 80% Overlap) | Image Overlap Rate (with 70° Angle) | ||||||||||
|---|---|---|---|---|---|---|---|---|---|---|---|---|
| 90° | 80° | 70° | 60° | 45° | 30° | 90% | 80% | 70% | 60% | 50% | ||
| VV | ME | 1.5 | −0.8 | −0.6 | 6.2 | 5.1 | 4.8 | 2.3 | −0.6 | 0.2 | 0.1 | −1.5 |
| RMSE | 2.7 | 3.0 | 1.3 | 10.4 | 8.3 | 8.6 | 4.0 | 1.3 | 1.9 | 2.4 | 2.4 | |
| AV | ME | 3.8 | −0.4 | −0.4 | 9.2 | 3.8 | −12.9 | 4.5 | −0.4 | 3.6 | −8.4 | −3.7 |
| RMSE | 4.9 | 5.1 | 1.6 | 12.7 | 9.1 | 18.3 | 5.6 | 1.6 | 5.7 | 7.9 | 21.8 | |
| HV | ME | −2.5 | −5.5 | −6.2 | 9.2 | 6.0 | −1.6 | 7.5 | −6.2 | −5.5 | N/A | N/A |
| RMSE | 9.3 | 8.9 | 8.9 | 11.9 | 8.4 | 19.0 | 9.7 | 8.9 | 7.0 | N/A | N/A | |
2.2. Soil Surface
For the soil surface, manually measured cross-sectional areas for the ten transects ranged from 376.2 cm2 to 853.1 cm2, whereas the values derived from the CGC-CRP methods ranged from 385.9 cm2 to 877.9 cm2 (Table 3, Figure 4). There was no systematic under- or overestimation. The ME ranged from −7.8 cm2 to 17.7 cm2, which can be translated to −1.6% to 3.1% of the measurement. The overall RMSE for the ten transects was 8.6 cm2, which could be translated to ~1.6% of the averaged cross-sectional area. This agrees with Castillo et al. [25], who reported that close-range photogrammetry and total station methods could produce cross-sectional area values with an error less than 4%.
Table 3. Error and RMSE of cross-section area (cm2) of selected transects derived from the CGC-CRP method for the water-induced channel on the soil surface.
| Transect | 1 | 2 | 3 | 4 | 5 | 6 | 7 | 8 | 9 | 10 | Average | RMSE (cm2) |
|---|---|---|---|---|---|---|---|---|---|---|---|---|
| Manual measurement |
482.0 | 506.2 | 498.8 | 480.1 | 376.2 | 487.1 | 489.7 | 853.1 | 749.1 | 537.4 | ||
| ME (cm2) | 6.8 | 4.2 | −7.5 | −3.9 | 11.7 | 0.2 | −7.8 | 17.7 | −7.3 | 6.0 | 2.0 | 8.6 |
| ME (%) | 1.4 | 0.8 | −1.5 | −0.8 | 3.1 | 0.0 | −1.6 | 2.1 | −1.0 | 1.1 | 0.3 |
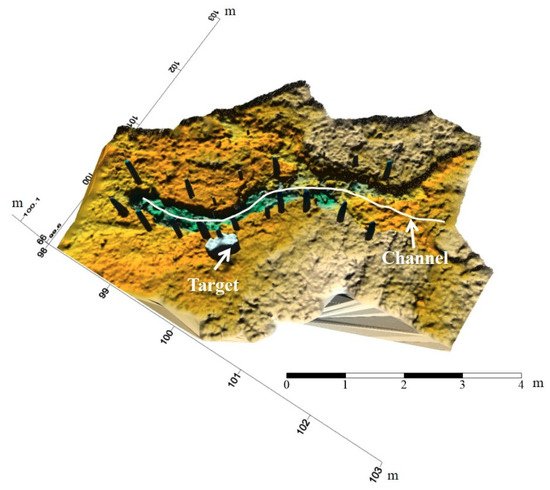
Figure 4. The map of soil surface channel produced from the DEM derived from the CGC-CRP method.
2.3. Applicability Analysis
A reasonably good quality consumer-grade camera is the major equipment used with the CGC-CRP method. The price varies with brand and region but is not very expensive. Moreover, with modern technology, camera adjustment is largely automatic, so no sophisticated photo shooting skills are required for taking a clear picture.
With respect to time consumption, for all settings, it took no more than 15 min to finish raw data collections (Table 4). However, it took much longer (~2 h) for data processing. The detection area of the CGC-CRP method varied with the settings (Table 4). However, there was a trade-off between the detection area and accuracy. The detection area increased but accuracy decreased with the decrease of shooting angle. On the other hand, with a lower overlapping rate, the detection area increased but the accuracy decreased substantially.
Table 4. Different settings and application information of the CGC-CRP method.
| Shooting Angle (°) | Image Overlapping Rate (%) | Data Collection Time (min) | Detection Area Limit (m2) |
|---|---|---|---|
| 90 | 80 | 13 | 3.6 |
| 80 | 80 | 13 | 4.1 |
| 70 | 80 | 13 | 5.5 |
| 60 | 80 | 13 | 6.2 |
| 45 | 80 | 13 | 10.8 |
| 30 | 80 | 13 | 18 |
| 70 | 90 | 15 | 5.5 |
| 70 | 80 | 13 | 5.5 |
| 70 | 70 | 10 | 5.5 |
| 70 | 60 | 9 | 5.5 |
| 70 | 50 | 8 | 5.5 |
3. Summary
In order to achieve an acceptable accuracy level (cm), the image overlapping rate should be ≥ 70%, and the shooting angle should be in the range of 60° to 80°. The camera shooting direction paralleled to the channel orientation is recommended. For different forms of erosion, sheet erosion is normally at the millimeter level (erosion rate of 10 Mg ha−1 yr−1 is equivalent to 0.8 mm yr−1 with a soil bulk density of 1250 kg m−3), so the CGC-CRP method may not be accurate enough and the traditional CRP method with more strict setup and error control is probably needed. However, centimeter accuracy is sufficient for rill and gully erosion studies, as rills and gullies are normally wider and deeper than 1 cm. Many field surveyors carry a consumer-grade camera for their field trips so the equipment for the CGC-CRP method is readily available. This makes the CGC-CRP method well suited for any type of field survey. It can be a survey designed for monitoring erosion channels, a soil survey or a reconnaissance type of survey for any geoscience or environment-related topics.
References
- Lal, R. Soil degradation by erosion. Land Degrad. Dev. 2001, 12, 519–539.
- Pimental, D.; Sparks, D.L. Soil as an endangered ecosystem. Bioscience 2000, 50, 947.
- Pimentel, D. Soil erosion: A food and environmental threat. Environ. Dev. Sustain. 2006, 8, 119–137.
- Vereecken, H.; Schnepf, A.; Hopmans, J.W.; Javaux, M.; Or, D.; Roose, T.; Vanderborght, J.; Young, M.; Amelung, W.; Aitkenhead, M. Modeling soil processes: Review, key challenges, and new perspectives. Vadose Zone J. 2016, 15.
- Li, S.; Lobb, D.A.; Tiessen, K.H. Soil erosion and conservation based in part on the article “soil erosion and conservation” by w. S. Fyfe, which appeared in the encyclopedia of environmetrics. In Encyclopedia of Environmetrics; El-Shaarawi, A.H., Piegorsch, W.W., Chebana, F., Ouarda, T.B., Eds.; John Wiley & Sons: Hoboken, NJ, USA, 2013; ISBN 0470973889.
- Lal, R. Soil Erosion Research Methods, 2nd ed.; St. Lucie Press: Delray Beach, FL, USA, 1994; ISBN 1884015093.
- Morgan, R.P.C. Soil Erosion and Conservation, 3rd ed.; Blackwell Pub.: Malden, MA, USA, 2005; ISBN 1405117818.
- Ullman, S. The interpretation of structure from motion. Proc. R. Soc. B 1979, 203, 405–426.
- Lowe, D.G. Distinctive image features from scale-invariant keypoints. Int. J. Comput. Vis. 2004, 60, 91–110.
- Stafford, D.B.; Coastal Engineering Research Center. An Aerial Photographic Technique for Beach Erosion Surveys in North Carolina; U. S. Army Coastal Engineering Research Center: Washington, DC, USA, 1971; p. 115.
- Stafford, D.B.; Langfelder, J. Air photo survey of coastal erosion. Photogramm. Eng. 1971, 37, 565–575.
- Thomas, A.; Welch, R. Measurement of ephemeral gully erosion. Trans. ASAE 1988, 31, 1723–1728.
- Thomas, A.; Welch, R.; Jordan, T. Quantifying concentrated-flow erosion on cropland with aerial photogrammetry. J. Soil Water Conserv. 1986, 41, 249–252.
- Welch, R.; Jordan, T.; Thomas, A. A photogrammetric technique for measuring soil erosion. J. Soil Water Conserv. 1984, 39, 191–194.
- Carollo, F.G.; Di Stefano, C.; Ferro, V.; Pampalone, V. Measuring rill erosion at plot scale by a drone-based technology. Hydrol. Processes 2015, 29, 3802–3811.
- Di Stefano, C.; Ferro, V. Measurements of rill and gully erosion in sicily. Hydrol. Processes 2011, 25, 2221–2227.
- D’Oleire-Oltmanns, S.; Marzolff, I.; Peter, K.; Ries, J. Unmanned Aerial Vehicle (UAV) for monitoring soil erosion in morocco. Remote Sens. 2012, 4, 3390–3416.
- Giménez, R.; Marzolff, I.; Campo, M.; Seeger, M.; Ries, J.; Casalí, J.; Alvarez-Mozos, J. Accuracy of high-resolution photogrammetric measurements of gullies with contrasting morphology. Br. Soc. Geomorphol. 2009, 34, 1915–1926.
- Martínez-Casasnovas, J.; Antón-Fernández, C.; Ramos, M. Sediment production in large gullies of the mediterranean area (ne spain) from high-resolution digital elevation models and geographical information systems analysis. Br. Soc. Geomorphol. 2003, 28, 443–456.
- Marzolff, I.; Poesen, J. The potential of 3d gully monitoring with gis using high-resolution aerial photography and a digital photogrammetry system. Geomo 2009, 111, 48–60.
- Marzolff, I.; Poesen, J.; Ries, J.B. Short to medium-term gully development: Human activity and gully erosion variability in selected spanish gully catchments. Landf. Anal. 2011, 17, 111–116.
- Smith, M.W.; Vericat, D. From experimental plots to experimental landscapes: Topography, erosion and deposition in sub-humid badlands from structure-from-motion photogrammetry. Earth Surf. Process. Landf. 2015, 40, 1656–1671.
- Wells, R.R.; Momm, H.G.; Castillo, C. Quantifying uncertainty in high-resolution remotely sensed topographic surveys for ephemeral gully channel monitoring. Earth Surf. Dynam. 2017, 5, 347.
- Kropáček, J.; Schillaci, C.; Salvini, R.; Maerker, M. Assessment of gully erosion in the upper awash, central ethiopian highlands based on a comparison of archived aerial photographs and very high resolution satellite images. Geogr. Fis. Din. Quat. 2016, 39, 161–170.
- Castillo, C.; Pérez, R.; James, M.R.; Quinton, J.; Taguas, E.V.; Gómez, J.A. Comparing the accuracy of several field methods for measuring gully erosion. Soil Sci. Soc. Am. J. 2012, 76, 1319–1332.


