1. State of the Art (Speech)
Considering what has been reviewed thus far, the works that use speech to diagnose schizophrenia are limited, which may be due to the difficulty in obtaining authorization to collect a speech dataset. Typically, the authors record the dataset used. However, within this limitation, most of the works, as in the case of [
28,
46], are based on speech in a natural context. Speech patterns in schizophrenia have also been analyzed in some works but to a lesser extent, as in the case of [
46].
According to this study, the features used to identify schizophrenia are divided into four categories: prosodic, spectral, temporal, and statistical features. However, in addition to these characteristics, a quantitative measure, namely, the number of words (verbosity), was used.
Gosztolya et al. [
43] used only temporal features obtained from spontaneous speech, such as articulation rate, speech tempo, duration of utterance, number of pauses, duration of pauses, pause duration rate, pause frequency, and average pause duration. The authors achieved 70–80% accuracy in classifying subjects with schizophrenia diagnosis [
43].
Other authors used two categories of features. Kliper et al. [
24] used temporal and prosodic features to identify schizophrenia, depression and control. The parameters used include spoken ratio, utterance duration, gap duration, pitch range, the standard deviation of pitch, power standard deviation, mean waveform correlation, mean jitter, and mean shimmer. These parameters allowed the classification of control vs. schizophrenia with an accuracy of 76.19%, control vs. depression with an accuracy of 87.5%, and schizophrenia vs. depression with an accuracy of 71.43%. For multiclass classification they achieved 69.77%.
Martínez-Sánchez et al. [
42] and Rapcan et al. [
47] showed that patients with schizophrenia tend to have slow speech, reduced pitch variability, and a more significant number of pauses. Rapcan et al. [
47] investigated the fundamental frequency (F0) and the relative variation of vocal pitch and, using temporal and prosodic features, attempted to study the total speech duration but did not find a statistical significance and argued that the lack of academic qualifications of the subjects under analysis compromised the results.
Compton et al. [
26] also used two categories of features but, in their case, used prosody and spectral categories. They studied schizophrenic patients and healthy subjects with and without aprosody. They concluded that patients with aprosody present lower F0, F2, and intensity/loudness values.
The severity of negative symptoms in the first outbreak of schizophrenia is correlated with the second-order formant F2. This conclusion was obtained after the study with fundamental frequency F0 and the first and second-order formants F1 and F2 [
34].
He et al. [
48] also detected negative symptoms using the parameters: symmetric spectral difference level (SSDL), quantification error and vector angle (QEVA), and standard dynamic volume value (SDVV), thus discriminating subjects with and without a diagnosis of schizophrenia with an accuracy of 98.2% (with decision trees).
Other authors used three categories of speech features. To identify cognitive and thought disorders. Voleti et al. [
12] tried to find acoustic features of speech. These disorders include various neurological impairments (e.g., dementia) and psychiatric conditions (e.g., schizophrenia). Prosodic articulation temporal and vocal quality features were used. Temporal features include the duration of voiced segments and the duration of silent segments. The prosodic features covered loudness, periodicity measures, and F0. The spectral or articulation features comprise formant frequencies (F1, F2, and F3) and MFCCs. They also used jitter, shimmer, and harmonic-to-noise ratio (HNR) features.
Parola et al. [
49] analyzed three categories of parameters, qualitative indices, quantitative analysis, and multivariate machine learning (ML) tools. Using ML, the results are more promising. For schizophrenia and healthy identification, free speech-based studies provide higher differences between groups.
Some authors used features of all four categories. Agurto et al. [
45] could predict psychosis with 90% accuracy using prosodic, spectral, temporal, and statistical measures. The feature set was formed for spectral characterization by MFCCs, spectral slope, interquartile range (IQR), maximum energy, and frequency. For vowel characterization, they used F1, F2, and F3 (frequencies and their corresponding bandwidth). For voice quality, they used jitter (local absolute value and ppq5), shimmer (local absolute and apq5), autocorrelation, harmonic-to-noise ratio (HNR), and noise-to-harmonic ratio (NHR). For the rhythm changes, pauses (threshold of −25 dB and minimum duration of 100 ms) and voiced parts were considered. For each category mentioned above, the authors calculated the median, IQR, pct5, pct95, skewness, kurtosis, total interventions, speech rate, articulation rate, and speech/non-speech ratio (and corresponding percentages). In addition, they calculated speech rate/velocity of speech and articulation rate. These equations are indicators of cerebral activity, and, using them, it is possible to obtain a cerebral processing rate.
Tahir et al. [
4] state that using a Multi-Layer Perceptron (MLP) neural network classifier allows an assessment of negative symptoms using the features of speaking rate, frequency, and volume entropy. The author also experimented with other types of features such as prosodic features (F0), spectral features including first, second, and third order formants (F1, F2, F3), MFCCs, amplitude (minimum, maximum, and mean volume), conversational/temporal features including duration of speech, speaking turns, interruptions, interjections, and statistical features such as entropy.
Similar to the aim of the previous study, Low et al. [
2] concluded that features such as peak slope, linear predictive coefficients, and mean pause duration are directly correlated with schizophrenia. Quasi-open Quotient—QOQ, F1 range, articulation rate, pause rate, speech rate, time talking, and mean intensity are negatively correlated with schizophrenia. Moreover, the parameters including total number of pauses, mean speech duration, intensity variability, and F0 variability, among others, despite being used in many studies, do not show any correlation with schizophrenia.
Other authors used the semantic level of features. Mota et al. [
31] evaluated the structural characteristics of each interview conducted so that each interview was converted into a graph in which each word is represented by a node and the temporal sequence between two words is represented by an edge (margin). The same procedure was performed every 30 consecutive words to analyze the verbosity. After this procedure, the authors evaluated the number of edges (margins) and the node connection. For semantic analysis, the median semantic distance between two sentences was calculated using latent semantic analysis (LSA). The authors stated that schizophrenia speech produces fewer linked words and less semantic coherence via the structural and semantic features.
On the other hand, for the prediction of psychotic outbreaks (in young people at high clinical risk—CHR), Bedi et al. [
50] evaluated semantic and syntactic features. They detected two features in semantic coherence: the minimum semantic distance for first-order coherence (e.g., the minimum coherence or maximum discontinuity between two sentences) and the average semantic distance for first-order coherence (e.g., the average coherence between sentences). With the studied features, the authors could predict the development of psychosis with 100% accuracy.
The formal linguistic aspects of auditory verbal hallucinations (AVHs) indicate that speaking in the first person is less common in hallucinated speech. Sentences have no grammatical connectivity; speech has no connection and, usually, it is personalized. Thus, although there are individual variations, there is a linguistic profile of typical speech in people with verbal auditory hallucinations [
51].
Some works combine speech acoustic features with text features. Xu et al. [
52] transcribed the interviews (with software help), so it was possible to use speech and text parameters. The verbal speech parameters were LIWC, diction, Latent Dirichlet Allocation, and Doc2vec features. The non-verbal speech parameters were composed of conversational, OpenSmile, and DisVoice elements, thus distinguishing diagnosed and undiagnosed subjects with an accuracy of 76.2% [
52,
53].
One work’s authors [
47] suggest that the lack of academic qualifications can compromise studies in this context. To increase performance, techniques could be applied as suggested in [
17], in which speech is transcribed and text parameters are used simultaneously with the speech parameters.
Speech analysis was also combined with other parameters. In [
28], the algorithm’s performance increased when body movements were implemented as input parameters. For example, [
28] applied low-level descriptors (LLD) and body movements to detect negative symptoms. The LLD set is composed of intensity, loudness, MFCC (12), pitch (F0), probability of voicing, F0 envelope, 8 LSF (Line Spectral Frequencies), and Zero-Crossing Rate. Using an SVM classifier with the LLD alone, the authors obtained an accuracy of 79.49%. If these features were combined with body movements, the accuracy improved to 86.36%.
Feature selection procedures were also implemented. To make a selection of the most promising parameters in the identification of schizophrenia via speech, Espinola et al. [
25] used the Particle Swarm Optimization (PSO) method. Out of a set of 33 features, zero-crossing rate, Hjorth parameter complexity, average amplitude changes, mean absolute value, kurtosis, third and fourth moments, maximum amplitude, peak frequency, power spectrum ratio, mean, and total power (12 out of 33) were selected. With SVM, the authors reached an accuracy of 91.79% in classifying subjects with and without a diagnosis of schizophrenia.
Argolo et al. [
53] concluded that structured interviews or task descriptions are the most commonly used for automated speech evaluation in these studies, similarly to studies based on free speech.
One of the most used machine learning tools is SVM, which has an accuracy rate between 70% and 91.79%. Using MLP, one author [
4] obtained an accuracy of 81.3%. Utilizing Linear Discriminant Analysis (LDA), the authors of [
47] achieved 79.4% accuracy. Using Signal Processing Algorithms, the authors of [
42] achieved 93.8% accuracy in the discrimination between patients and controls. With decision trees, another author [
48] obtained 98.2%. Lastly, the best accuracy achieved was obtained in the work of [
50], which had an accuracy of approximately 100%, but for the prediction of psychotic outbreaks.
Although the set of previously analyzed features can indicate typical characteristics of schizophrenia, they do not identify schizophrenia exclusively. Other mental disorders or an anatomic deformation in the vocal tract can compromise these features. Therefore, the combination of several features is required for a schizophrenia diagnosis.
A summary of the features most used in the literature is presented in
Table 1. The most frequently used speech parameters are divided into four main categories. The prosodic category features mostly used are F0, Intensity/Loudness/Amplitude, Jitter, and Shimmer. In the spectral category, the features more frequently used are frequency formants F1, F2, and F3 and MFCCs. The temporal features mostly used are utterance duration, the duration of pauses, and the number of pauses. For quantitative measures, some authors, such as [
31,
45,
54], suggest that the number of pauses can be promising. Finally, the statistical features mostly used are the number of words and verbosity.
Table 1. Speech features used to identify schizophrenia.
Table 2 shows the parameters used by several authors organized according to the categories to which they belong. Not all of the authors mentioned in
Table 2 attempted to identify schizophrenia via speech; therefore, the “accuracy” column contains a short description. In the case of these authors, no accuracy was reported, and the table presents only theoretical conclusions. In work [
50], the authors achieved 100% accuracy but in classifying psychotic outbreaks in young people at CHR. Therefore, this work is excluded from this accuracy comparison.
Table 2. Accuracy of the speech features in the classification.
Number of Used
Categories |
Categories |
Ref. |
Accuracy (%) |
| 1 |
Prosodic |
[39] |
To evaluate the relative contributions of motor and cognitive symptoms on speech output in persons with schizophrenia |
| Temporal |
[27] |
Language and thought disorder in multilingual schizophrenia |
| [40] |
Understanding constricted affect in schizotypal via computerized prosodic analysis, |
| [43] |
80 |
| [49] |
They identified weak untypicalities in pitch variability related to flat affect and stronger untypicalities in proportion of spoken time, speech rate, and pauses related to alogia and flat affect. |
| [58] |
93.8% (emotion detection) |
| Statistical |
[31] |
They characterized the relationship between structural and semantic features, which explained 54% of negative symptoms variance. |
| [46] |
93 |
| [50] |
100 (psychotic outbreaks in young people at CHR). |
| [57] |
87.56 |
| 2 |
Prosodic and Spectral |
[26] |
The authors used such methods to understand the underpinnings of aprosody. |
| [28] |
79.49 |
| [34] |
F2 was statistically significantly correlated with the severity of negative symptoms. |
| [48] |
98.2 |
| Temporal and Statistical |
[44] |
85 |
| Prosodic and Temporal |
[42] |
93.8 |
| [47] |
79.4 |
| Acoustic and Text Features |
[52,53] |
76.2 |
| 3 |
Prosodic, Spectral, and Temporal |
[4] |
81.3 |
| [17] |
90.5 |
| [25] |
91.79 |
| Prosodic, Spectral, and Statistical |
[55] |
82 |
| [56] |
The association between disorganized speech and adjunctive use of mood stabilizers could perhaps be understood in the context of a relationship with impulsiveness/aggressiveness or in terms of deconstructing the Kraepelinian dualism. |
| Prosodic, Temporal, and Statistical |
[24] |
87.5 |
| 4 |
Prosodic, Spectral, Temporal, and Statistical |
[2] |
The authors provide an online database with their search results and synthesize how acoustic features appear in each disorder. |
| [12] |
90 |
| [45] |
90 |
The most common approach is to use a combined set of parameters (two or more categories). With two categories, the best result obtained was using prosodic and spectral parameters, as in the work of [
48] (98% accuracy). Using three categories, the best result was obtained with prosodic, spectral, and temporal features (92% accuracy in [
25]). Using the four categories, the maximum accuracy of 90% was achieved in two works.
The use of temporal features alone does not present a discriminant power that can be considered for the identification of schizophrenia, and similarly to other authors, it will be an advantage to combine at least two categories of parameters. The more promising category are the prosodic and spectral features.
The prosodic features F0 and its derived ones, such as QEVA, SDVV, and the spectral SSDL (derived from the spectrogram), have the best performance in schizophrenia classification.
2. Speech Features Description
This section describes the speech features mentioned previously.
The fundamental frequency (or pitch) measures the frequency of vibration of the vocal folds; consequently, its inverse is the fundamental or glottal period. There are several methods for estimating the fundamental frequency. The most robust is estimating the first peak of the normalized autocorrelation of the signal [
59].
The intensity (loudness or amplitude) is defined as the acoustic intensity in decibels relative to a reference value and is perceived as loudness [
2].
Jitter measures deviations in frequency between consecutive glottal periods, and this commonly used method is based on the DSYPA algorithm (dynamic programming project phase slope algorithm). This algorithm estimates the opening and closing instants of the glottis (glottal closure instant) [
59]. Jitter can be measured in four different ways, but the most used ways are relative jitter (jitter) and absolute jitter (jitta). Relative jitter is the mean absolute difference between the consecutive glottal periods divided by the mean period and is expressed as a percentage. The absolute jitter is the variation of the glottal period between cycles (the mean absolute difference between consecutive periods) [
60].
The shimmer is related to the magnitude variation along the glottal periods, which can be measured in four different ways. Relative Shimmer (Shim) and Absolute Shimmer (ShdB) are the most used. Relative Shimmer is defined as the mean absolute difference between the magnitudes of consecutive periods divided by the mean magnitude and is expressed as a percentage. The Absolute Shimmer is expressed as the peak-to-peak magnitude variation in decibels [
60].
The remaining determinations forms of jitter and shimmer are not used because in a statistical study carried out by [
61] they did not show statistically significant differences between jitter and relative shimmer correspondingly.
The Harmonic-to-Noise Ratio (HNR) measures the ratio between harmonic and noise components, quantifying the relationship between the periodic component (harmonic part) and aperiodic components (noise). HNR can be measured by the ratio between the amplitude of the first peak of the normalized autocorrelation, considering that this is the energy of the harmonic component of the signal, and its difference to one, that is the noise energy. This feature can be obtained with Equation (1), where H is the harmonic component given by the energy of the signal’s first peak of the normalized autocorrelation. The final value of HNR is the average along all segments [
60].
The Noise-to-Harmonic Ratio NHR can be calculated by Equation (2). To determine the autocorrelation, it is necessary to multiply the normalized autocorrelation of a segment of a speech signal by the normalized autocorrelation of a window (ex. Hanning window). Then, the first peak of the segment signal is the autocorrelation.
The Quantization Error and Vector Angle (QEVA) contain two indicators, the mean value of the cumulative error and the mean value of the vector angle. Both indicators are calculated based on the fundamental frequency curve and fit the fundamental frequency curve. The QEVA permit evaluates the stability and similarity of the successive fundamental frequencies of the speech signals [
48].
The Standard Dynamic Volume Value (SDVV) considers the monotonous speed and intensity of speech. Considering the speaking behavior of schizophrenic people, it is related to flat affect in schizophrenic patients. The calculation is divided into three steps. The first step is the intensity calculation based on voice segments (Equation (3)), where Mws represents the intensity of speech, M is the number of voice segments, ω denotes the voice segment, L is the length of one voice segment, i denotes the index of speech content from a speaker, j represents the index of voice segments in the speech content, and r is adopted to regularize the amplitudes of voice segments.
The next step consists of determining the normalized exponent variance calculation using Equation (4), where Vs represents the exponent variance in a sentence; s(n) denotes the normalized sentence; s(n)¯¯¯¯¯¯
is the mean value of all the data points in the sentence, including those in the word intervals; Sl is the length of the whole sentence; and t is also adopted as r.
The last step consists of the standard dynamic volume value calculation using Equation (5). It aims to represent the intensity variations in speech signals more objectively.
The Velocity of Speech and Articulation Rate (Equations (6) and (7)) correspond to the ratio between the number of syllables and the total time recorded with and without the duration of pauses.
The peak slope corresponds to the slope of the regression line that fits lof10 of the maxima of each frame [
2].
The Mel Frequency Cepstral Coefficients (MFCC) are used to obtain an approximation of the perception of the human auditory system to the frequencies of sound. They are calculated via the frequency spectrum of small windows of the speech signal, which is obtained by the Fast Fourier Transform (FFT). Subsequently, the frequency spectrum is subjected to a bank of triangular filters, equally spaced in the Mel frequency scale, via the discrete cosine transform applied to the output of the filters. Between 13 and 20 coefficients are usually determined. Finally, energy and delta (variations along the sequence of MFCCs speech segments) are calculated [
60].
The frequency formants F1, F2, and F3 correspond to the first, second, and third peaks in the spectrum resulting from a human vocal tract resonance.
The linear predictive coding (LPC) coefficients are the best method to predict the values of the next time point of the audio signal using the values from the previous
n time points, which is used to reconstruct filter properties [
2].
Symmetric Spectral Difference Level (SSDL) reflects the distribution of frequency components in the speech spectrum. It is calculated using Equation (8) [
48], where N is the number of words in one emotional text; n is the word index; m denotes a factor for adjusting the symmetric amplitude difference; and a is the exponential factor, which constrains the distribution range of SSDL values.
Cn is the inverse of En (Equation (9)):
The Zero-Crossing rate (ZCR) is the rate at which the signal changes from positive to negative and back, which is defined in Equation (10), and sgn x(k) in Equation (11).
The utterance duration corresponds to the time taken to say the utterance, and the number of pauses corresponds to the number of silences in the speech without counting the silence of occlusions in the stop consonants. The duration of pauses corresponds to the time duration of these silences. The gap duration is any segment of recording with no subjects’ speech [
24]. The proportion of silence (in percentage) is the relationship between the duration time of all silence segments (without the occlusion of stop consonant) and the total duration of the speech. The total recording time is the total duration of the conversation.
Voiced and unvoiced percentages correspond to the relationship between speech and silence in total time recorded in the discourse. Quasi-open Quotient (QoQ) is the ratio of the vocal folds’ opening time [
2]. The number of words and verbosity correspond to the number of words in the discourse. Speaking turns correspond to the number of changes between the speakers in the discourse. The interruption is when someone speaks and is interrupted. The interjection corresponds to a sound that contains no information (e.g., “hmmm”).
The probability of voicing is the probability that speech is present and generally returns a row vector with the same length of speech signal. This value can be obtained with a function such as “voiceActivityDetector” in Matlab Software.
The Interquartile range (IQR) is the difference between the upper and lower quartile in an order data set. The skewness is a measure of the lack of symmetry; the data are symmetrical if it looks the same to the left and right of the center point. The kurtosis is a measure of the relative peakedness of a distribution. The slope sign changes are a statistical feature defined as the number of times the slope of the signal waveform changes sign within an analysis window. The Hjorth feature is divided in three parameters: activity, mobility, and complexity. The activity gives a measure of the squared standard deviation of the amplitude of the signal x(t) (Equation (12)), the mobility represents the mean frequency or the proportion of the standard deviation of the power spectrum (Equation (13)), and the complexity indicates how the shape of a signal is like a pure sine wave and gives an estimation of the bandwidth of the signal (Equation (14)) [
62].
The minimum and mean semantic distance for first-order coherence are measured as an index of “disorder” in the text [
50].
3. Emotion Detection in Speech
It is not easy to understand human emotions quantitatively, but understanding them is fundamental to human social interactions. The best way to analyze them is by assessing facial expressions or speech [
63].
The emotional state is vital for ensuring a good lifestyle and can be influenced by social relations, physical conditions, or health status. Various sources of information such as facial expression, brain signals (EEG), and speech can be used to identify a person’s emotion [
63].
There are six basic emotions, including anger, happiness/joy, disgust, surprise, fear, and sadness, and a neutral emotional state. The other emotions are derived from these [
54].
Since anhedonia (the inability to feel pleasure or satisfaction), hallucinations, and delirium are symptoms of schizophrenia, the last two of which can be accompanied by strong emotions, these symptoms can lead to a decrease in motivation and a limitation of social life. Hallucinations and delusions can also lead to an increase in anxiety and stress levels.
Emotions are convoluted psychological states composed of several components, such as personal experience and physiological, behavioral, and communicative reactions [
11]. Studies with schizophrenic people show that they suffer difficulties in emotional recognition [
64].
An emotional state is a feature in patients with schizophrenia [
2].
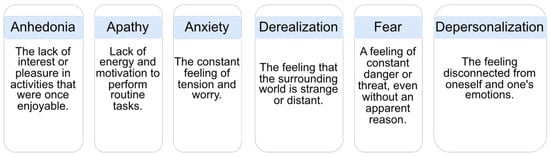
Figure 2 represents the most common emotions in schizophrenia. If possible, finding an emotional state based on speech features may be a further advantage for applications in the future context of this work.
Figure 2. Emotions in schizophrenia.
Modulations in pitch [
41] often control the emotional state. Most of the relevant developed work is based on using prosodic analysis to recognize emotional features.
Emotion classification is one of the most challenging tasks in speech signal processing [
65]. In the work developed in [
58], the authors show that acoustic and prosodic information can be combined and integrated with a speech recognition system using suprasegmental states. The same authors state that prosodic information is essential for the reliable detection of a speaker’s emotional state.
Speech emotion recognition (SER) parameters can be divided into acoustic and non-acoustic. Within acoustic, they can be grouped into different categories: prosody, spectral, wavelet, nonlinear, speech quality, and deep learning-based (encoder). The prosody features, mainly derived from F0, discriminate well between high and low arousal emotions (sad and happy). Spectral features extract the energy content of different frequency bands; the most used in emotion recognition are MFCC, Linear Predictive Cepstral Coefficients (LPCC), and Perceptual Linear Prediction (PLP) coefficients. The wavelet-based features provide better temporal resolution for the high-frequency components and better frequency resolution for the low-frequency components. Voice quality features measure the attributes related to the vocal cords (e.g., jitter, shimmer, instantaneous pitch, phase, energy, autocorrelation, harmonic-to-noise ratio (HNR), normalized noise energy (NNE), and glottal noise excitation (GNE)). Nonlinear features capture the complexity of speech signals on different emotions. The most popular are correlation dimension (CD), largest Lyapunov exponent (LLE), Hurst exponent (HE), and Lempel–Ziv complexity. The deep-learning-based features are directly given to a machine learning tool, such as a convolutional neural network (CNN) or a long–short-term memory network (LSTM). The encoder layer of the deep-learning architecture model contains the abstract features of input speech. Non-linguistic features include non-verbal activities, such as laughter or crying, that can be detected using an automatic speech recognition system [
66].
Paralinguistic features include attitudinal, intentional, and stylistic information [
67]. They are essential for understanding and interpreting the pronunciation and identification of an emotional state [
42]. Word choice likely indicates a speaker’s emotional state [
58].
For the detection of an emotional state, the MFCCs [
68,
69,
70], zero crossing rate, energy, the entropy of energy, spectral centroid, spectral spread, spectral entropy, spectral flux, spectral roll-off, chroma vector, and chroma deviation [
71] were used in previous studies.
Yadav et al. [
72] presented a method to detect moments in the emotional state using Zero Time Windowing (ZTW) based on spectral energy. This method sums up the three spectral peaks at each instant of the sample Hilbert envelope of Numerator Group Delay (HNGD).
This entry is adapted from the peer-reviewed paper 10.3390/bioengineering10040493