1. The Fluorescence In Situ Hybridization (FISH) Technique
The FISH mapping technique is based on two main principles: the target and the probe. The target can be a whole chromosome (or chromosome arms) or a specific chromosome region. The probe is prepared according to the size of the target and is typically: (a) cDNA (generally applied when the target gene is a multi-copy); (b) cosmids with DNA insert sizes of 20–40 kb; (c) bacterial artificial chromosomes (BACs) with DNA insert sizes of 100–300 kb; (d) yeast artificial chromosome (YAC) clones (these are actually not used because they have a low cloning efficiency and show a high level of chimerism); (e) chromosome painting probes (obtained by cell sorter or chromosome microdissection techniques) that can visualize parts of or entire chromosomes; and (f) CGH arrays to check for genomic gains or losses. The probes are labeled directly with fluorochromes or indirectly with molecules that bind to the probe via fluorochrome-conjugated antibodies. The probe is specific for the target, based on complementary DNA base pairing, which allows the fluorescence-labeled probes to hybridize and form specific fluorescent signals on specific chromosome regions.
The advent of the fluorescence in situ hybridization (FISH) technique, initially applied to human chromosomes [
20,
21], noticeably expanded cytogenetics research and investigations applied to domestic animals due to the possibility of revealing specific chromosome regions, entire chromosomes, or chromosome arms according to the choice of probe. One of the great advantages of the FISH technique is that it can be applied to interphase cell nuclei, meiotic preparations (sperm and oocytes), embryos, and elongated chromatin fibers, in addition to metaphase chromosomes, thereby allowing more complete cytogenetic investigations of animal cells. The following sections describe the main uses of FISH in domestic bovids.
2. FISH and Chromosome Abnormalities
The first study to apply FISH for the precise identification of the chromosomes involved in a chromosome abnormality was published by Gallagher et al. [
22], who discovered an X-autosome translocation (X;23) using both Q-banding and a BoLA Class I cDNA probe. The probe shows hybridization signals to the normal chromosome 23 and to the translocated autosomal material present on the X chromosome, allowing a more precise localization of MHC (major histocompatibility complex) in cattle than was achieved earlier by genetic mapping. Several subsequent studies also applied FISH to obtain better confirmation of the chromosome(s) involved in abnormalities (especially when banding was poor) and identification of the break points, especially in reciprocal translocations.
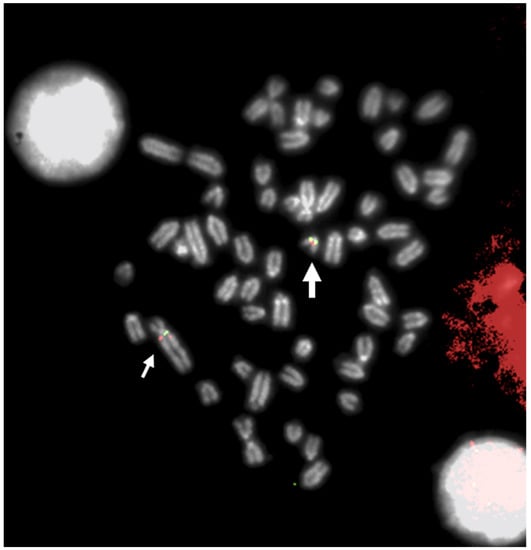
Figure 1. FISH mapping with a BAC clone mapping proximal to BTA29 (large arrow) and proximal to q-arms (BTA1) of rob (1;29) (small arrows). Indeed, a small chromosome region of 5,4 Mb translocated from proximal BTA29 to the proximal region of BTA1 (with an inversion), originating rob (1;29) [
56]. Different colors indicate different BACs.
A more complete classification of all chromosome abnormalities studied by classical cytogenetic techniques alone or (in some cases) with other molecular cytogenetic techniques is provided by Iannuzzi et al. [
11].
Two examples of the importance of the use of FISH for the correct identification of the chromosomes involved in chromosome abnormalities of cattle were a case of autosome trisomy and two types of Robertsonian translocations. A case of autosome trisomy 28 in an abnormal calf, revealed by both R-banding and FISH mapping with a specific molecular marker [
33], was identified, and the same abnormality was reported earlier as trisomy 22 using only the banding technique [
86]. Two robs earlier reported as rob (4;8) [
87] and rob (25;27) [
88] in cattle were later corrected as rob (6;8) and rob (26;29), respectively, using C-, G-, and R-banding and FISH mapping with specific molecular markers and the use of HSA painting probes [
28].
FISH mapping applications were used for the diagnosis of chromosome abnormalities in both metaphase (the majority) and interphase cells, the latter applied to lymphocyte nuclei (Figure 2), sperm (Figure 3), oocytes, and embryos.
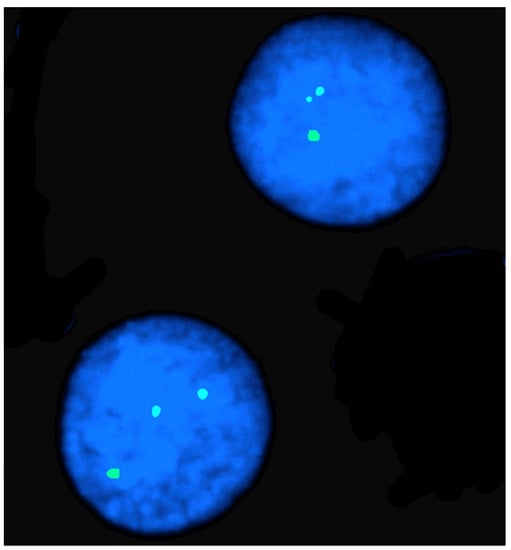
Figure 2. FISH mapping in an interphase nucleus of a female river buffalo affected by X-trisomy. Note the three hybridization signals due to the X chromosome PGK marker.
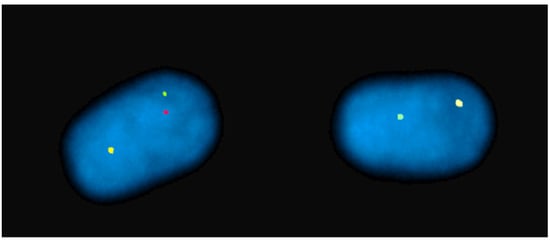
Figure 3. Sperm-FISH in a river buffalo bull carrying a rob (1p;18) using BAC probes for BBU 1p (red), BBU 1q (green), and BBU 18q (yellow) chromosomes. Normal sperm nucleus with 1/1/1 fluorescent phenotype and separate signals on left. Unbalanced sperm nucleus with 1/0/1 fluorescent phenotype on right.
Concerning the studies on meiotic preparations, those performed on the synaptonemal complexes (SCs), especially in spermatocytes, were particularly important for establishing the regularity of the pairing processes during the pachytene substage of meiotic prophase in animals carrying chromosome abnormalities (reviewed in [
89]). Recent analyses of meiotic preparations have been performed using immune fluorescence approaches and have provided more detailed information on SCs [
90,
91,
92]. Other studies have addressed the fragile sites in the chromosomes of domestic animals (reviewed by [
93]), and limited studies have used CGH and SNP arrays to establish possible genomic losses occurring during chromosome rearrangements (
Table 1).
FISH mapping was also very important for the definitive establishment of the agreement between various chromosome nomenclatures due to some discrepancies found during the Reading conference [
94] and the subsequent ISCNDA1989 [
95] (the inverted position between BTA4 and BTA6, as well as the correct position of BTA25, BTA27, and BTA29). This aspect was vital for the clinical cytogenetics of domestic bovids, as it allowed a correct identification of the chromosomes involved in chromosome abnormalities. During the Texas conference [
96], specific molecular markers (only type I loci) were selected for each bovine syntenic group and each cattle chromosome based on previous standard chromosome nomenclatures.
The next advance was the application of FISH mapping by two labs that used 31 selected BAC clones (from the Texas Conference) on RBG- and QBH-banded cattle preparations [
97]. The chromosome-banding homologies among bovids (cattle, sheep, goats, and river buffalo) were then used to establish a definitive standard chromosome nomenclature for the main domestic bovid species [
98]. Subsequent studies using FISH mapping and the same Texas markers on river buffalo, sheep, and goat R-banded chromosomes [
99,
100] definitively confirmed the chromosome homologies among domestic bovids, as established at the ISCNDB2000 [
98].
3. FISH in Physical Mapping
The identification of the DNA structure [
101] paved the way for the development of in situ hybridization technology. In the early stages of its development, this technology allowed the localization of genes using radioactive probes [
102]. It was also used in studies of domestic animals [
103,
104], but the greatest diffusion of the physical mapping of genes awaited the development of fluorescent probes [
105]. One of the first examples was the localization of bovine alpha and beta interferon genes [
106], and this localization was rapidly replicated in buffalos, goats, and sheep [
107,
108]. Subsequently, many other localizations were obtained using this technology.
Considering the practical impossibility of compiling a complete list of all gene localizations obtained using this technology, some significant examples are listed in Table 2.
Table 2. Gene mapping obtained with FISH in domestic bovids. Type I and type II markers are expressed with polymorphic (SSRs, microsatellite, STSs) sequences, respectively.
Localization sometimes involved a single gene [
124,
129] or a family of genes [
132]. Other reports, however, mapped many genomic markers [
100,
141]. A point to remember is that FISH technology has significantly benefited from the availability of BAC genomic libraries—elements that represent the ideal source for the construction of the probes. Among these, the INRA library [
144] and the CHORI-240 have played relevant roles. The publication of genomes [
145,
146,
147,
148] has since inevitably diminished interest in using this technology for mapping genetic factors, although genetic factor mapping continued for species whose genomes were sequenced later, such as the water buffalo [
149]. However, this technology has proved useful in several aspects, including: a) the identification of errors in genomic assembly [
150]; b) the refinement of genome assembly [
151]; and c) the mapping of sequences not included in genomic assemblages [
152]. Clearly, the interest today is very limited in locating a genetic factor in a species whose genomic sequence is available, but this does not mean that FISH technology is no longer indispensable for solving other problems related to the organization of genomes.
The mapping of genomic elements by FISH has also been used successfully for the physical mapping of data obtained by other technologies. The first examples concerned the physical anchoring of a genetic map to a chromosome [
153,
154,
155] and the mapping of a synteny group to a specific chromosome [
114]. Subsequent examples of the combined use of FISH and genetic maps followed [
127,
156].
4. Comparative FISH Mapping
Two main methods have been applied thus far to obtain a FISH mapping comparison between related and unrelated species: Zoo-FISH, which uses chromosome painting probes, and FISH mapping, which uses specific molecular markers of both type I and type II. Zoo-FISH is a molecular technique that provides an easier comparison between related and unrelated species from a macro point of view. The term was first reported by [
157], based on earlier studies that used genomic chromosome painting probes, obtained by cell sorter chromosomes, to compare related species [
158,
159,
160].
Zoo-FISH was first applied in domestic animals when human chromosome painting probes became commercially available. This approach demonstrated the conservation of several human chromosome segments in both domestic bovids (
Table 3) and other domestic species (reviewed in [
161]).
Table 3. Comparative FISH mapping in domestic bovids with related and unrelated species.
The use of human-chromosome painting probes allowed the identification of a substantial number of human chromosome segments (around 50) in bovid chromosomes [
175,
176,
217,
218,
219]. Zoo-FISH has also been applied to correctly identify some chromosomes involved in the chromosome abnormalities shown in
Table 1. The availability of specific painting probes obtained by both cell sorting and/or by the microdissection of specific chromosomes (or chromosome arms) from domestic animals extended these studies to investigations between related species (
Table 3). For example, in cattle, Zoo-FISH was applied to study X-Y aneuploidy in sperm [
55] and in oocytes [
58] (
Table 1). An interesting approach was demonstrated in two studies characterizing two cases of goat/sheep [
220] and donkey/zebra [
221] hybrids using multicolor FISH (M-FISH), starting from painting probes obtained from microdissected river buffalo chromosomes (or chromosome arms) and from flow-sorted donkey chromosomes, respectively.
Chromosome painting probes allow the delineation of large, conserved chromosome regions between related and unrelated species, as reported above. The use of comparative FISH mapping using several chromosome markers to map a single type I or type II locus along the chromosomes allows a more accurate establishment of the gene order within chromosome regions, thereby confirming that chromosome rearrangements occurred to differentiate related or unrelated species in key evolutionary studies (
Table 3). These detailed comparisons have confirmed a high degree of autosome (or chromosome arm) conservation among all bovid species. The main autosome difference found thus far in bovids was a chromosome translocation of a proximal chromosome region from
Bovinae chromosome 9 to
Caprinae chromosome 14, as demonstrated by both chromosome banding and, in particular, by a molecular marker (COL9A1) mapping proximal to
Bovinae chromosome 9 and proximal to
Caprinae chromosome 14 (reviewed in [
9]). This translocation involved a genome region of about 13 MB and was followed by an inversion in
Caprinae chromosome 14, as demonstrated earlier [
213]. This chromosome event was common to all remaining
Bovidae subfamilies, leading to the conclusion that the
Bovinae subfamily is an ancestor to the remaining
Bovidae subfamilies (reviewed in [
9]).
In contrast to autosomes, sex chromosomes are differentiated by more complex chromosome rearrangements. Indeed, the
Caprinae X chromosome (as for all remaining X chromosomes of the other
Bovidae subfamilies) is differentiated from the ancestor
Bovinae X (very probably a large acrocentric chromosome, such as that of the water buffalo) by at least three chromosome transpositions and one inversion (reviewed in [
9]). Detailed FISH mapping data are also useful for better anchoring of both genetic and RH maps [
203,
222,
223,
224]. The availability of detailed cytogenetic maps in bovid species allowed a better comparison of the bovid and human chromosomes, especially using type I loci. These comparisons facilitated the translation of genomic information from the human genome to the genomes of domestic animals, especially in those with no genome sequencing available. These comparisons also revealed a very high number of chromosome rearrangements that differentiate bovid species from humans. Indeed, the conservation of entire chromosomes or large regions of them between bovid and human chromosomes, as revealed by Zoo-FISH, was the result of complex chromosome rearrangements that differentiated human and bovid species according to their gene order.
5. Fiber-FISH
The various FISH mapping techniques developed for human cytogenetics (reviewed by [
225]) include SKY-FISH (spectral karyotyping FISH), Q-FISH (quantitative FISH), M-FISH (multicolor FISH), heterochromatin-M-FISH, COBRA-FISH (combined binary ratio labeling FISH), cenM-FISH (centromere-specific M-FISH), and fiber-FISH. Among these techniques, only fiber-FISH and M-FISH have been applied to domestic bovids. The use of fiber-FISH yields high-resolution maps of chromosomal regions and related genes on a single DNA fiber. This approach establishes the physical location of DNA probes with a resolution of 1000 bp. It is particularly useful for detecting gene duplications, gaps, and variations in the nuclear genome. The DNA fibers are obtained from nucleated cells by releasing the DNA fibers from the nucleus, stretching them mechanically, and then fixing them on slides [
226] (
Figure 6).
Table 4 summarizes the studies that have used this technique in domestic bovids.
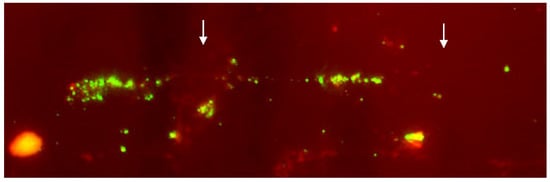
Figure 6. Details of the fiber-FISH performed on a lymphocyte nucleus of cattle affected by arthrogryposis using a BAC clone containing the survival of motor neuron gene (SMN). The presence of two groups of linear hybridization signals (arrows) supports the hypothesis that SMN was at least duplicated [
135].
Table 4. Studies using the fiber-FISH on domestic bovids.
6. CGH Arrays
The CGH array technology, an evolution of in situ comparative genomic hybridization (CGH), is a method of cytogenetic investigation that emerged in the 1990s to overcome the limitations of common banding cytogenetic analyses, especially those involving the presence of genomic imbalances, such as duplications or deletions [
231,
232]. In situ CGH technology has many similarities to FISH: the support used is the same, i.e., denatured metaphases fixed on slides and the approaches to label the probes are identical. However, in this case, the probes are produced using complete genomic DNA deriving from two subjects: typically, one healthy and one relating to the subject being investigated. The two DNAs are labeled with two different fluorochromes and then hybridized simultaneously on the slide. In the hybridization phase, a competition is therefore created between the probes, and in the presence of a normal chromosomal segment, an intermediate color is obtained, while in the presence of chromosomal alterations, a fluorescence closer to one of the two colors used is obtained. Although this technology has been widely used and has provided important results, its major limitation lies in the resolution. CGH array technology follows the same principle, but the support is no longer represented by slides but by synthetic DNA fixed on slides. Initially, the chips for CGH array analyses contained DNA extracted from BAC to provide as uniform a representation of the genome as possible [
233]. Current CGH array analyses are performed using devices containing oligonucleotides chosen that uniformly cover the whole genome and achieve resolutions of 5–10 kb [
234,
235]. More information about this technology and its use is provided by [
236]. In species of zootechnical interest, CGH array analyses (
Figure 7) became common following the appearance of the first commercial arrays, and these analyses are conducted essentially for two purposes: the identification of copy number variation (CNV) polymorphisms and the characterization of chromosome anomalies. CNVs are polymorphic variations present very frequently in the genomes of higher organisms [
237,
238,
239]. In humans, approximately 4.8–9.7% of the genome contains CNVs [
240]. The introduction of commercial arrays has allowed the use of this technology to obtain a great amount of information about the distribution of CNVs in species differences and how these variations are related to phenotypic traits. The transfer of this technology to the animal field and the availability of commercial arrays has led to the publication of several reports (
Table 5).
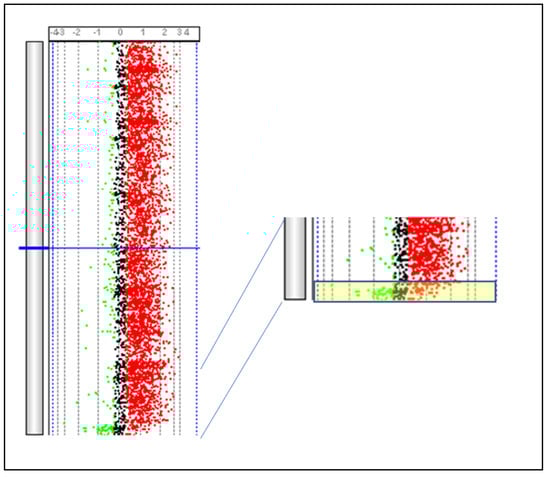
Figure 7. Identification of the PAR region present on BTAX and BTAY. The PAR region (yellow box) is identified by comparing DNA obtained from a male subject and that obtained from a female subject using a SurePrint G3 Bovine CGH Microarray 180 k (Agilent Technologies, Santa Clara, CA, USA). Parma P. Personal communication.
Table 5. Identification of CNV.
This entry is adapted from the peer-reviewed paper 10.3390/ani13050944