1. Overview of Coronavirus Decay Rates in Waters
Table 1 summarizes the collected decay rates from the literature under different conditions and
Table 2 shows the result of the multivariate analysis of variance. The collected dataset contained two category variables (detection methods, type of water) and water temperature as a continuous variable. Multivariate analysis of variance showed that all these three variables led to significant differences in decay rate constants (
p < 0.001) (
Table 2). Most significantly, the collected decay rates were impacted by the different detection methods (
p = 1.68 × 10
−8). The three SARS-CoV-2 RNA decay rates (0.96–4.32 d
−1) reported by Weidhaas et al. [
19] were significantly higher than average reports, thus being identified as outliers and excluded from the following modeling analysis. After the exclusion, the decay rate constants of SARS-CoV-2 RNA in wastewater ranged from 0.04 to 0.7 for temperatures 4–37 °C (
Table 1), whereas the infectivity of coronaviruses decays at much faster rates (0.066–3.4 d
−1), from 4 to 25 °C in wastewater. In freshwater, the decay rates of SARS-CoV-2 RNA (0.039–0.25 d
−1 at 4–37 °C) were also lower than those of coronavirus infectivity (0.01–1.2 d
−1 at 4–24 °C), although the difference between two methods was not as much as that in wastewater.
Table 1. Summary of decay rate constants (d−1).
Table 2. Summary of multivariate analysis of variance.
The nucleic acids of viruses may persist longer than viral capsid and remain detectable after losing infectivity; hence, the decay rates of SARS-CoV-2 RNA are supposed to be much lower than those of coronavirus infectivity [
14]. The greater stability of genetic fragments makes them suitable candidates for WBE investigations. At the same time, it also indicates that the environmental detection of viral RNA alone does not substantiate the risk of infection. On the other hand, knowledge about the fate of infectious viruses is needed to evaluate the potential disease transmission through urban wastewater systems, especially through sewers, where stormwater infiltration and saltwater intrusion might occur. Considering the scarcity of available data for seawater, the subsequent analysis and discussion mainly focused on wastewater dilution via freshwater inflow.
2. Effect of Wastewater Dilution on Coronavirus Decay
The decay rates of SARS-CoV-2 RNA in seawater (0.14 d−1 at 20 °C) and in freshwater (0.039 d−1 at 4 °C, 0.15 d−1 at 25 °C, 0.25 d−1 at 37 °C) were smaller than those in wastewater (0.04–0.18 d−1 at 4 °C, 0.17–0.70 d−1 at 20–26 °C, 0.29–0.41 d−1 at 37 °C) (Table 1). Thus, the freshwater infiltration and seawater intrusion could alleviate the decay of viral RNA and may alleviate the impact of decay on WBE back-calculations.
On the contrary, the reduction in virus viability was enhanced in seawater, which led to higher decay rates (1.1 d
−1 at 4 °C and 2.0–2.1 d
−1 at 20 °C) than in wastewater (0.066–0.42 d
−1 at 4 °C and 0.6–1.4 d
−1 at 20 °C). However, such a difference is less confirmative, based on the limited data points. Sun et al. [
24] suggested that the virus infectivity was not significantly affected by seawater; however, Lee et al. [
25] reported a rapid infectivity loss of SARS-CoV-2 immediately upon being introduced into seawater. It should be noted that Sun et al. [
24] examined the stability of the virus in artificial seawater while Lee et al. [
25] used real seawater (pH 8, salinity 32‰; Sokcho, Korea). The contradictory results might be caused by the indigenous microbial communities in the marine ecosystem, which might inactivate viruses via proteolytic or nuclease activity [
26].
Generally, the salinity and alkalinity of seawater are believed to influence the osmotic pressure and may reduce the survivability of coronaviruses in the ocean, thus helping to eliminate the risk of virus transmission [
13,
27,
28]. Although SARS-CoV-2 is a mammalian virus, the release of viable coronaviruses through municipal sewage into the ocean may affect the marine ecosystem and even cause virion accumulation in seafood such as oysters or fishes through food chains in the same way as norovirus [
29]. Interestingly, the COVID-19 outbreak first originated from a seafood market in Wuhan. Later, many infection cases caused by frozen cold chain food products have been reported around the world [
30,
31]. More consolidated experimental evidence should be involved to confidently exclude the possibility of marine contamination and confirm the safety of the seawater environment even for recreation purposes. Moreover, more experimental investigations in seawater mixed with domestic wastewater are necessary to delineate the effects of salinity on SARS-CoV-2 decay rate constants [
32].
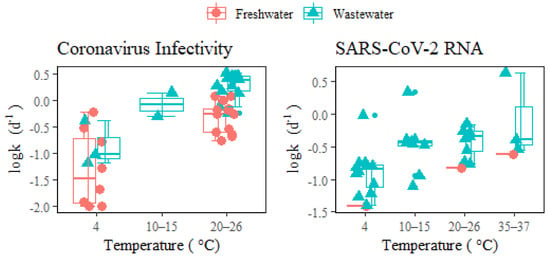
Figure 1 illustrates that both coronavirus infectivity and SARS-CoV-2 RNA decay more rapidly in wastewater than in freshwater under different temperatures. The difference at a lower temperature (4 °C) may not be as significant as that at higher temperatures (>20 °C). The increased
k of coronaviruses in wastewater compared to freshwater could be attributed to the deactivation from higher extracellular enzymatic activity, eukaryotic predation, or the presence of antiviral chemicals (such as solvents, detergents, etc.), and other organic matters in wastewater [
7]. Unlike neutral freshwater, wastewater usually has an acidic pH with fatty acids and other constituents that affect virus decay through the denaturation of capsid proteins and damage of nucleic acids [
2]. Wastewater dilution via stormwater could alleviate the inactivation of infectious coronaviruses, thus potentially leading to the release of viable viruses into natural water bodies or city catchments via sewer overflow or untreated discharges [
33,
34,
35]. Additionally, storm weather is often accompanied by lower temperatures and shorter in-sewer hydraulic retention times, which favor virus survival in waters. Therefore, the risk of spreading infective viruses during heavy rainfall events and urban floods should be carefully evaluated given the ever-increasing virus load in municipal wastewater.
Figure 1. Decay of coronavirus infectivity and SARS-CoV-2 RNA in freshwater and wastewater under different temperatures. The middle lines inside the box represent median k values. The top and bottom borders of the box represent the 75%ile and 25%ile of k values, respectively. The top and bottom whiskers represent the upper and lower limit of k values in the groups. In addition, the smaller dots represent the outliers.
3. Effect of Temperature on Coronavirus Decay
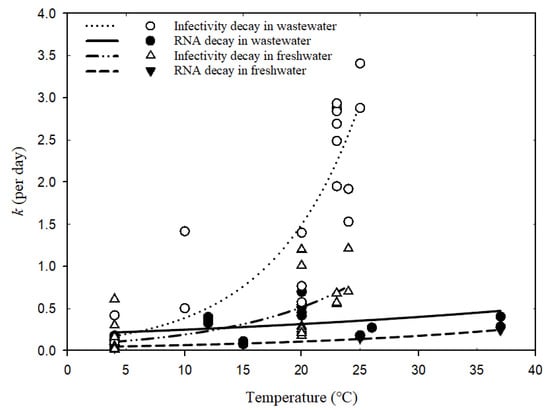
Figure 2 shows the fitted curves for the numerical relationship between decay rate constants and temperatures in wastewater and freshwater based on the Arrhenius equation (Global goodness of fit: R2 = 0.84). Table 3 shows the estimated parameters of the temperature correction coefficient (λ), decay rate constant (k20) at a reference temperature of 20 °C, and R2 for each scenario. The poor fitness and wide confidence band (Table 3) for coronavirus infectivity decay in freshwater might be due to biological differences within coronavirus surrogates and the variability in matrix conditions (tap water versus river water). The even lower fit of SARS-CoV-2 RNA decay in wastewater (R2 = 0.2) could be a result of the varied detection assays applied for RT-qPCR detection or the wastewater conditions (autoclaved, sterilized, or untreated wastewater sampled from various locations), which made the comparison among fitted parameters λ and k20 less convincing. More studies via well-controlled experiments are needed to obtain consistent and reliable conclusions. The detailed reporting of environmental parameters for decay tests should also be encouraged to help understand the influencing factors across different studies.
Figure 2. Relationships between decay rate constants of coronavirus and temperatures based on Arrhenius equation (Equation (3)).
Table 3. Parameters in Arrhenius equation fitted by temperatures and decay rates.
According to the estimated
k20 values in
Table 3, the infectivity decay rates were much higher than SARS-CoV-2 RNA, which indicates a greater stability of RNA than the hosting virus body in the water environment [
26] and resonates with the previous discussion. Moreover, both viable coronaviruses and SARS-CoV-2 RNA presented higher stability in freshwater over the wastewater matrix, probably due to the lower abundance of microbial communities and limited biological activity in freshwater, where degradation is alleviated for viruses [
36].
For each group in different water types, the temperature correction coefficient
λ was calculated to be greater than one, indicating the influential role of water temperature on decay rates. Higher temperatures would enhance virus decay since the decay rate constants increase with elevated temperatures (
Figure 2). In particular, the infectivity decay of coronavirus in wastewater was most significantly enhanced by temperature increase (
λ = 1.14 ± 0.05), followed by the infectivity decay in freshwater (
λ = 1.10 ± 0.05). Warmer waters normally increase decay rates of microorganisms via activating enzymes and, consequently, the degradation of protein walls or nucleic acids [
37]. Exposure of viruses to high temperatures may also inactivate the enzymes and prevent replication. Since wastewater has more biologically and chemically active components than freshwater, the decay of viable viruses would be more vulnerable to temperature variation in wastewater.
For less sensitive SARS-CoV-2 RNA, temperature increments seem to play a similar role in facilitating decay both in freshwater and wastewater, as suggested by the comparable values of
λ (
Table 3) and the two visually parallel curves in
Figure 2. Nucleic acid fragments inside the viral particles are less easily degradable by extracellular enzymes and more persistent than virus infectivity [
14,
38]. The genetic sequence may degrade gradually into smaller pieces and thus allow the RNA fragments to be prolonged after losing the protection from viral capsid. Hence, their decay rates are less impacted by temperature elevation than those of viable viruses, regardless if in freshwater or wastewater. Although the change in SARS-CoV-2 RNA decay rates in wastewater caused by seasonal temperature variation was much less than those of viable viruses, further assessment regarding its impact on WBE back-estimation should still be useful for understanding the resulting accuracy implications.
4. Sensitivity of WBE Back-Calculation to the Decay of SARS-CoV-2
To quantitatively assess the contribution of SARS-CoV-2 RNA decay under varied temperatures to the WBE back-calculation accuracy, the collected k values of SARS-CoV-2 RNA were input to the proposed sensitivity equation (Equation (6)) and the calculated results were presented in Table 4. The average level of sensitivity to 25% change in k is 0.13 over the three water types at 4–37 °C. Wastewater dilution by freshwater or saltwater in sewers might result in less sensitivity; however, the lack of data for SARS-CoV-2 RNA in saltwater made any solid conclusions hard to reach in the current study. More confidently, higher temperatures could increase SARS-CoV-2 RNA decay in sewerage and, correspondingly, the uncertainty of WBE back-estimation. Increased wastewater temperature in summer or tropical regions from 4 to 37 °C could increase the sensitivity considerably from 0.06 to 0.18, leading to a two-fold larger relative variance in the estimation of COVID-19 cases.
Table 4. Sensitivity ratio of predicted COVID-19 cases (Pinfection) to SARS-CoV-2 RNA decay rate constants under different conditions assuming residence time in sewers as 12 h.
While the case number would possibly be underestimated in hot seasons if not incorporating RNA decay rates in the back-calculation, WBE back-calculation could assess disease prevalence more closely based on wastewater samples with lower temperatures, whether in winter or cold countries, where the importance of considering in-sewer RNA decay is reduced. Since the sensitivity values in Table 4 were calculated with hydraulic retention time fixed as 12 h, the overall sensitivity will be decreased, given a shorter in-sewer travel time, or increased otherwise. Collectively speaking, the in-sewer decay of SARS-CoV-2 RNA could be an influential factor for WBE back-calculation under high environmental temperatures and should be considered for accurate prediction.
5. Comparison of Coronavirus Decay Rates in Wastewater to Norovirus and Other Viruses
To put coronavirus decay rates into a broader context,
Table 5 compared them with other previously investigated viruses (i.e., noroviruses, Zika virus, Dengue virus, yellow fever virus, Ebolavirus, Human Immunodeficiency Virus, hepatitis A virus, adenovirus). This table was based on a previous compilation [
39] with the addition of recent reports. Although SARS-CoV-2 RNA might decay slightly faster at 4–6 °C, its overall decay rate was quite similar to other enveloped single-stranded RNA viruses (Zika, Dengue, and yellow fever virus), and generally ranged from 0 to 0.89 d
−1 at higher temperatures. As for infectivity, the coronavirus also experienced similar decay rates at room temperatures as other enveloped single-stranded RNA viruses (Ebolavirus and Human Immunodeficiency Virus).
Table 5. Decay rate constants k (d−1) of different viruses in wastewater.
It was commonly hypothesized that the lipid-containing envelope that surrounds the coronavirus nucleocapsid made it more susceptible to degradation than nonenveloped enteric viruses (i.e., hepatitis A, adenovirus, and norovirus). The inactivation process for enveloped viruses was observed to be faster than for nonenveloped viruses [
18,
48], since envelope lipids could be more easily destroyed than other viral parts. As an example, the hepatitis A virus had better survivability than the enveloped coronavirus at 4–25 °C (
Table 5). In another instance, the RNA decay rates of a typical nonenveloped enteric waterborne norovirus [
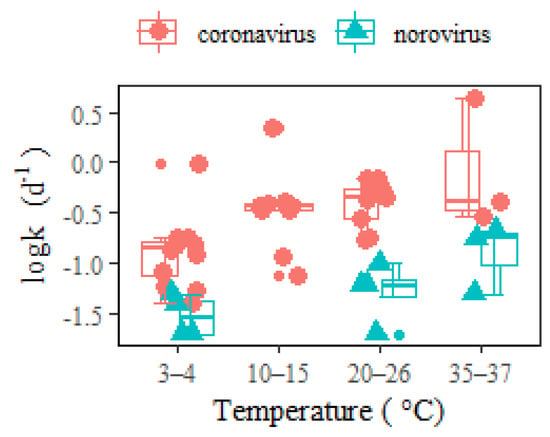
10] were significantly lower than coronavirus in wastewater (
Figure 3). Such a conclusion contrasts with the opinion of Silverman and Boehm [
9], who identified similar persistence between nonenveloped and enveloped viruses in a dark aqueous environment. This discrepancy might be due to the fact that the study combined different water matrices (including wastewaters and natural waters, i.e., fresh, estuarine, and marine waters) together in the comparison. The different water matrices should be considered in view of the significant effect from water types on virus decay (
Table 2).
Figure 3. RNA decay rates of coronavirus and norovirus in wastewater at different temperatures. The middle lines inside the box represent median k values. The top and bottom borders of the box represent the 75%ile and 25%ile of k values, respectively. The top and bottom whiskers represent the upper and lower limit of k values in the groups. In addition, the smaller dots represent the outliers.
As a result of the higher SARS-CoV-2 RNA decay rates than norovirus within temperatures ranging between 3 and 37 °C, the sensitivity to COVID-19 back-estimation via WBE (
Table 4) was greater than that of norovirus [
10], considering both temporal temperature change and wastewater dilution using freshwater. The implications of in-sewer decay should be analyzed in association with specific pathogen species. In addition to the comparison between enveloped and nonenveloped viruses, RNA viruses (i.e., noroviruses, coronaviruses) and DNA viruses (i.e., adenoviruses) should also be differentiated. Furthermore, the difference between viral pathogens and bacterial ones might be even more distinguished [
10].
This entry is adapted from the peer-reviewed paper 10.3390/w15061051


