Cloud-cover information is important for a wide range of scientific studies, such as the studies on water supply, climate change, earth energy budget, etc. In remote sensing, correct detection of clouds plays a crucial role in deriving the physical properties associated with clouds that exert a significant impact on the radiation budget of planet earth. Although the traditional cloud detection methods have generally performed well, these methods were usually developed specifically for particular sensors in a particular region with a particular underlying surface (e.g., land, water, vegetation, and man-made objects). Coastal regions are known to have a variety of underlying surfaces, which represent a major challenge in cloud detection. Therefore, there is an urgent requirement for developing a cloud detection method that could be applied to a variety of sensors, situations, and underlying surfaces. In the present study, a cloud detection method based on spatial and spectral uniformity of clouds was developed. In addition to having a spatially uniform texture, a spectrally approximate value was also present between the blue and green bands of the cloud region. The blue and green channel data appeared more uniform over the cloudy region, i.e., the entropy of the cloudy region was lower than that of the cloud-free region. On the basis of this difference in entropy, it would be possible to categorize the satellite images into cloud region images and cloud-free region images. Furthermore, the performance of the proposed method was validated by applying it to the data from various sensors across the coastal zone of the South China Sea. The experimental results demonstrated that compared to the existing operational algorithms, EN-clustering exhibited higher accuracy and scalability, and also performed robustly regardless of the spatial resolution of the different satellite images. It is concluded that the EN-clustering algorithm proposed in the present study is applicable to different sensors, different underlying surfaces, and different regions, with the support of NDSI and NDBI indices to remove the interference information from snow, ice, and man-made objects.
- cloud detection
- GaoFen-4
- optical image
- coastal zone
1. EN-Processing Results in Coastal Area
The cloud detection results for six GF-4 PMS scenes are presented in Figure 1. A different degree of cloud cover could be observed in the six false-color composite GF-4 images when visually compared with the automatic cloud detection result images. The automatic cloud detection results appeared to work well in cloud identification (white in Figure 1) under the cloud formation conditions of complete, natural, and clear. On the contrary, the information of the cloud-free region (black in Figure 1) was minimized, with even the underlying surface-displayed as dramatically different. Thick cloud, thin cloud, and broken cloud coverage could be detected automatically (Figure 1). In general, there is a huge difference between the underlying surfaces of sea and land, and certain algorithms may fail if the underlying surface is different [1]. However, in the results obtained using the proposed algorithm, the effect of the underlying surface was minimized. A large area of thick clouds could be observed (Figure 1a,c,e,i,k), and the cloud detection results demonstrated that the thick clouds could be detected accurately using the EN-Clustering algorithm. There was also a large area of thin clouds (Figure 1a,g,k), and the cloud detection results indicated that the thin clouds could be detected with accuracy. In addition, numerous small broken clouds could be observed (Figure 1c,g,i,k), and the detection result demonstrated that the automatic cloud detection algorithm was working suitably. Furthermore, the coastal land area (Figure 1e,g,i) also contained different kinds of clouds, which could also be detected with accuracy (Figure 1f,h,j). Overall, the EN-Clustering algorithm worked suitably in the coastal area of the SCS. In addition, the thick clouds, thin clouds, and the tiny broken clouds could be distinguished with accuracy.
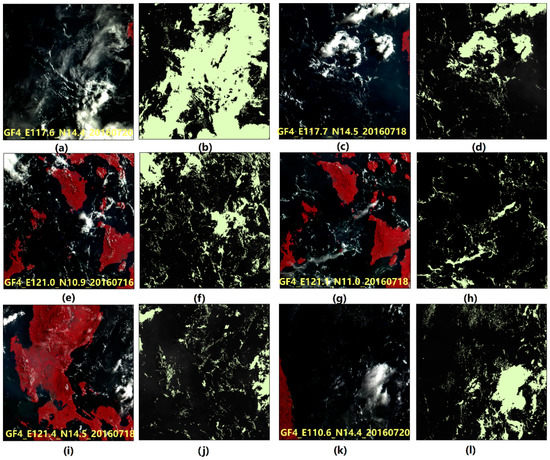
Figure 1. Cloud detection results for GF-4 PMS scenes in the coastal area. False-color composite images with bands 5, 4, and 3, denoting the near-infrared, red, and green bands, respectively, are depicted in (a,c,e,i,k), while their detection results are presented in (b,d,f,h,j,l), respectively. The cloud detection results in black represent the cloud-free region, while the results in white color represent the cloudy region.
2. EN-Processing Results in Land Area
Cloud detection is more difficult in land area compared to the ocean region as the underlying surface in the land area varies. In order to validate the EN-Clustering automatic cloud detection algorithm in the land area, two GF-4 PMS dataset were used, as this area is not far from the coastal zone of the SCS. Figure 2a,c depict the false-color composite images with bands 5, 4, and 3, denoting the near-infrared, red, and green bands, respectively. The underlying surface was varied as these two areas comprised vegetation area as well as an urban area, bare land, farmland, lakes with low levels of suspended matter, lakes with high levels of suspended matter, and the river region. The various underlying surfaces presented a great challenge for the automatic cloud detection algorithm. Mainly, there were thin clouds (Figure 2c), thick clouds, and tiny broken clouds (Figure 2a). The thick clouds and the tiny broken clouds were mostly detected with accuracy. The thick clouds and the broken clouds could be detected conveniently using the EN-Clustering algorithm, as this algorithm could overcome the interference from lakes, man-made objects, rivers, and bare land (Figure 2b,d). Large lakes with high levels of suspended matter usually affect cloud detection results. However, cloud detection result demonstrated that the EN-Clustering algorithm could overcome the effect of lakes with high levels of suspended matter (Figure 2d). In brief, the EN-Clustering algorithm for automatic cloud detection could overcome the interference from rivers, man-made objects, bare land, and lakes with different levels of suspended matter.
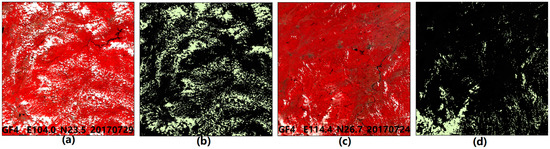
Figure 2. Cloud detection results for GF-4 PMS scenes over the land area. (a) The PMS data of the Yunnan Province region, China and (c) The PMS data of the central China region. (b,d) are the cloud detection results of (a,c), respectively. The white and black colors represent the cloudy region and the cloud-free region, respectively, of (b,d).
3. Unsupervised Segmentation Results in the Coastal Area
As depicted in Figure 3, the GF-4 PMS data-set were covered by all kinds of clouds. The thick cloud detection results obtained using the proposed algorithm at the coastal zone of the SCS matched well with the green lines, indicating that the algorithm performed well (Figure 3a2,b3,c3,e1,e2,f1). The thin clouds, which are difficult to detect, were detected accurately with a precise contour line corresponding to the cloud area (Figure 3a1,a3,b2,d2,f3). The low clouds above the land, which are also difficult to detect, could also be detected efficiently (Figure 3f2). The cloud detection results for small pieces of clouds over the coastal area obtained using the proposed algorithm were acceptable (Figure 3a2,b2,d2,f3). It is known that the underlying surface has a dramatic influence on the cloud detection result, particularly when the underlying surface is distinctly different. As depicted in Figure 3, several areas were located at the intersection of the ocean and the land. The results suggested the proposed algorithm could detect the cloud area with precision, regardless of the underlying surface (Figure 3a1,c1,d1,d2,d3). It was concluded that the thin and thick clouds above the ocean and the coastal area were recognized efficiently, as evidenced by the matching of the green contour line and the cloud area. Moreover, the broken clouds and tiny clouds could also be detected with precision.
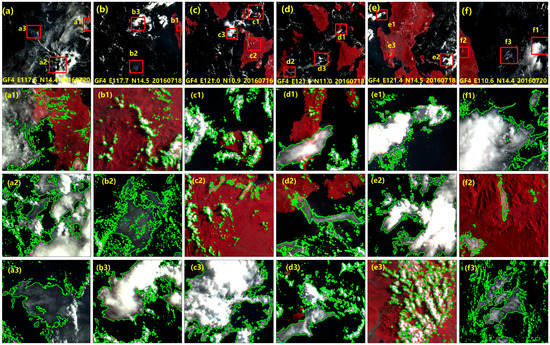
Figure 3. Visual verifications in the case of the coastal area of the SCS for GF-4 data. There are six blocks (a–f) that corresponded to the six data used, as presented in Figure 1a,c,e,g,i,k. The three magnified images (red boxes) below each block provide detailed information of that particular block (a–f), which mainly includes the cloud detection results for thick clouds, thin clouds, broken clouds, and low clouds in the study area.
4. Unsupervised Segmentation Results over the Land Area
As stated above, cloud detection above the land area is more difficult compared to cloud detection above the ocean, as the land area is more varied than the water body. Therefore, cloud detection over the land area was implemented to evaluate further the performance of the proposed automatic cloud detection algorithm. Nearly all the commonly observed land factors such as large lakes, rivers, urban areas, rural areas, bare land, farmland, forest, and cloud area could be viewed from the original GF-4 data (Figure 4a,e). The thin clouds could be detected (Figure 4g), with the green line matching well with the cloud area, nearly without any interference information. The thick cloud detection results were also good (Figure 4c). The clouds around the urban areas were recognized well in general, although there might have been slight interference information from man-made objects (Figure 4h). The results of cloud detection above the forest were also fully detailed (Figure 4c). In this case, the green line matched well with the cloudy region of the original image, indicating that the broken clouds and thick clouds were recognized well using the EN-Clustering algorithm. The results of cloud detection above the interaction zone between the highly-turbid water and the land obtained using the proposed algorithm were fully detailed (Figure 4b). The results of cloud detection over the urban area (Figure 4h), bare land (Figure 4d), farmland, and highly-turbid water are presented in Figure 4. In general, the green lines and the cloud area of the original GF-4 data were well-matched, indicating that the proposed cloud detection algorithm was sufficiently robust.
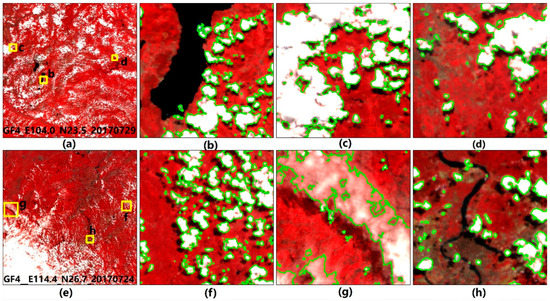
Figure 4. Visual verifications in case of land area for GF-4 data. Two GF-4 PMS images (a,e) were utilized. (b–d) Present the cloud detection results for lakeside, thick cloud and forest, and bare land, respectively, while (f–h) present the cloud detection results for small pieces of cloud, thin cloud, and urban area, respectively.
This entry is adapted from the peer-reviewed paper 10.3390/rs12183003
References
- Zhang, Y.; Guindon, B.; Cihlar, J. An image transform to characterize and compensate for spatial variations in thin cloud contamination of Landsat images. Remote Sens. Environ. 2002, 82, 173–187.