Your browser does not fully support modern features. Please upgrade for a smoother experience.
Please note this is an old version of this entry, which may differ significantly from the current revision.
Subjects:
Chemistry, Organic
Fluorescence imaging technology provides a visual tool for medicine, showing great potential in the fields of molecular biology, cellular immunology and oncology. In recent years, organic fluorescent probes have attracted much attention in the bioanalytical field. Among various organic fluorescent probes, fluorescent organic small molecule probes (FOSMPs) have become a research hotspot due to their excellent physicochemical properties, such as good photostability, high spatial and temporal resolution, as well as excellent biocompatibility. FOSMPs have proved to be suitable for in vivo bioimaging and detection.
- fluorescent organic small molecules
- bioimaging
- detection
- recognition mechanisms
- fluorescent organic nanoparticles
1. Introduction
The key substances inside the human body, including metal ions [1], biological small molecules [2,3], reactive oxygen species [4,5,6] and reactive nitrogen [7,8], are closely related to biological events, regulating physiological functions and metabolism. For instance, metal ions (e.g., Fe3+, Na+, Al3+ and Mg2+) play important regulatory roles in metabolism and osmolality [9,10,11]. Biological small molecules, such as homocysteine (Hcy), cysteine (Cys) and glutathione (GSH) participate in metabolism and redox reactions [12,13,14]. The content of reactive oxygen species and reactive nitrogen reflects many pathological states, especially the development of cancer [15,16,17,18]. Therefore, monitoring the levels of these substances is helpful for understanding human health status.
With the development of in vivo imaging technology, more and more tracer techniques have been applied in biomedical research. Traditional tracing methods are usually required to remove tissues from the body, which cannot realize the real-time dynamic monitoring of the target substances. Currently, the commonly used in vivo tracer techniques include radionuclide imaging, magnetic resonance imaging (MRI), optical imaging and so on [19]. Radionuclide imaging can achieve quantitative and localization analysis of cells, but it has the shortcomings of low spatial resolution and the need of expensive equipment [20,21]. MRI with high spatial and temporal resolution enables monitoring of changes in cellular function, but this technique faces the problem of long imaging time [22]. In vivo luminescence imaging is a non-invasive technology, including bioluminescence imaging (BLI) and fluorescence imaging, mainly used to study gene expression and cell activity. Compared with BLI, the signal of fluorescence imaging is stronger and the detection accuracy is higher [23,24,25]. At present, in vivo fluorescence imaging has become a hotspot in biomedical research due to its advantages of low toxicity, high spatiotemporal resolution and utilization of an inexpensive instrument [26,27,28]. For example, fluorescent dye indocyanine green (ICG) imaging has been used in a variety of abdominal surgery applications, such as lymph node localization, ureteral detection and tumor identification [29]. In recent years, some fluorescent probes with high specificity have also been developed and used for in vivo imaging [30,31,32].
To date, many types of fluorescent probes, such as fluorescent organics [33,34,35,36], fluorescent proteins [37], inorganic nanoparticles [38,39] and semiconductor polymer nanoparticles [40,41] have been developed and widely used in bioimaging. Fluorescent proteins can be generated by cells themselves through genetic engineering, which is convenient for in vivo imaging. However, they are hard to metabolize in the body. Inorganic nanoparticles have good spectral properties and light stability, but the biological toxicity limits their application in bioimaging. Semiconductor polymer nanoparticles have high fluorescence brightness, but slow metabolism causes them to accumulate in the liver. Comparatively, fluorescent organic small molecule probes (FOSMPs) attracted more attention because of their controllable synthesis, stable luminescence, good biocompatibility, sensitive response and high signal-to-noise ratio [42,43]. When applied to imaging, the photochemical properties of FOSMPs are generally more stable than other types of probes. Additionally, small molecules also help to achieve higher fluorophore density and spatial resolution. Therefore, a large number of FOSMPs have been designed and applied to detect substances in various matrix [44,45,46,47,48,49,50,51]. Fluorescent organic nanoparticles (FONPs), which were designed with FOSMPs as fluorophores, show the ability to build a multifunctional biosensing platform through surface functionalization and drug encapsulation [52]. A summary of the progress on the applications of FOSMPs in bioimaging and detection is of significance for the development of new diagnostic tools. As far as we know, there are no special reviews focusing on this field.
2. FOSMPs for Bioimaging and Detection
Fluorescence is the phenomenon that electrons return from the first singlet state to the ground state with concomitant energy release in the form of light. The characteristics of the fluorescent probes such as excitation and emission wavelength, intensity, lifetime and polarization are easily influenced by the environment conditions, thereby providing sensitive signals for the tracking and monitoring of analytes [53,54,55,56,57,58]. The structure of FOSMPs is mainly composed of three parts: the recognition group, the fluorophore, and the linking group (linker) (Figure 1). The recognition group endows the fluorescent probe with detection selectivity. The fluorophore provides the signal response when the probe recognizes the target. The linker connects the recognition group and the fluorophore and is not necessary for the fluorescent probe.
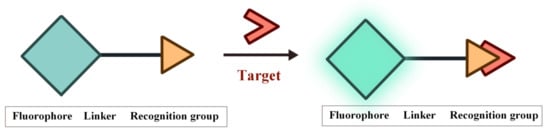
Figure 1. The structure of FOSMPs and its recognition of the target.
As shown in Figure 2, according to the interaction manner between FOSMPs and targets, the recognition mechanisms can be divided into five types: photo-induced electron transfer (PET), intramolecular charge transfer (ICT), fluorescence resonance energy transfer (FRET), excited state intramolecular proton transfer (ESIPT) and aggregation-induced emission (AIE). Based on these recognition mechanisms, various FOSMPs for bioimaging and detection have been developed, as listed in Table 1. In the following, the applications of FOSMPs in bioimaging and analysis based on these recognition mechanisms are reviewed.
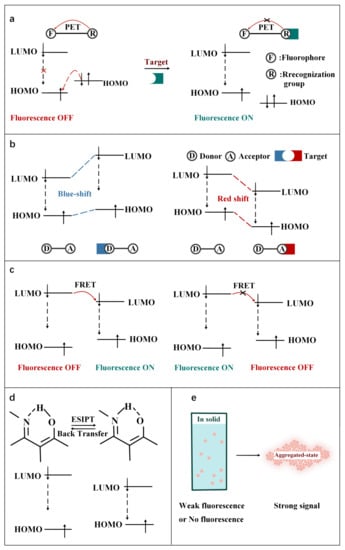
Figure 2. Schematic illustration of the principles of (a) PET, (b) ICT, (c) FRET, (d) ESIPT and (e) AIE.
Table 1. Fluorescence characteristic, recognition mechanisms, and applications of FOSMPs.
| Probe | λex/λem (nm) | Mechanism | Analyte | Solvent System | Linear Detection Range | Limit of Detection (LOD) | Target | Ref. |
|---|---|---|---|---|---|---|---|---|
| Probe | 500/525 | PET | Cys | CH3CN-Water-HEPES buffer | 0–100 μM | 3.7 × 10⁻² μM | A375 cells | [59] |
| NP-S | 455/551 | PET | H2S | PBS buffer-EtOH | 30–300 μM | 0.376 μM | Mouse liver slices | [60] |
| Tyro1, Tyro2 | 455/560 | PET | Tyrosinase | Potassium phosphate buffer | - | - | B16F10 cells | [61] |
| NFP-G, NFP-A | 440/541 | PET | Formaldehyde (FA) | DMSO-PBS buffer | 0–30 μM, 0–15 μM | 1.2 μM, 0.18 μM | HepG-2 cells | [62] |
| Naphthalimide chromophore | 400/502 | ICT | CN− | HEPES buffer -CH3OH | 0–15 μM | 0.066 μM | HepG2 cells | [63] |
| DCM-β-gal | 535/685 | ICT | β-galactosidase (β-gal) | PBS buffer-DMSO | 0–12 U/L | 0.17 U/L | 293T cells | [64] |
| DCDHF-Glu | 510/613 | ICT | γ-Glutamyltranspeptidase (GGT) | PBS buffer | 0–40 U/L | 0.0379 U/L | HepG2 cells, LO2 cells | [65] |
| SHC | 370/540 | ICT | hNQO1 | PBS buffer | 0–0.8 μM | 0.0146 μM | HT-29 cells, MDA-MB-468 cells | [66] |
| AI | 370/495 | ICT | Hypochlorous acid (HOCl) |
DMSO-PBS buffer | 0–50 μM | 0.84 μM | HeLa cells, Nude mice | [67] |
| P-ONOO− | 365/480 | ICT | ONOO− | DMSO-PBS buffer | 0.429–3.0 µM | 0.0104 µM | HeLa cells | [68] |
| SR400, SR550 | 400/525, 550/675 | FRET | H2S | PBS buffer | - | - | HEK293 cells | [69] |
| CF | 415/517 | FRET | HNO | PBS buffer | 0–100 μM | 1.4 μM | HeLa cells | [70] |
| FIP-1 | 515/556 | FRET | Fe(II) | HEPES buffer | - | - | HEK293 cells, MDAMB-231 cells | [71] |
| PNCy3Cy5 | 530/660 | FRET | OONO– | Phosphate buffer-DMF | 0–0.7 μM | 6.5 × 10⁻⁴ μM | RAW264.7 | [72] |
| FTR-βgal | 450/540 | FRET | β-gal | PBS buffer-EtOH | 0–5 U/L | 4.11 × 10⁻⁸ U/L | Hek293 cells | [73] |
| PPA | 400/511 | ESIPT | Palladium | CH3CN-PBS buffer | 0–180 μM | 0.028 μM | A549 cells | [74] |
| Py-GSH | 488/545 | ESIPT | GGT | PBS buffer | 1–30 U/L | 1 × 10⁻² U/L | SKOV3 cells, HOSEpiC cells, Tumor-bearing mice, Human specimens |
[75] |
| NIR-TS | 550/836 | ESIPT | SO2 | Water | 0.5–40 μM | 0.067 μM | HeLa cells, Mice | [76] |
| TPE-Gal | 344/512 | AIE | β-gal | PBS buffer | 8 × 10⁻⁴–4.8 × 10⁻³ U/L | 3.3 × 10⁻⁴ U/L | HeLa cells, OVCAR-3 cells | [77] |
| TT | 320/440–550 | AIE | H2O2 | DMSO-Water | - | - | RAW264.7 cells, HLF cells | [78] |
| QP-DNP | 482/582 | AIE | Hydrazine | DMSO-HEPES buffer | 0–0.8 μM | 0.055 μM | HeLa cells, Kunming mouse | [79] |
| AIE-Lyso-1 | 356/532 | AIE/ESIPT | Esterase | DMSO–Water | 100–500 U/L | 2.4 U/L | MCF-7 cells | [80] |
| Probe 1 | 314/446 | PET/ICT | Cys | PBS buffer | 0.2–2.0 μM | 1.4 × 10⁻³ μM | HeLa cells | [81] |
| NCQ | 423/490, 544 423/490423/490, 624 |
Triple-emission | Cys/Hcy, GSH/H2S, thiopheno(PhSH) |
PBS buffer-acetonitrile | 0–10 μM/10 μM, 0–6 μM/8 μM, 0–70 μM |
0.57 μM/0.65 μM, 0.49 μM/0.52 μM, 0.34 μM |
HeLa cells | [82] |
3. FOSMPs-Based FONPs for Bioimaging and Detection
Compared with FOSMPs, FONPs have larger surface area, better biodegradability and greater resistance to photobleaching [106,107]. FONPs-based multifunctional biodetection platforms can be constructed through drug encapsulation and surface modification of targeting groups. This section briefly describes the preparation and applications of FOSMPs-based FONPs in bioimaging and detection.
Zhang et al. [108] reported a strategy to prepare FONPs by encapsulating the fluorophore C18-R in synthetic copolymer matrices. First, the copolymer aqueous solution was added to the C18-Rd THF solution under sonication. In the process of removing THF, the hydrophobic segment of the copolymer wrapped C18-R through hydrophobic interaction to form a “core-shell” structure, and finally the C18-R-PEG FONPs were obtained. CLSM images and cell uptake experiments proved that the C18-R-PEG FONPs has good biocompatibility and can be used for bioimaging.
Enhanced fluorescence emission can be obtained by loading high concentrations of fluorophores into FONPs since AIE can occur at high concentrations of fluorophores. Zhang et al. [109] prepared near-infrared emitting AIE dots with a particle size of ~20 nm and a fluorescence quantum efficiency of 20% by using the amphiphilic polymer poly (styrene co maleic anhydride) (PSMA) as the co-encapsulation matrix and a novel small-molecule fluorophore (2Z,2′Z)-3,3′-(2,5-di(piperidin-1-yl)-1,4-phenylene)bis(2-phenylacrylonitrile) (DPPBPA) as the core. The final product SA dots were obtained by modifying streptavidin on its surface to achieve specific binding to target cells. SA dots have been successfully used for fluorescence imaging of MCF-7 cell line benefit from their uniform size, stable luminescence and excellent biocompatibility.
1,2-distearoyl-sn-glycero-3-phosphoethanolamine-N-(polyethylene glycol) (DSPE-PEG2000) is a typical package matrix that is widely used in the design of FONPs due to its good biocompatibility [110,111,112,113]. Transcription-AIE (Tat-AIE) dots prepared using DSPE-PEG2000 as the matrix was first reported as cell-tracing probes in 2013, showing brighter fluorescence, better fluorescence stability and cell-tracking ability than commercial quantum dot-based probes. In this work, Li et al. [111] encapsulated the fluorophore TPETPAFN by using a mixture of DSPE-PEG2000 and DSPE-PEG2000-NH2. Then, Tat-AIE dots were obtained by coupling AIE dots with cell penetrating peptide HIV-1 Tat. TPETPAFN has poor water solubility but is easily soluble in THF solution. The fluorescence of TPETPAFN was turned on when the THF/water volume ratio was 1:1 and the fluorescence intensity increased exponentially with the increase of the ratio of water. The fluorescence intensity of TPETPAFN showed a 70-fold enhancement at a 90% water volume fraction. The hydrodynamic size and quantum yield of the as-prepared NIR-emitting Tat-AIE dots were ~30 nm and 24%, respectively. Compared to commercial Qtracker® 655, Tat-AIE dots displayed 10-fold stronger fluorescence intensity and better long-term tracing ability. Tat-AIE dots could trace MCF-7 cells for 10–12 generations and trace C6 cells for 21 days in vivo.
This entry is adapted from the peer-reviewed paper 10.3390/molecules27238421
This entry is offline, you can click here to edit this entry!