谷物质量涉及谷物的外观、营养和安全属性。随着人民生活水平的提高,粮食质量问题越来越受到重视。现代质量检测技术具有检测谷物质量的快速性、无损性、准确性和效率等独特优势。本文综述了这些技术在籽粒品质指标检测方面的研究进展。特别是,综述侧重于基于物理特性的检测技术,包括声学、光学、热学、电气和机械特性,以及模拟感官分析的技术,如电子鼻、电子舌和电子眼。根据当前的技术发展和应用,展示了这些技术的挑战和前景。
- appearance attributes
- nutritional attributes
- safety attributes
- non-destructive detection
- physical properties
- sensory properties
- cereal grains
1. Introduction
Grain quality is an important index in the grain circulation process involving the production, storage, trading, and processing. Grain quality detection has always been one of the greatest challenges pertaining to the treatment, processing, classification, and safety guarantees needed in the food industry. Traditionally, grain quality detection is realized through sensory and chemical analyses. However, sensory analysis is time-consuming, inefficient, highly subjective, and susceptible to external interference (influences of physical conditions such as fatigue); chemical analysis is expensive, time-consuming, laborious, and destructive, and requires a laboratory. In recent years, to meet the requirements of modern quality inspection, detection techniques based on physical properties such as acoustic, optical, thermal, electrical, and mechanical properties and sensory features including visual, gustatory, and olfactory features have been developed apace. A bibliometric analysis was used in this paper. References on the state of the art in non-destructive quality-detection techniques for cereal grains were searched through the Web of Science search engine as well as the National Standards Full Text Open System and the websites of International Organization for Standardization to obtain relevant quality standards for cereal grains. The standards are to look up by keywords such as cereal, grain, wheat, rice, pulses, maize, toxin, pesticide, and residue on the system and website. The references of the state of the art were obtained within the last five years in the core collection database of the Web of Science search engine. We searched the references by combining the keywords cereal, grain, and quality with the technical words of physical properties such as near-infrared spectroscopy (NIRS), hyperspectral imaging (HSI), Raman spectroscopy (RS), optical, dielectric, nuclear magnetic resonance (NMR), X-ray, electromagnetic, acoustic, thermal, and mechanical, and sensory features such as electronic eye (E-eye), computer vision, electronic nose (E-nose), electronic tongue (E-tongue), and sensory, respectively. We classified all the references according to the quality as the first condition and the techniques as the second condition, and summarized and analyzed the research purposes, research contents, research methods and research results of each reference. The previous references have focused on the applications of a particular detection method to different objects, or some detection methods for selected objects. In this study, we analyzed and summarized the advantages and disadvantages of the methods of physical properties and sensory features in terms of appearance, nutritional and safety attributes of cereal grains, and explored the techniques that can detect various quality indicators in different application scenarios. Based on the latest technical references we have collected, we have mapped the latest research progress of research institutes [30–52] (Figure 1) and commercial instruments [53–86] (Figure 2).
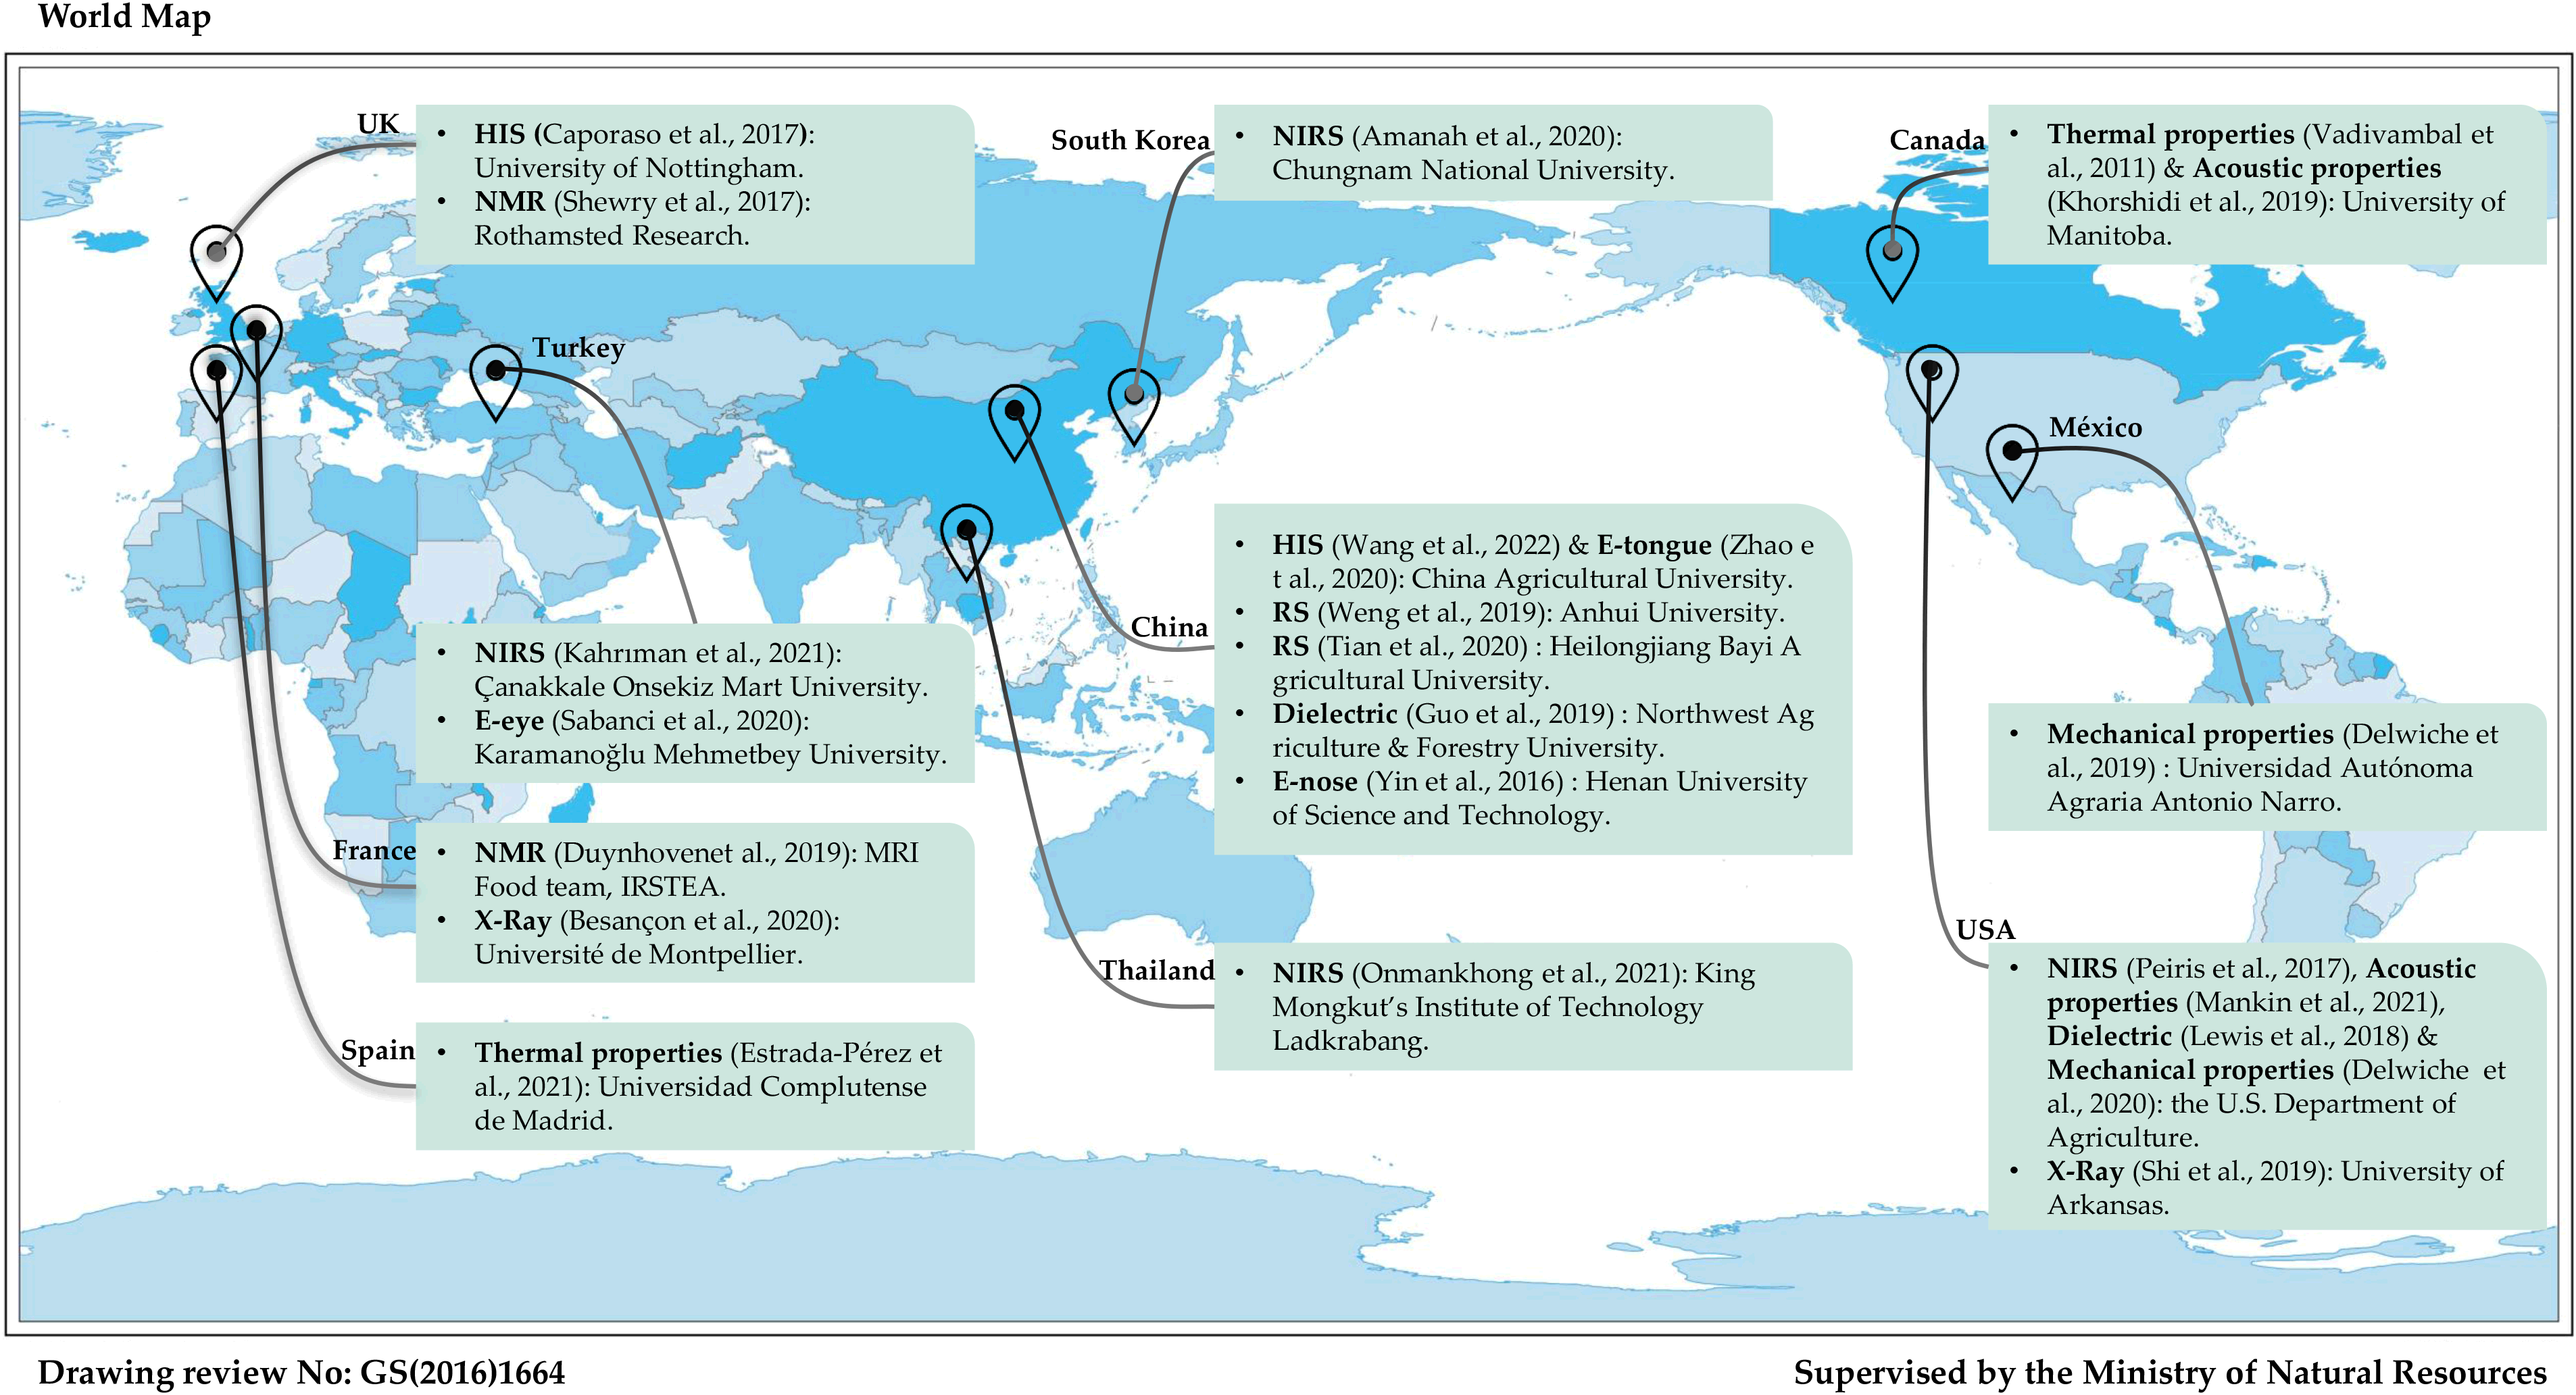
Figure 1. The research progress of research institutions on grain quality detection techniques [30–52].
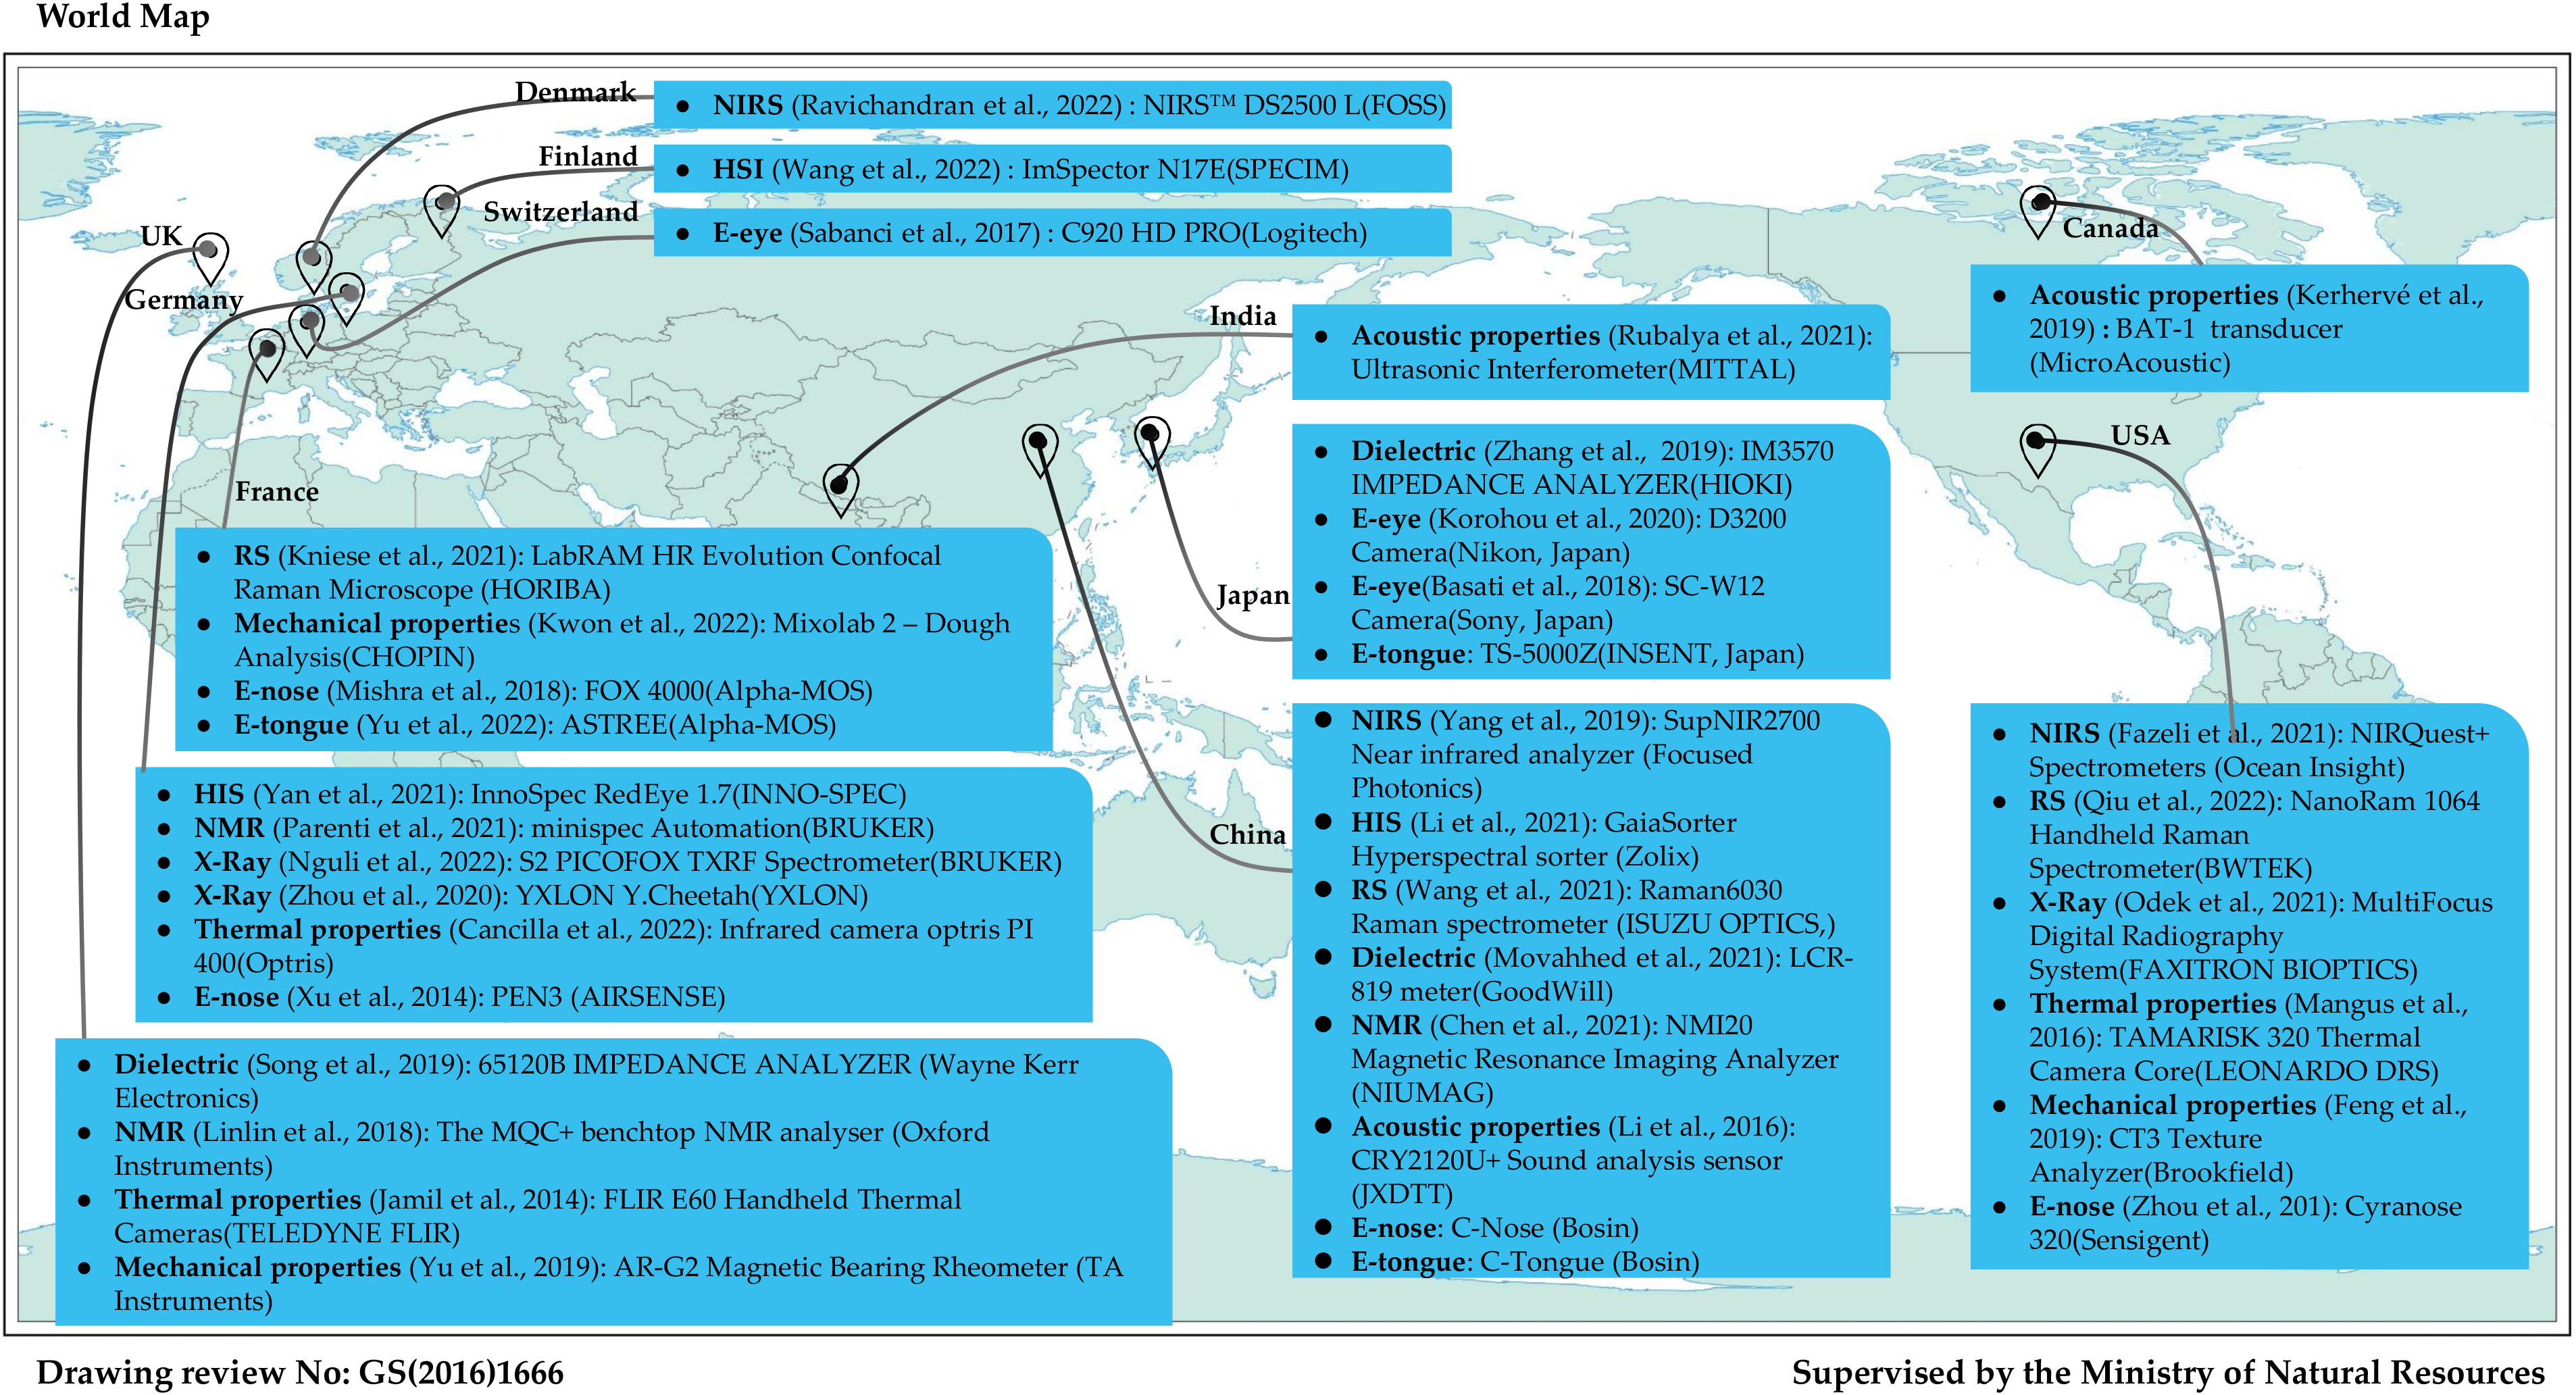
Figure 2. Commercial instruments for grain quality detection [53–86].
|
Detection methods |
Principles |
Objects |
Limitation |
||
|---|---|---|---|---|---|
|
Physical properties |
Optical properties |
NIRS |
Realizing quantitative quality detection and qualitative analysis according to differences in the absorption band and intensity of hydric groups in organic components of grains in the near-infrared region |
Nutritional attributes including proteins, starches, and fats, and safety attributes pertaining to pesticide residues and fungal toxins |
High precision instruments are expensive and the NIR spectra of different components overlap. |
|
HSI |
Realizing accurate detection of grain quality based on hyperspectral and image data |
Nutritional attributes including proteins, safety attributes pertaining to pesticide residues and fungal toxins, and appearance attributes including color and shape |
HSI is costly, the amount of hyperspectral data is extremely large, and it is difficult to store and analyze. |
||
|
RS |
Based on scattering spectra of different components in grains at different light frequencies; achieving quality detection by analyzing molecular vibration and rotation of these components in grains |
Nutritional attributes including proteins, and safety attributes pertaining to fungal toxins, pesticide residues, and heavy metals |
Fluorescence phenomena on Fourier variation Raman spectral interference, optical systems affecting different vibrational peak overlaps, and Raman scattering intensity. |
||
|
Electromagnetic properties |
Dielectric |
According to the response characteristics of grains in the applied electric field |
Moisture content |
High correlation mainly with moisture. |
|
|
NMR |
Atomic nuclei with fixed magnetic moments in grains produce a string of response signals with attenuated intensity in the specific impulse trains. |
Moisture content and nutritional attributes including starches and fats |
Mainly used for moisture state, migration process analysis, high price, complex signal analysis, and imperfect NMR spectrum database. |
||
|
X-ray |
Elements in grains release X-ray fluorescence of specific energy under X-ray irradiation |
Nutritional attributes including trace elements, and safety attributes pertaining to heavy metals |
X-ray control is complicated and dangerous. |
||
|
Acoustic properties |
According to the reflection, scattering, projection, and absorption characteristics of acoustic waves in grains |
Nutritional attributes including proteins, and appearance attributes such as unsound kernels |
High environmental noise interference. |
||
|
Thermal properties |
According to differences in thermal radiation of various parts of grains |
Appearance attributes such as fungal infection and unsound kernels |
High ambient temperature disturbance. |
||
|
Mechanical properties |
According to the mechanical features of grains under all types of mechanical load |
Nutritional attributes including proteins and starches |
The association between mechanical properties and quality is unclear. |
||
|
Sensory features |
E-eye |
According to features including color and shape in images |
Multiple appearance attributes |
High requirements for clarity of acquired images, difficulty to identify early mold and pest images, and difficulty to segment multi-seed images. |
|
|
E-nose |
According to gaseous response signals of volatile organic compounds in grains |
Safety attributes pertaining to fungal toxins and pesticide residues |
Early mold or mild pesticide residues produce low gas concentrations that are difficult to detect and environmental gas interference. |
||
|
E-tongue |
According to taste response signals of grain leachates |
Nutritional attributes including proteins and starches, and safety attributes pertaining to heavy metals |
The detection object is the leachate of seed samples |
||
The organizational structure of this paper is shown in Figure 3. The article consists of four parts as follows:
(1) Introduction. The introduction of the classification and definition of grain quality (which can be classified as appearance, nutritional, and safety attributes), and the analysis of grain quality detection techniques based on physical properties and sensory features.
(2) Research progress. The current status of the study is divided into three subsections: appearance, nutritional and safety attributes. ① Research progress on detection of appearance attributes of grains based on HSI, X-ray, NMR, thermal properties, acoustic properties, and E-eye. ② Research progress on detection of nutritional attributes of grains based on NIRS, HSI, RS, NMR, X-ray, acoustic properties, mechanical properties, and the E-tongue. ③ Research progress on detection of safety attributes of grains based on NIRS, HSI, RS, X-ray, and the E-nose.
(3) Unsolved technical problems. The problems of high cost, environmental interference, detection principle, limit of detection (LOD), moisture detection, grading and classification of grains and practical application issues in detection applications.
(4) Future research direction. The summary about future research direction, and the methods and attempts to solve the above problems found in some references.
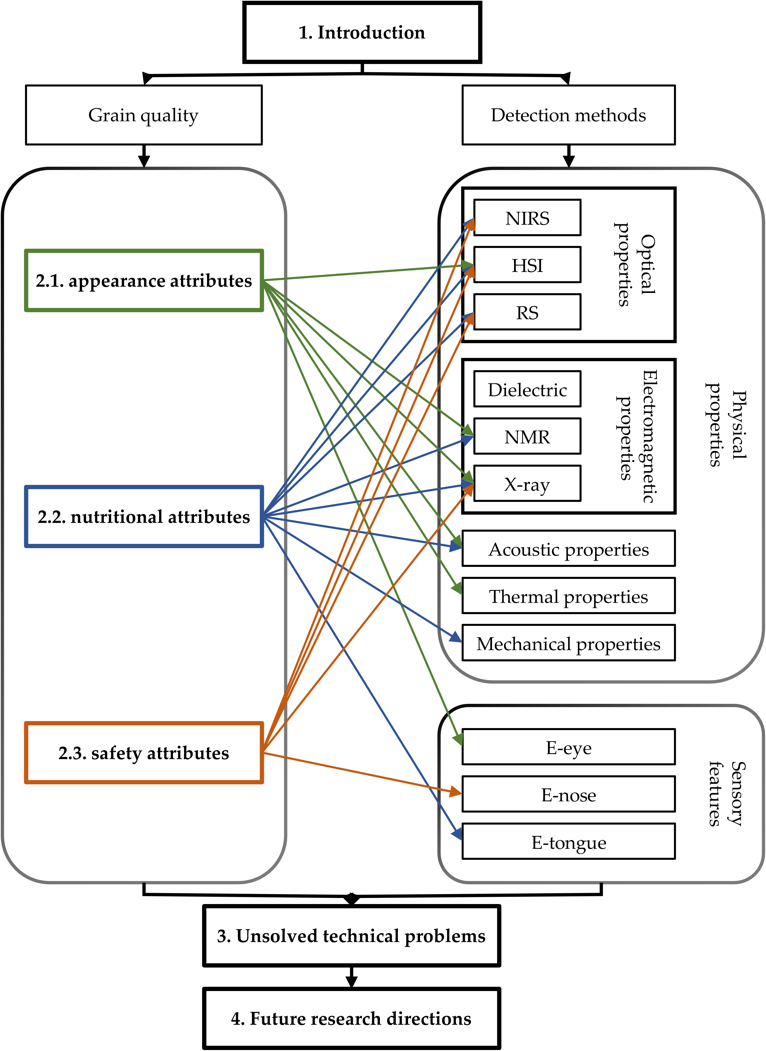
Figure 3. Block diagram of the article organization.
2. Overseas and Domestic Research Status
2.1. Non-Destructive Quality Detection Methods for Appearance Attributes of Cereal Grains
|
Detection Methods |
Objects |
Devices |
References |
|---|---|---|---|
|
HSI |
Color and shape, unsound kernels, and impurities |
Zolix “GaiaSorter” hyperspectral imaging system |
|
|
NMR |
Unsound kernels |
NMI20 bench top pulsed NMR analyzer |
[102] |
|
X-ray |
Unsound kernels |
Skyscan 1272 X-ray micro-CT scanner |
[48] |
|
Acoustic properties |
Unsound kernels |
Self-made impulse signal acquisition device |
[103] |
|
Thermal properties |
Unsound kernels |
MLG-II temperature sensor |
[104] |
|
E-eye |
Color and shape, unsound kernels, and impurities |
CCD camera or smartphone |
HSI, which combines spectral and image information, can more accurately detect the quality information of grains. Li et al. [99] collected the hyperspectral images of wheat grains in four states (healthy, germinated, mildewed, and shriveled) across the range of wavelengths from 866.4 to 1701.0 nm. By using the data enhancement method based on the deep convolutional generative adversarial network, the spectral data are generated, and sample classes are expanded to improve the performance of the classifier. The classification accuracy of the CNN model is increased from 17.50% before expansion to 96.67%. Zhang et al. [100] obtained hyperspectral data from single wheat grains in the reverse and ventral sides at 866.4 to 1701.0 nm and used the principal component loading method to extract characteristic wavelengths. In this way, the SVM model is established for discriminating four types of wheat grains (healthy, germinated, mildewed, and shriveled), and the classification accuracies for the four types of wheat grains all exceed 96%. By collecting the spectra of healthy and Fusarium-infected wheat grains at 350 to 2500 nm, Zhang et al. [101] found that the classification accuracy of the spectral classification index method is 0.97.
In NMR detection, the NMR signals of grains and foreign matters therein show significant differences. Shao et al. [102] measured the NMR spectra of wheat grains, Sitophilus zeamais, and their mixture. By analyzing NMR spectra through a combination of biexponential analysis and a discrete method, a series of NMR parameters were obtained, which could be used as diagnostic indices for the number and stage of insect pests in wheat grains. The partial least squares (PLS) results based on NMR relaxation parameters (T21, T22, P21, P22, and A21/22) indicate that the measurement and prediction of insect pests exhibit good correlation (R > 0.960).
X-rays can penetrate deeply into a grain and therefore can be used to detect internal structural features thereof. Boniecki et al. [107] observed internal structural damage caused by the granary weevils through digital X-ray images of wheat seeds and developed an artificial neural network model with a three-layer perceptron capable of correctly detecting 100% of infected seeds and 98.4% of healthy seeds. Besançon et al. [48] differentiated between two wheat grain samples based on computerized tomography (CT) data with a resolution of 7 um according to endosperm porosity. They plotted the cumulative distribution curves of pore volume and pore size and analyzed different types of pores to describe endosperm structures. Scanning electron microscopy (SEM) and CT images with the resolution of 1 um can be employed to describe the microstructures of endosperm of durum wheat grains and quantitatively investigate proportions of vitreous endosperm and farinaceous endosperm. Jha and Tripathy [108] used a high-resolution X-ray micro-CT scanner to collect the images of paddy and wheat grains, and the pore sizes of paddy and wheat samples in the CT images are in the range of 0.01 to 0.8 mm3. Their analysis implies that hybrid solar drying causes compaction of paddy surfaces, cell disruption, and agglomeration of wheat endosperm. By using an X-ray micro-CT system to conduct lossless scanning of whole maize grains, Shao et al. [109] reconstructed the 3D model of the internal structure of maize grains via pseudo-color visualization. The results show that plump maize grains have fewer internal fissures than non-plump grains. Shi et al. [35] developed a fissure detection and measurement algorithm for rough rice kernels based on X-ray images. The algorithm segments individual rice kernels in the X-ray images using the gap-filling method and detects fissures in each rice kernel through adaptive thresholding and the use of a slew of filters. The deviation for the percentage of fissured kernels is less than 2%. Through X-ray scanning and reconstruction, Sun and Xiao [110] conducted visualized analysis on the internal structure of rice at micron resolution. They also determined the volume, shape, and location information of rice chalkiness through 3D reconstruction and volume-based quantification. Zhou et al. [111] scanned wheat grains through micron-resolution X-ray CT and discriminated wheat grains that are infected with mold or not by comparing their grey values in different states. The 3D visualized characterization of the internal structure and pores of the wheat grains was realized according to the difference in attenuation of X-rays, and parameters such as the wheat grain volume, pore volume, and porosity were calculated.
Unsound kernels show different reflection, scattering, projection, and absorption features for acoustic waves. Guo et al. [103] proposed an impact sound signal processing technology based on Gaussian modelling and improved extreme learning machine to detect injured wheat grains. The results indicate that the classification accuracies of the method for uninjured wheat grains and those injured by insect pests and sprouting are 92.0%, 96.0%, and 95.0%, respectively.
Grain and foreign matter therein including insect pests exhibit significant differences in the thermal radiation features. Based on thermal features, the appearance attributes of unsound kernels can be detected. Wang et al. [104] plotted temperature changes on the longitudinal and transverse profiles of bulk maize using cloud images. At different time moments, the areas of six sections and volumes of zones at a temperature above 25 °C were calculated. In addition, the relationship of the area and volume with the temperature difference was revealed. The results show that a large high-temperature zone is formed rapidly at the center of the maize under microbial action. The heat exchange distance in the longitudinal and transverse directions is a function of the temperature difference, and the two have a linear relationship during development of the high-temperature zone. The volume of the high-temperature zone is a cubic polynomial function.
E-eyes, as a non-conventional term, are an image analysis technique in computer vision. An E-eye comprises an image sensor and a pattern recognition system. The image sensor collects image data and the pattern recognition system recognizes and analyzes features such as color and shape in images [96,112,113]. Lingwal et al. [105] used a convolutional neural network (CNN) to classify 15,000 images of 15 wheat varieties based on visual traits. A classification model for wheat varieties under adjustment of different hyper-parameters was established, which indicated a training accuracy and test accuracy of 94.88% and 97.53%, respectively. Basati et al. [81] extracted nine color features, ten shape features, and six statistical features relating to healthy and moth-eaten wheat grains with different moisture contents. Therein, 11 features were selected as the input to artificial neural network (ANN), decision tree, and discriminant analysis classifiers. The results show that the classification accuracy of the J.48 algorithm based on the decision tree is the highest (90.20%), followed by the ANN with an 11-19-2 topology and the discriminant analysis classifier, the classification accuracies of which are separately 87.46% and 81.81%. Based on a multi-class support vector machine (SVM) classifier, Vithu et al. [106] developed a recognition model for the documented type of paddy. The model considers five morphological features and nine color features in paddy images, based on which the overall classification accuracy reaches 90.3%. The average classification accuracies of the model for paddy, organic impurities, inorganic impurities, other paddy varieties, and black rice are 85%, 83.2%, 93%, 98%, and 93.6%, respectively. By analyzing features including the color and shape in grain images, E-eyes can realize the qualitative classification of grain varieties and detection of pests and diseases. Grain investigation methods based on E-eyes are easy and convenient to use and have been extensively applied in quality-detection on grain varieties.
HSI can realize high-accuracy detection of appearance indices by combining image and spectral information. NMR achieves high-accurate detection based on characteristic response signals of insect pests. X-ray technology is used to detect and estimate changes in internal structures of grains and analyze the formation of appearance attributes. The unsound kernels can be detected and discriminated based on differences of normal and unsound kernels in acoustic and thermal features. E-eyes can detect all appearance indices including color and shape, impurities, and unsound kernels of grains.
2.2. Non-Destructive Quality Detection Methods for Nutritional Attributes of Cereal Grains
|
Detection Methods |
Objects |
Devices |
References |
|---|---|---|---|
|
NIRS |
Proteins, starches, and amino acids |
Unity SpectraStar 2500XL-spectrometer |
|
|
HSI |
Proteins, oleic acids, and starches |
OCI-UAV-1000 hyper-spectrometer |
|
|
RS |
Proteins, starches, amino acids, and oils |
Renishaw Raman spectrometer |
|
|
NMR |
Oils |
Minispec mq20 NMR spectrometer |
[123] |
|
X-ray |
Trace elements |
Hard X-ray microprobe |
|
|
Acoustic properties |
Proteins and ashes |
Physical property analyzer |
[36] |
|
Mechanical properties |
Proteins and starches |
CT3 physical property analyzer |
|
|
E-tongues |
Starches and proteins |
Self-made three-electrode E-tongue |
[126] |
Grains show different spectral response characteristics in the near-infrared region when containing different contents of nutritional ingredients, so the nutritional attributes can be quantified based on spectral features. Shi et al. [114] collected NIR spectra of 48 wheat samples at 680 to 2500 nm and established the optimal NIR model between 1400 and 2500 nm using mean-centered partial least square regression (PLSR). The R2 of crude proteins is predicted to be 0.98. Amanah et al. [115] determined diffuse reflectance spectra of 310 soybean samples in the waveband ranging from 1000 to 2500 nm and studied characteristic absorption bands of different nutritional ingredients of soybeans. In addition, they also built the PLS multi-variate analysis model for isoflavones and oligosaccharides in soybeans, and the predicted R2 scores of the model for isoflavones and oligosaccharides are separately 0.80 and 0.72. Nutritional ingredients also differ in different varieties of grains in a same type, so the different varieties can be discriminated according to differences in nutritional attributes. Through principal component analysis (PCA), Wadood et al. [127] screened the spectral variables at 950 to 1650 nm and established a classification model for linear discriminant analysis (LDA). The model shows the highest classification accuracies of 100% and 73% separately for the origin and production year of wheat, and the highest classification accuracy of 98.2% for the genotypes of wheat grains. Fan et al. [128] coupled machine learning methodologies with a spectral dimensionality reduction algorithm to establish an assessment model for seed vigor, the accuracy of which exceeds 84.0%. Based on PCA, Basati et al. [129] classified healthy and unhealthy wheat kernels at the accuracy of 100%, and the two types of wheat kernels are more effectively discriminated at wavelengths of 839 nm, 918 nm, and 995 nm. Zhang et al. [130] eliminated interference wavelengths successively using the equidistant combination-partial least squares and wavelength step-by-step phase-out PLS. On this basis, the constructed novel purity analysis model of rice seeds shows a predicted correlation coefficient of 0.920. Schütz et al. [131] established a global classification model for the geographical origin of grain maize by adopting the SVM classification technique, which achieved an overall classification accuracy of 95%. Qiu et al. [132] differentiated viable and unviable maize seeds based on spectral data within the waveband ranging from 1000 to 2500 nm and the established partial least square-discriminant analysis (PLS-DA) classification model shows the classification accuracy of 98.0%. By using the random forest algorithm, Wang et al. [133] screened spectra of soybeans in the range of 5793 to 12,489 cm−1 and selected important variables to establish the classification model, which achieved an 80% classification accuracy of soybeans. Kusumaningrum et al. [134] used the variable importance in projection method to screen 146 optimal wavelengths from 1000 to 2500 nm and built the soybean seed viability prediction model combining PLS-DA. The model shows the prediction accuracy approaching 100% for viable and unviable soybean seeds.
HSI acquires spectral information when collecting image information, so it can be used to detect the nutritional attributes of grains. HSI allows segmentation of hyperspectral data from single grain kernels and also can segment hyperspectral data of different parts of single grain kernels, so it exhibits unique advantages in quality analysis of single grain kernels. Caporaso et al. [31] collected hyperspectral images of individual wheat kernels from 980 to 2500 nm and the R2 scores for the calibration and validation sets of the established detection model for the protein content based on PLSR analysis are separately 0.82 and 0.79. Fu et al. [116] selected 23 characteristic wavelengths of oleic acids and 21 characteristic wavelengths of linoleic acids in hyperspectral images of soybean kernels in the range from 600 to 1000 nm. On this basis, they established the PLS-DA classification model of different oil contents, which shows the classification accuracies separately of 98.6% and 86.7% for the calibration and validation of oleic acids. Liu et al. [117] sampled hyperspectral images above and below the embryos of individual maize kernels in the range from 930 to 2500 nm and used the competitive adaptive reweighted sampling (CARS) method to select characteristic wavelengths. They established the PLSR and non-linear statistical data model using the ANN algorithm and its predicted R-value for maize starch content is 0.96. Weng et al. [135] collected hyperspectral images from 10 high-quality paddy varieties in China at 400 to 1000 nm. The classification model for paddy varieties based on PCA networks using spectral and morphological features exhibits classification accuracies separately of 98.66% and 98.57% in the training and prediction sets. Guo et al. [136] obtained hyperspectral images of the mixture of rice produced in Wuchang City and Jiangxi Province, China from 380 to 1000 nm and the established full-wavelength SG1-PLSR model shows a predicted R-value of 0.9909. The R-value of the simplified PLSR model established based on 15 important wavelengths selected according to the weighted regression coefficient is 0.9769. Miao et al. [137] imaged 800 maize kernels in eight varieties in the range from 386.7 to 1016.7 nm, and the t-distributed stochastic neighbor embedding (t-SNE) model pre-processed via PCA exhibits the highest classification accuracy of 97.5%, which is far higher than other models (75% for PCA, 85% for kernel principal component analysis, and 76.25% for local linear embedding). Li et al. [54] collected 3600 hyperspectral images of soybeans in the range from 866.4 to 1701.0 nm and established the one-dimensional CNN model of soybeans. The classification accuracies of the model for four soybean varieties (Zhonghuang 13, 37, 39, and 57) exceeded 98%.
The molecular vibration and rotation information can be obtained based on Raman spectra of nutritional ingredients in grains at different frequencies of incident light, thus realizing the quantitative detection and qualitative analysis of the quality [138,139]. RS can be used for qualitative analysis such as the varietal classification of grains including wheat, paddy, and maize. Liu et al. [118] collected Raman spectra of eight wheat varieties with waxy proteins from 700 to 2000 cm−1, measured spectra in several specific regions, and established the discriminant analysis (DA) classification model. The accuracies of the model in the calibration and validation sets are 94.4% and 94.6%, respectively. Zhu et al. [119] acquired Raman spectra of 107 paddy varieties in China from 200 to 1500 cm−1, used PCA for preliminary evaluation, and established the soft independent modelling of class analogy model. The model can identify high-quality and poor-quality rice at an accuracy of between 80 and 100%. Liu et al. [140] collected Raman spectral data from 760 maize seeds from four different varieties from 400 to 1800 cm−1, selected characteristic wavelengths through CARS and established the MCARS-genetic algorithm-SVM model in 13 wavebands. The calibrated classification accuracy and prediction accuracy of the model are 99.29% and 100%, respectively. The grain quality can be quantitatively assessed based on characteristic peaks on Raman spectra of different nutritional ingredients in different grains. Pezzotti et al. [120] proposed and verified the quantitative algorithm for calculating the amylose and amylopectin components based on spectral differences across 830 to 895 cm−1. They also constructed the Raman equation for quantitatively determining the phenylalanine (PHE) and tryptophan components based on the significant features of PHE at 1003 cm−1 and the breathing vibration of indole rings of tryptophan at 768 cm−1. Singh et al. [121] collected transmitted Raman spectra of soybean flour from 400 to 1950 cm−1 and established the multi-variate linear regression classification model based on the spectral measure. The predicted R2 scores of proteins and fats in the soybean flour are separately 0.87 and 0.87. Yang et al. [122] studied Raman spectral characteristics of maize seeds from 380 to 180 cm−1 according to samples of standard chemical components of maize, including maize starch, protein, oil, and bran. They found that the characteristic peaks at 477, 1443, 1522, 1596, and 1654 cm−1 in their Raman spectra are separately correlated to the maize starch, oil-starch mixture, zeaxanthin, lignin, and oil.
Based on the NMR principle, a series of detectable inductive signals with attenuated intensity are generated when exciting atomic nuclei with fixed magnetic moments in samples using a specific impulse train. The intensity of the relaxation signals is in direct proportion to the number of nuclear spins in the detected samples (a quantitative basis) and the signal attenuation process is closely related to the constituent structure of the detected substances (a qualitative basis). The inverse analysis of signals using a mathematical method can yield information about various components and microstructures that fail to be obtained using other approaches, thus realizing the detection objective. Li et al. [123] identified the mass and oil content of individual maize kernels using an NMR sorting system. The mass of individual maize kernels is listed (in descending order) as haploid, diploid, and aborted kernels on the whole, with an extremely significant difference between diploid and aborted kernels and insignificant differences among other kernels; the oil contents are listed (in descending order) as diploid, haploid, and aborted kernels, and the oil contents are distributed in gradients in the three types of kernels.
In X-ray fluorescence spectrometry, various elements in samples release X-ray fluorescence with characteristic energy after being excited by irradiating these samples using X-rays. By measuring the wavelength and intensity of these X-rays, the elements present in the samples can be quantified. X-rays can be utilized to detect trace elements in grains. Lemmens et al. [124] adopted pearling, synchrotron X-ray fluorescence microscopy mapping, and X-ray absorption near-edge structure imaging of wheat to reveal changes in mineral elements such as Zn, Fe, and S during germination of wheat. This provides an opportunity for improving the nutritional quality in the food processing process. Chen et al. [125] investigated wheat flour samples by using the energy dispersive X-ray fluorescence spectrometry and extracted characteristic variables using the CARS. They also identified 12 energy variables (corresponding to mineral elements) to characterize the geographical attributes of samples. Through PCA and quadratic discriminant analysis, they established a non-linear model, which has the identification accuracy of 84.25% for origins of wheat flour through five-fold cross validation. Nguli et al. [71] estimated concentrations of Mn, Fe, Cu, and Zn in soybean kernels based on total reflection X-ray fluorescence, and their results show that soybean contains sufficient trace elements. Except for Fe which is present in high concentrations, concentrations of other elements are relatively low yet within the necessary range.
Detection based on acoustic features is used to evaluate grain quality according to the vibration responses of grains under certain excitation. The interactions between acoustic vibration and grains include reflection, scattering, transmission, and absorption. The propagation mode of acoustic vibration is determined by the vibro-acoustic characteristics of grains, which are related to the mechanical and structural properties of grains. Responses of grains to vibration are dependent on the elastic modulus, Poisson’s ratio, density, mass, and shape of grains, and the mechanical and structural properties of grains change with the growth and metabolism of cells. Detection based on acoustic features is widely used to assess attributes that are related to the mechanical and structural properties [93]. Khorshidi et al. [141] detected wheat varieties through transmission of longitudinal ultrasonic waves at five frequencies and established the PCA and generalized linear model thereof. Their results imply that, compared with other frequencies, ultrasonic measurement at 10 MHz can better identify wheat varieties and the ultrasonic phase velocity and longitudinal storage modulus at 10 MHz are the optimal discrimination factors for wheat varieties. Khorshidi et al. [141] also verified the capacity of low-intensity ultrasound at 10 MHz in identifying wheat varieties using 23 red, hard, spring wheat varieties. They confirmed through PCA that the ultrasonic parameters are significantly correlated to the protein content, falling number, and grain ash content of wheat. An acoustic detection method can be applied to quality detection and variety classification of grains, while it is susceptible to external environmental interference and can only be applied to a limited number of scenarios.
Mechanical properties of grains refer to mechanical features thereof under all types of applied load. Determining the mechanical parameters (rupture force, rupture energy, etc.) of grains under load can reduce the loss of grains in the harvest, transportation, storage, and processing processes. Research into the organizational structures and mechanical properties of grains provides a certain physical basis for improving the nutritive value and taste of grain products. Mechanical properties of grains are also an important factor that determines their processing quality, and determining the type and calculating the value of load borne by grains in the processing process can provide a basis for precision-design of relevant agricultural machinery [95]. Feng et al. [63] designed an orthogonal rotation combination test scheme. By using a multi-parameter controllable thin layer drying test bench, they dried maize under different conditions (temperatures of 30 to 60 °C, relative humidity of 30% to 60%, air velocities of 0.46 to 0.94 m s−1, initial moisture contents of maize of 20% to 30% w.b., and tempering ratios of 0 to 3). Thereafter, they employed a texture analyzer to measure various mechanical properties of dried maize kernels, including the rupture force, rupture energy, elastic modulus, and brittleness. They then established the model for relationships of the rupture force, rupture energy, elastic modulus, and brittleness with the drying conditions. As the drying temperature is increased from 30 °C to 60 °C, the rupture energy, elastic modulus, and brittleness of maize kernels separately are increased by 19.11%, 11.76%, and 4.02%; when the relative humidity during drying is increased from 30% to 60%, the rupture force, rupture energy, elastic modulus, and brittleness separately are increased by 15.07%, 13.74%, 20.73%, and 3.31%. Delwiche et al. [50] explored the relationships of super-soft wheat with three compressive strength properties (maximum stress, Young’s modulus, and Poisson’s ratio), with the correlation coefficients separately being 0.76, 0.66, and 0.75. Grain quality based on mechanical properties was detected mainly on the basis that the quality distribution of grains influences organizational structures of grains, which are then shown as the difference in mechanical properties. At present, the correlation between nutritional ingredients and organizational structures of grains remains unclear, and the grain quality detection based on mechanical properties is still in the initial exploratory stage.
Lu et al. [126] measured the original voltametric signals of rice-flour slurry using a self-made E-tongue and built a CNN+BpNN model. The training and prediction accuracies of the model for physical and chemical indicators including the degree of chalkiness, amylose, protein, starch, and total metal content are separately between 84.3% and 92.0% and 81.9% and 89.5%. Zhao et al. [40] assayed rice filtrate by using an E-tongue (α-Astree, and Alpha MOS, France). Discrimination factors DF1 and DF2 separately account for 97.24% and 97.58% of the total variability of paddy in the storage period, and the DF1 value of storage devices shows an increase trend while the DF2 value first increases, then decreases. The results show that rice samples under different storage conditions can be distinguished. Guo et al. [142] acquired current response signals of wheat leachates during five different storage periods using a self-made large amplitude pulse voltammetry (MLAPV) based E-tongue system. They also built a detection model based on wavelet packet transform, improved artificial fish swarm algorithm, and extreme learning machine. The model achieved the training and testing accuracies separately of 96% and 92% for aged wheat stored for five different periods.
NIRS, HSI, and RS can all be used to detect multiple quality indices; NMR detection can detect oils; X-rays can be employed to detect trace elements. In comparison, acoustic and mechanical responses of grains are insignificantly correlated with the nutritional attributes of grains; because grain leachates need to be prepared when detecting grains using an E-tongue, application of E-tongues is, to some extent, limited.
2.3. Non-Destructive Inspection Methods for Safety Attributes of Cereal Grains
|
Detection Methods |
Objects |
Devices |
References |
|---|---|---|---|
|
NIRS |
Fungal toxins |
Zeiss fiber optical spectrometer |
|
|
HSI |
Fungal toxins |
ANDOR EMCCD camera + Xenics LWNIR camera |
[145] |
|
RS |
Pesticide residues and fungal toxins |
1064-nm NanoRam Raman spectrometer |
|
|
X-ray |
Heavy metals and fungal toxins |
Y. CHEETAN micron-resolution X-ray CT scanner |
|
|
E-noses |
Pesticide residues and fungal toxins |
Fox3000 E-nose |
NIRS can be used to detect fungal toxins. Jiang et al. [143] collected spectra of wheat from 600 to 1600 nm and adopted the LDA and PLSR to construct a qualitative and quantitative analysis model for the degree of infection of wheat infected with harmful mold. The LDA model shows an overall identification rate above 90.0% for wheat samples with different degrees of mildew, and the determination coefficient of the PLSR model reaches 0.8592. Ong et al. [144] proposed a modified simulated annealing (MSA) algorithm to determine the concentration of aflatoxin B1 in rice. Compared with the full-spectrum regression model, the MSA algorithm provides more accurate detection (an improvement of more than 44% at the low concentration and one exceeding 62% at the high concentration).
HSI that combines spectral and image information can reach a higher detection accuracy. Zhou et al. [145] collected hyperspectral images of maize flour samples with different aflatoxin B concentrations from 430 to 2400 nm and proposed two algorithms with which to calculate the inter-class variance ratio and weighted inter-class variance ratio to extract the characteristic wavelengths. In this way, they established the SVM model, the average classification accuracy of which reaches 96.18%.
RS has been extensively used to detect safety attributes of grains [150–153]. Pesticide residues in grains produce clear characteristic peaks in the Raman spectra and changes in grain quality caused by mildew may induce variation of Raman spectra. According to response characteristics of Raman spectra of pesticides and mildew, the safety attributes of grains can be quantitatively detected. Qiu et al. [60] obtained Raman spectra of healthy wheat kernels, and wheat kernels with slight and severe gibberellic disease from 240 to 1736 cm−1. A classification model was established by using an inception-attention network, with classification accuracies of 97.13%, 91.49%, and 93.62% separately in the training, validation, and prediction sets. Long et al. [146] acquired Raman hyperspectral images from 732 to 1007 nm, from which 50 variables were screened by combining CARS with variance features. These variables are more applicable to determine the fungal spore count of individual maize kernels. In addition, they established an optimal detection model based on PLSR, with an R-value of 0.8619 in the validation test. Weng et al. [32] prepared efficient gold nanorods for detection based on surface enhanced RS and resolved Raman fitting using the density functional theory. When the residual concentrations of the wheat leachate and contaminated wheat are separately 0.2 and 0.25 mg/L, the Raman signals of pirimiphos-methyl can be detected. Jiang et al. [154] collected the surface enhanced Raman spectra of paddy samples with different Dursban concentrations. The R-values of calibration and prediction sets predicted using the CARS-PLS model are separately 0.9942 and 0.9881, and the LOD is 0.01 mg/mL.
X-rays are fluorescent and have been widely used to explore heavy metal residues in grains [92]. Sang et al. [147] developed an energy dispersive X-ray fluorescence spectrometric method to detect cadmium in rice, which resulted in an R-value of 0.9814 when compared with the measurement results of graphite furnace atomic absorption spectrometry. Zhou et al. [111] scanned wheat kernels through micron-resolution X-ray CT and determined whether wheat kernels are infected with mold or not by comparing grey values in different states.
E-noses, also known as artificial olfactory systems, are electronic systems that imitate biological noses. They mainly identify different types and components of materials according to odor. Mildew and pesticide residues of grains may produce volatile substances in the storage process, which can be qualitatively studied and quantitatively detected using an E-nose [97,155,156]. Zhou et al. [64] cultivated insect pests in a container containing 1 kg of rice at 15 °C and 30 °C for four weeks and detected the volatile substances in the rice with insect pests using an E-nose (Cyranose 320) every five days. In addition, the PCA was adopted to build the classification model. Results show that the E-nose can accurately identify clean rice and rice with insect pests at 30 °C, while it fails to discriminate among those stored for one, two, and three weeks. Mishra et al. [67] used an E-nose to evaluate changes in the quality of wheat artificially infected with Rhyzopertha dominica to different degrees in four storage periods. They also optimized the sensor array via hybrid neuro-fuzzy-assisted electronic nose analysis and detected the number of insect pests, uric acid content, and protein content, with R values of 0.999, 0.985, and 0.973 respectively. Ku et al. [148] inoculated Aspergillus candidus in fresh paddy, which was then loaded in a simulation grain bin and detected using an online detection system for mildew of grains. A model for the mold content was established by optimizing parameters using the particle swarm optimization. The R2 score for mold detection and the minimum LOD for mold content are 0.9839 and 1.5 × 10 cfu/g, respectively. Zhao et al. [149] collected the odor responses using an E-nose from wheat inoculated with mold after storage for 0, 1, 3, 5, and 7 days, and they established the relationship model with the degree of infection of mold. The PCA model can accurately differentiate wheat samples without mildew and with slight and severe mildew. The identification rate of the LDA model for the mildew degree of wheat infected with a single mold exceeds 90.0% and that for all wheat samples reaches 84.0%. The predicted R2 of the PLSR model for the total fungal count is 0.852.
NIRS and HSI can qualitatively identify and quantitatively detect fungal toxins. RS can detect fungal toxins and pesticide residues according to different Raman characteristic peaks. The mildew and heavy metal residues in grains can be detected based on X-rays due to their depth of penetration and fluorescent characteristics. E-noses can detect safety attributes of grains according to the volatile gases produced by fungal toxins and pesticide residues.
3.Unsolved Technical Problems
For different quality indices of grains, different types of detection methods can be used to realize high-accuracy detection. However, these methods still have room to improve in terms of grain-quality detection.
- High ① Optical detection methods including NIRS, HSI, and RS have developed to relative maturity, while the detection cost of full-spectrum devices is high. ② NMR instruments also face the problem of high cost.
- Environmental interference. Grain quality detection based on acoustic and thermal features is greatly influenced by the environment (ambient noise and temperature).
- Detection principle. ① The relationship between the mechanical features and quality indices of grains remains unclear. ② Water is an important factor that affects the dielectric property of grains, while the relationship between quality indices and dielectric properties of grains is also poorly understood. ③ Detection objects of E-tongues must be grain leachates, which limits the application thereof to the quality detection. ④ X-rays may contaminate grains.
- E-nose detection is limited by the LOD of gas sensors and the method fails to identify problems including early mildew in grains.
- Moisture detection. Water is an important factor that influences grain quality and must be detected in all stages including the harvest, storage, trading, transportation, and processing of grains.
- Grading and classification of grains. Grains can be graded and classified according to differences in multiple quality indices of grains in accordance with the national or international standards. However, research on grain quality using a single detection technique can only determine one or several indices, which fails to meet the grading and classification demands imposed in practice.
- Practical application issues. In different applications, grain quality inspection equipment faces different challenges; for example, the aerodynamic characteristics of the grain seeds during sowing, and the vibration of the machinery during harvesting can affect the quality inspection results.
4.Future Research Directions
- (1)考虑到筛选晶粒不同质量指标的特征波长仍然是现有质量检测研究的重要组成部分,基于特征波长的器件开发可以大大降低分析成本。这有利于光学检测装置的普及应用。近年来,随着近红外光谱分析和化学计量学方法的发展,近红外光谱仪[157,158]也得到了升级[159-162]。Liu等[163]选取4个特征波长研制了便携式近红外质量检测仪,可实现小麦籽粒中蛋白质和水分的实时测定。基于特征波长的多光谱成像[164]的发展可以克服这个问题。Sendin等人[165]使用19个特征波长区分优质和劣质玉米,分类精度在83%至100%的范围内。(2)核磁共振可分为高场核磁共振和低场核磁共振[166]。高场核磁共振波谱仪包含昂贵的超导磁体,因此它具有复杂的结构,其信号难以处理。低场核磁共振波谱仪使用低成本的永磁体,因此它是颗粒质量检测的首选。
- 声学特征包括可听见的声音和超声波。基于可听声学特征的检测容易受到环境噪声的影响,而基于超声波的声学检测可以避免环境干扰,是应用声学方法进行颗粒质量检测的重要方法[36]。消除基于热特征的检测的干扰(包括环境温度变化的影响)是提高颗粒质量检测精度的重中之重。Mangus等人[62]使用温度参考板进行环境校准,该参考板补偿环境影响,包括空气温度,相对湿度,太阳辐射和相机温度,从而保持测量温度。
- (1)谷物力学性能的差异是由包括淀粉和蛋白质在内的主要成分的粘结紧密性决定的。通过使用电子万能试验机,Cheng等人[167]测量了小麦的抗剪性。通过这种方式,他们获得了剪切阻力与蛋白质含量显着正相关,与干湿面筋正相关,与淀粉含量负相关(尽管不显着),与容重和千粒重量呈正相关(尽管不显着)。目前对谷物力学性能的研究主要集中在谷物质量评价[168],而这些性质与质量指标的相关性还有待进一步研究。(2)基于介电特性的晶粒水分检测已达到极高的精度,因此开发适用于不同应用场景的检测装置是未来发展的潜在方向[169]。(3)谷物渗滤液的制备费力,在下一次检测之前,E舌的检测电极需要经过复杂的清洁和抛光[142]。因此,开发电子舌检测样品制备技术,升级检测电极材料是实现实时高效检测晶粒质量指标的必由之路。(4)X射线包括硬型和软型[170];硬X射线可能会损坏颗粒,而软X射线的穿透性较低,因此适用于颗粒质量指标的检测。
- 通过仿生学设计模仿生物鼻的多尺度、系统组织是提高电子鼻LOD的方法之一。此外,开发高LOD气敏材料也是提高电子鼻性能的重要途径[171]。
- 对晶粒水分检测的研究已经发展到相对成熟,可以实现基于介电特性和NMR的高精度水分检测[56,75,172-175]。基于介电特性的水分检测设备取得了强劲进展[79,169,176],而基于NMR的水分检测设备尚未取得实质性发展。不同应用场景下谷物水分检测装置应是未来研究的重点。
- 结合籽粒多种质量检测技术,可以检测分级分级要求中的多项质量指标,从而实现籽粒分级分类。目前,一些研究结合了多种检测技术来提高检测精度[177–181]。结合多种质量检测技术实现谷类谷物的分级分类仍是未来研究的重点。
- 为保证粮食质量检测设备的正常运行,针对具体应用场景研究了影响粮食质量检测设备的干扰因素。Gierz等人[182]根据谷物种子的空气动力学特性[183,184]收集了气动播种机管道输送种子的空气速度(15、20、25 m/s)的种子图像数据,并构建了基于多层感知器的分类模型,该模型在播种速度为15 m/s时对种子中的污染物具有0.99的正确分类系数。研究不同应用场景的影响因素,是推动粮食质量检测仪器应用的必要条件。
This entry is adapted from the peer-reviewed paper 10.3390/agronomy12123187