Your browser does not fully support modern features. Please upgrade for a smoother experience.
Please note this is an old version of this entry, which may differ significantly from the current revision.
Subjects:
Water Resources
Climate change occurs through a complex set of interactive driving forces. According to the Intergovernmental Panel on Climate Change sixth assessment report (AR6; https://wg1.ipcc.ch/index.php/ar6/sixth-assessment-report-ar6; Accessed on 5 November 2022), human activity is the main driving force of climate change, whereas others contend that natural factors are also main causes.
- climatological parameters
- driving forces
- water resources
1. Introduction
To make water reserves more sustainable, it is necessary to determine how water quantity and quality would vary. Simulated data from regional models are a standard tool for predicting future water resources. Uncertainty and variability across models typically hinder the downscaling of large-scale water supply system predictions to small watersheds for water resource management decisions [1,2]. There is certain unanimity in stream behavior in different regions [3,4,5]. However, this is not the case for watershed effects. According to Fatichi et al. [6], natural climate variation may be more critical for variations in stream flow than systematic variability. Land use and anthropogenic variables also play a role in sustainable water resource management [5,7,8,9,10]. The determination of the impact of climate on stream flows has been a challenge in previous regional research [11,12,13].
Climate change affects the hydrological cycle by affecting precipitation, evapotranspiration, and soil moisture. A World Metrological Organization (WMO) report (2021) indicated that the average global temperature has increased by 0.8 °C since 1880 (https://library.wmo.int/doc_num.php?explnum_id=11178; Accessed on 5 November 2022). In 2021, the average global temperature was around 1.11 ± 0.13 °C above the level of 1850–1900 but less warm than some recent years. However, additional precipitation is dispersed irregularly across the planet. Certain parts of the globe may experience significant reductions in precipitation or significant seasonal variations. Thus, research on the impacts of climate change on diverse hydrological components is vital [14,15,16]. Meko and Woodhouse (2005) observed the Sacramento and upper Colorado river basins [17]. They discovered that the seasonal flow from melting snow in the spring has decreased over time. Different studies confirmed this result by employing complicated statistical approaches and analyzing other basins [18,19,20].
Climate change alters the overall discharge regime of river basins and modifies the stream and base flow in channel systems. Establishing a multi-model set by considering multiple simulations through a series of global climate models (GCMs) has become a common approach for understanding climate disorders [21,22]. Arnell (1999) determined that climate change significantly impacts flood risk [23]. Previous studies have examined the flooding frequency over climate change using different projected climate scenarios [24,25]. However, the impact of climate change on hydrological regimes and river flows at the catchment scale is different from that at the regional scale [26,27,28].
2. Driving Forces behind Climate Change
Climate change occurs through a complex set of interactive driving forces. According to the Intergovernmental Panel on Climate Change sixth assessment report (AR6; https://wg1.ipcc.ch/index.php/ar6/sixth-assessment-report-ar6; Accessed on 5 November 2022), human activity is the main driving force of climate change, whereas others contend that natural factors are also main causes. This ambiguity is due to inadequate data and methods to understand the phenomenon [34]. Both natural and human forces influence the Earth’s temperature, but the long-term trend observed over the last century can only be explained by the impact of human activities on the climate (Figure 2). Natural phenomena such as fluctuations in solar radiation and volcanic eruptions also have an impact on the Earth’s temperature. Similarly, Milankovitch cycles and El Niño Southern Oscillation (ENSO) are two other natural phenomena that are likely to change the Earth’s temperature. Milankovitch cycles occur as the Earth orbits the Sun, and its route and axis tilt might alter slightly. El Niño Southern Oscillation (ENSO) is a pattern of shifting Pacific Ocean water temperatures (https://www.metoffice.gov.uk/weather/climate-change/causes-of-climate-change; Accessed on 26 October 2022).
2.1. Population Growth
The human population increased from 1 billion to 7 billion in less than two centuries. Population growth has a direct relationship with the urbanization rate, and the growth of the urbanization rate in the past few decades is unprecedented. The two continents (Europe and Africa) are projected to be 56% and 64% urbanized, respectively, by the middle of this century [35,36]. In adaptation to environmental conditions, the nexus is shown in Figure 3.
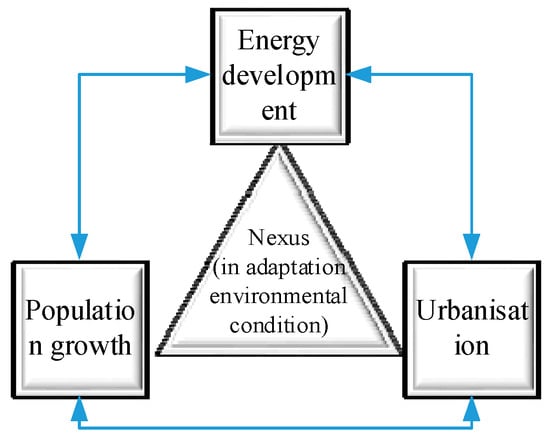
Figure 3. Conceptual diagram showing the nexus among population growth, urbanization, and energy development in the context of climate variability.
2.2. Technological Development
The evolution of technology has increased the use of fossil fuels, which is a major cause of the increase in the concentrations of CO2 and other greenhouse gases (GHGs). Understanding the environmental impacts of technological changes is essential for sustainable economic growth. Popp et al. [37] indicated that technology transition has largely affected the environment. They conjectured that advanced technology would escalate air pollution. Technological advancement is the most important part in projecting future impact on global environmental challenges, such as climate vulnerability [37]. Climate change is directly linked to air pollutants. Certain pollutants, such as black carbon and ozone, contribute to global warming by trapping heat in the atmosphere (Figure 4).
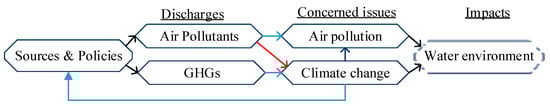
Figure 4. Connection between air pollution and climate change.
2.3. Economic Growth
The nexus between economic development (GDP) and environmental sustainability has been long discussed. In particular, environmental objectives such as limiting global warming below a threshold (2 °C or 1.5 °C) have been challenging owing to continuous economic growth [38]. Industrial growth has recently negatively impacted the environment and increased GHG concentrations, toxic pollutants, and chemical spills [39]. Wu et al. [40] hypothesized that income inequality and per capita income have an inverted U-shaped relationship. This indicates that the degree of environmental pollution increases as economic growth approaches the threshold income level and then declines at the same rate (Figure 5).
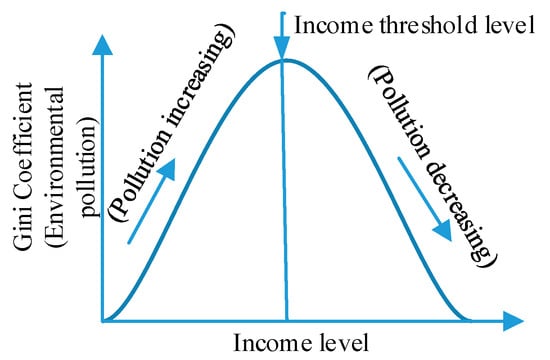
Figure 5. The relationship between per capita income (PCI) and environmental pollution.
2.4. Role of Institutions
It is vital to effectively address the role of institutions (particularly local ones) in preparation for adaptation to climate variations if this adaptation is to help the most susceptible social groups. Previous research indicates that the success of adaptation normally depends on the type of existing institutions [41]. Conversely, previous research also highlights the factors that resist adaptation and indicates institutional hurdles as a main cause of ineffective adaptation to climate variation [42,43,44,45]. The failure of institutions to adapt to climate change has aggravated their climate vulnerability (Figure 6).
Table 1. Summary of recent studies on major climate variability-forcing drivers.
| Driver | Major Findings | Methodologies/Techniques | References |
|---|---|---|---|
| Population growth/Urbanization |
|
|
[35] [46] [47] [48] [49] |
| Technologic development |
|
|
[50] [51] [37] [52] |
| Economic growth |
|
|
[53] [54] [55] [56] |
| Institutions |
|
|
[57] [58] [59] [60,61] |
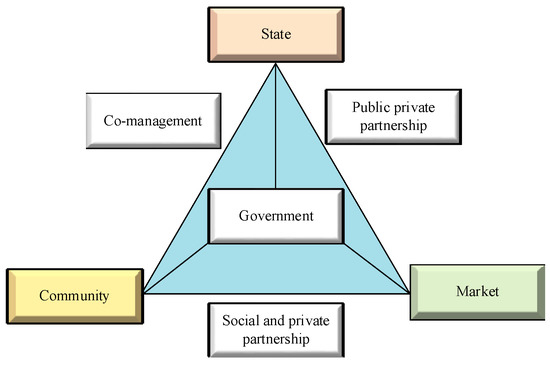
Figure 6. Institutional collaboration arrangements considering climate variability (aftser [43]).
This entry is adapted from the peer-reviewed paper 10.3390/hydrology9110203
This entry is offline, you can click here to edit this entry!