Lower-limb strength is a marker of functional decline in elders. The present entry describes different technological approaches for older people to measure their lower-limb strength in the community. The first section holds an explanation of functional decline, the frailty syndrome and their relationship to lower-limb strength. The second section holds a description of wearable technologies based on Inertial Measurement Units (IMUs) for lower-limb strength monitoring. Finally, the third section holds a description of the main challenges concerning portable ultrasound-based sensors for lower-limb strength monitoring.
- frailty syndrome
- sit-to-stand
- 30-s chair stand test
- ultrasound
- signal processing
1. Functional decline, the frailty syndrome, and lower-limb strength
The 30-s CST is a physical performance assessment tool; in particular, it measures lower-limb strength. It does so by quantifying the ability of older patients to repeatedly stand up from a chair, by specifically counting the number of times they stand up over thirty seconds. Poor physical performance in older patients is strongly related to undesired clinical outcomes such as disability, hospitalization, deaths, and falls. Disability and all these related outcomes are the culmination of a progressive process of physiological decline. A successful aging path will delay the onset of disability as late in life as possible (green line in Figure 1) as opposed to an unsuccessful aging path that will involve being disabled for several years (red line in Figure 1).
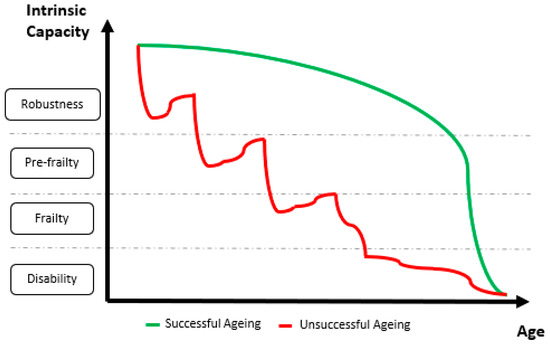
Figure 1. Graphical representation of simulated successful and unsuccessful aging trajectories. The horizontal axis represents the advance of time from the beginning of the old age to the end of life. The vertical axis represents the categories in which patients fall along the progress of functional decline (from robustness to disability). The green line represents a successful aging trajectory: good functional status is enjoyed for most of the old age and functional decline only happens rapidly and close to the end of life. The red line represents an unsuccessful aging trajectory: a clear trend of fast functional decline is observed throughout old age together with a long period of disability, several years long, before the end of life.
Within the context of an aging population, the social and the economic impacts of delaying the onset of dependency would be enormous because poor functionality has a strong impact on patients’ and relatives’ quality of life and makes them big users of health and social services. However, despite the remarkable increase in longevity enabled by healthcare systems, they do not achieve an extension of the period of good health and functionality [7]. Fortunately, it is indeed possible to extend good health and functionality because, even though disability is not reversible, it is preceded by a reversible stage known as frailty. By detecting the onset of frailty at early stages, frail people can be restored back to a robust status thanks to exercise-based interventions.
Several models were proposed to explain frailty, which is defined as a state of increased vulnerability to adverse outcomes due to a reduction in the ability to respond to stressors. Of course, all of these models identify physical performance as a strong frailty marker. In particular, lower-limb strength is one of the criteria for patient frailty stratification according to the frailty phenotypic model. There are multiple clinical tests to assess lower-limb strength; the most remarkable of them are based on assessing performance under repeated sit-to-stand conditions. The Short Physical Performance Battery (SPPB), for instance, is based on recording how long it takes for an older person to repeatedly stand up from a chair five times. Conversely, the 30-s CST is based on recording how many times a person stands up from a chair over 30 s. Any of them can be found in comprehensive geriatric assessment (CGA) tools, which are proposed as the most valuable tools to inquire the advance of frailty, to predict and prevent sudden adverse events, and to develop intervention plans for the delay and reversal of the onset of frailty.
2. Wearable sensors for lower-limb strength
An automated version of the 30-s CST is expected to count the same number of completed cycles as a manual count would do. It requires the automatic identification and delimitation of sit–stand–sit (STS) cycles and the ability to automatically spot and dismiss failed attempts (i.e., when the subject does not reach an upright posture). Inertial sensors and inertial measurement units (IMUs) were extensively used to study sit-to-stand and stand-to-sit transitions, as well as STS cycles, over the past three decades. Some of these studies looked for relationships between different kinematic parameters and the functional status (robust, pre-frail, frail) of the experimental subjects. A very popular approach is based on taking advantage of the quasi-periodic nature of the trunk movement during STS cycles. To do so, previous works used signals from an IMU on the subject’s lower back.
Van Lummel et al. used triaxial acceleration and triaxial angular velocity signals (dynaport device) to compute trunk pitch angle and vertical velocity signals, while Millor et al. used the vertical acceleration signal (MTx Orientation Tracker–Xsens Technologies B.V. Enschede, the Netherlands) to compute vertical velocity and vertical position. Computing velocity from an acceleration signal requires the integration of the acceleration signal. Modern accelerometers are very small but noisy micro-electro-mechanical systems (MEMS); therefore, the integration of their noisy output results in a drifting velocity signal. They require a heavy pre-processing stage to compensate for the said drift. In particular, Millor et al. reported that, on the one hand, they applied double integration combined with fourth-level polynomial curve adjustment and cubic spline interpolation; on the other hand, they relied on the MTx onboard Kalman filter estimation for the X-orientation to identify the STS sub-phases in combination with the vertical acceleration, the vertical velocity, and the vertical position.
The wearable devices described above require the IMUs to be placed on the L3 region of the subject’s lumbar spine. Older people might experience some difficulties in placing them on the correct spot, especially if they do not have any help to put them on. These previous studies did not study their algorithm sensitivity to misplacing the sensor; therefore, further studies are necessary to test the usability of these kinds of systems for an older population, as well as to assess the elders’ overall user experience, especially outside controlled experimental settings.
3. Portable sensors for lower-limb strength
Cobo et al. studied the feasibility of using the quasi-periodic nature of the distance between a subject's back and the chair backrest during a 30-s CST to carry out unsupervised measurements based on readings from a low-cost ultrasound sensor.
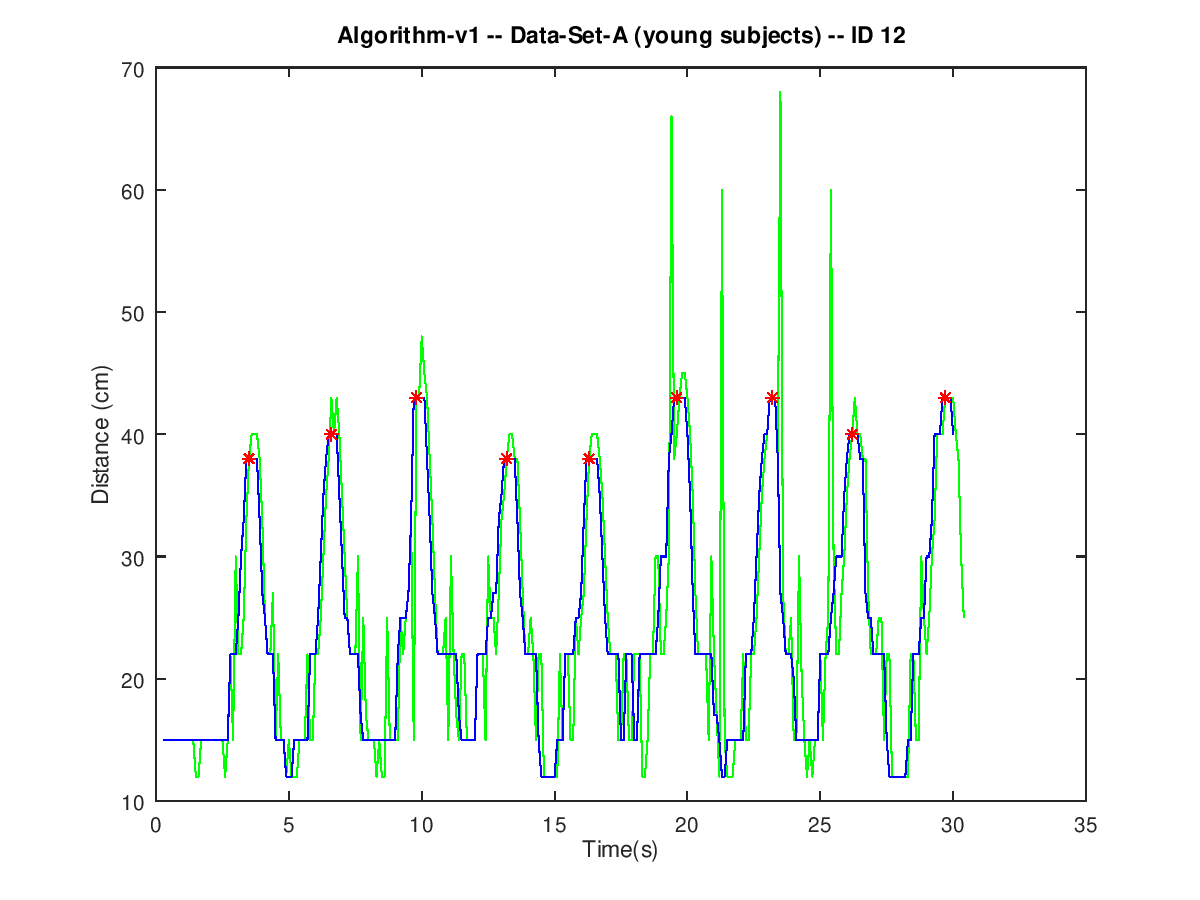
Signals from young healthy subjects show a few spurious spikes even after removing outliers in a pre-processing stage (green line in Figure 2). These spikes are indeed outliers that fell below the threshold in the pre-processing stage. Legitimate peaks up to 50 cm have been observed to be rather common. Nevertheless, lowering the pre-processing threshold to 50 cm did not show any significant improvement. Therefore, keeping the pre-processing threshold high prevents from making any legitimate peaks unrecognizable. Spurious spikes from young healthy subjects are narrow, spaced wide apart, and scarce. Therefore, they can be remove by a moving median filter (blue line in Figure 2). Even though they break the smooth progression of the curve, they do not affect the overall shape and the quasi-periodic nature of the signal. Therefore, all the peaks can be detected by identifying local maxima in the filtered signal (red dots in Figure 2) a deeper explanation of the processing algorithm can be found in [23].
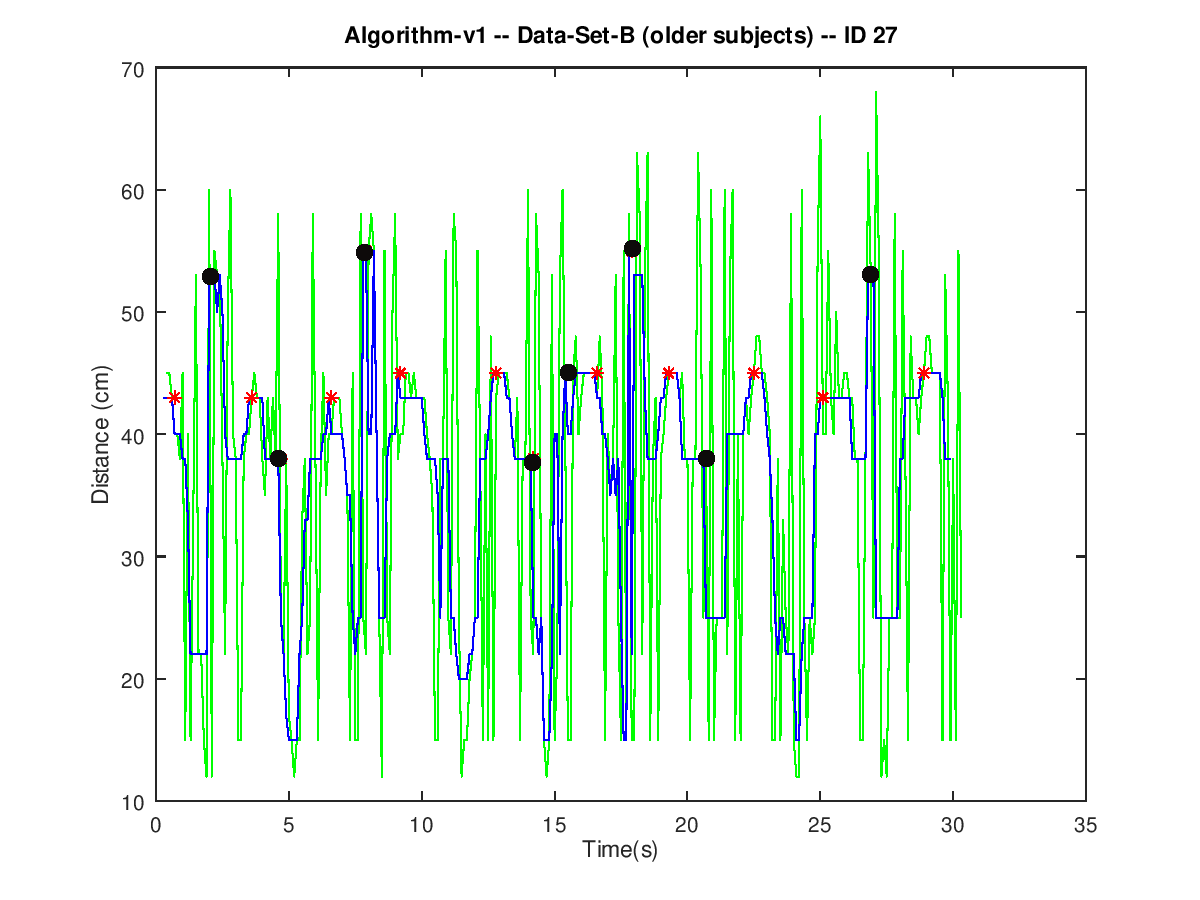
Conversely, spurious spikes in signals from older adults are abundant and very close to each other (green line in Figure 3). Therefore, their contribution to the output of a moving median filter (blue line in Figure 3) could result in a such a significant distortion that the peak detection algorithm might mistake it for a legitimate peak (black dots in Figure 3).
The source of the additional noise in the signals from older subjects is unclear. Functional decline (due to either normal aging or some condition, such as the frailty syndrome) imposes some mobility constraints on older people. Their movements become less precise and, during the experimentation, they might accidentally move the chair more prominently than their healthy young counterparts. For example, some of them need to lean back and forth repeatedly to gain some momentum and stand up.
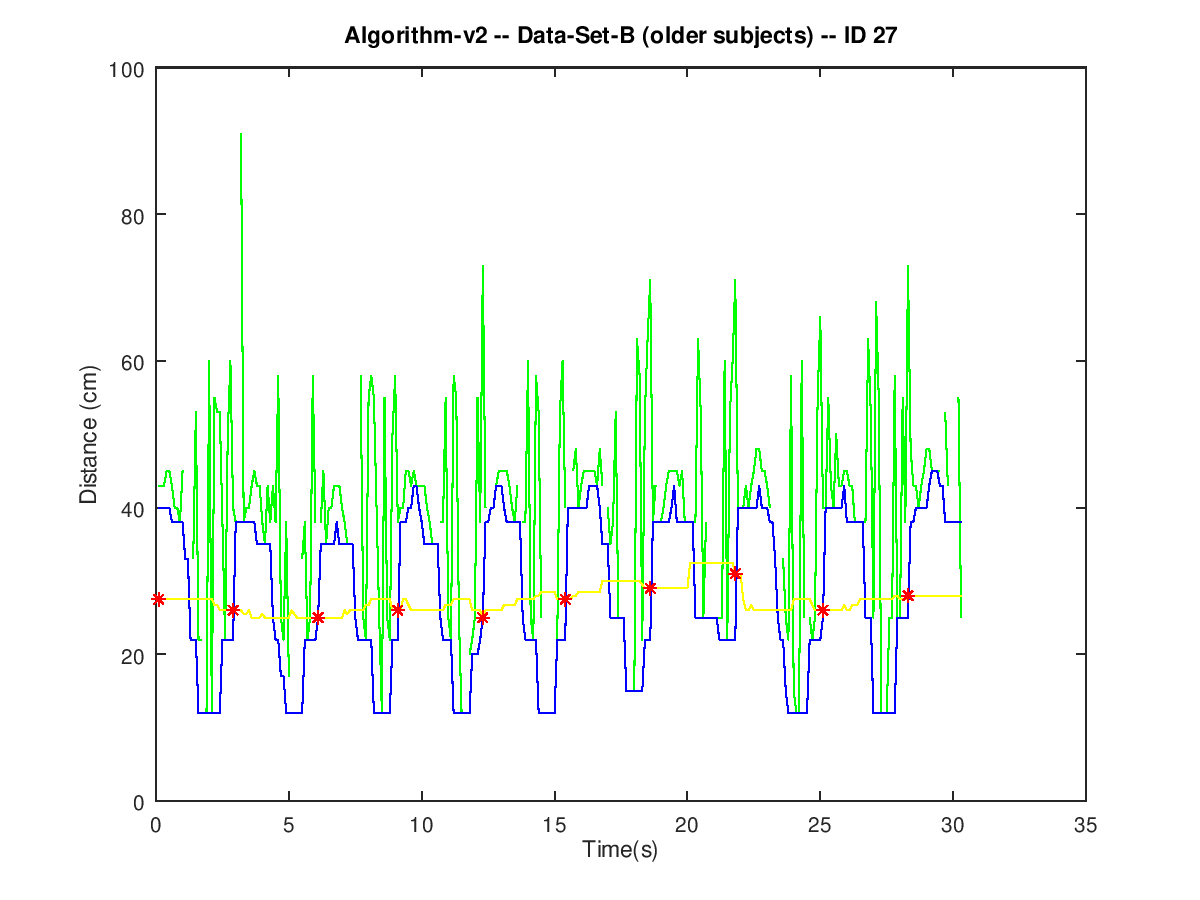
The effect of such a noise can be cancelled by substituting the moving median filter for a moving minimum filter. The output of such a filter (blue line in Figure 4) follows the envelope of the local minima in the pre-processed signal (green line in Figure 4). Legitimate sit-to-stand events (red dots in Figure 4) are easier to spot on the envelope of the local minima because such a filtered signal is freed from the rapid variations of the spurious spikes.
Even though a moving minimum filter cancels the effect of the spurious spikes, the outcome of the sensor does not always match manual count. The peak detection algorithm has been observed to have difficulties in correctly spotting sit-to-stand trnasitions when the value of the minima in the filtered signal is greater than 30 cm. This situation is hypothesized to happen whenever an elder does not lean back after sitting down on the chair. However, furhter experiments are necessary to explore this hypothesis.
This entry is adapted from the peer-reviewed paper 10.3390/s20071975