Catalpa bungei is an economically important tree with high-quality wood and highly valuable to the study of wood formation. Tension wood (TW) is a special kind of wood and can represent an excellent model for studying the formation of xylem cell walls. There was no obvious gelatinous layer (G-layer) in the TW of C. bungei and that the secondary wall deposition in the TW was reduced compared with that in the opposite wood (OW) and normal wood (NW). The cellulose and pectin content and pectin methylation in the TW were lower than those in the OW and NW according to Raman spectroscopy, and many genes and proteins involved in the metabolic pathways of cellulose and pectin, such as galacturonosyltransferase (GAUT), polygalacturonase (PG), endoglucanase (CLE) and β-glucosidase (BGLU) genes, were significantly upregulated in TW. In addition, the MYB2 transcription factor may regulate the pectin degradation genes PG1 and PG3, and ARF, ERF, SBP and MYB1 may be the key transcription factors regulating the synthesis and decomposition of cellulose.
- tension wood
- transcriptome
- proteomics
- Raman spectroscopy
- cellulose
- pectin
- Catalpa bungei
1. Anatomical Morphology of Different Types of C. bungei Wood
The observations of xylem slices of C. bungei showed that no G-layer was present in the TW induced by either natural bending or artificial bending (Figure 1 and Figure 2). There were significant differences in the anatomical characteristics between TW and OW and between TW and NW (Figure 2A–C). After dyeing, the TW became dark green, and the OW and NW appeared purplish red. The vessel length and width of the TW were significantly smaller than those of the OW and NW in the early stage, but the length-to-width ratio of the vessels in the TW was significantly larger (by approximately 43%) than that of the vessels in the OW and NW (Figure 2E). In addition, the number of vessels in the TW was significantly reduced (Figure 2F).
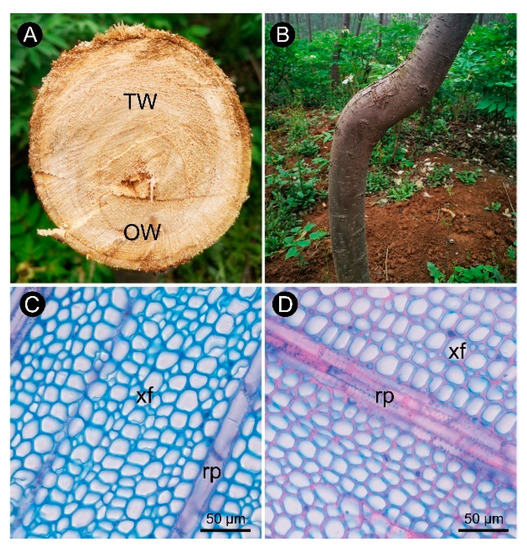
Figure 1. Anatomical morphology of C. bungei tension wood naturally bent for 7 years. (A) Wood cross-section of bent C. bungei. (B) Bent C. bungei. (C) Anatomical morphology of tension wood. (D) Anatomical morphology of opposite wood. (xf) Xylem fiber. (rp) Ray parenchyma.
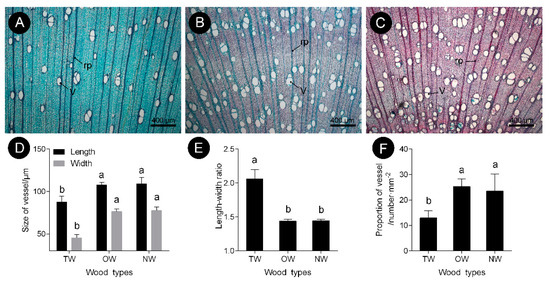
Figure 2. Vessel characteristics of C. bungei tension wood that was artificially bent for 3 months. (A) Tension wood. (B) Opposite wood. (C) Normal wood. (D) Size of vessel of different wood types. (E) Length-width ratio of different wood types. (F) Propotion of vessel of different wood types. (V) Vessel. (rp) Ray parenchyma. Different letters indicate significant differences.
This finding showed that the pattern of tracheary element differentiation changed during the formation of TW. There was no significant difference in the size of fiber cells between the TW and OW or TW and NW. However, the secondary wall thickness of TW was significantly reduced by approximately 33% (Figures 3D,G). To further analyze the key factors that contribute to the formation of TW, transcriptome and metabolite analyses were performed.
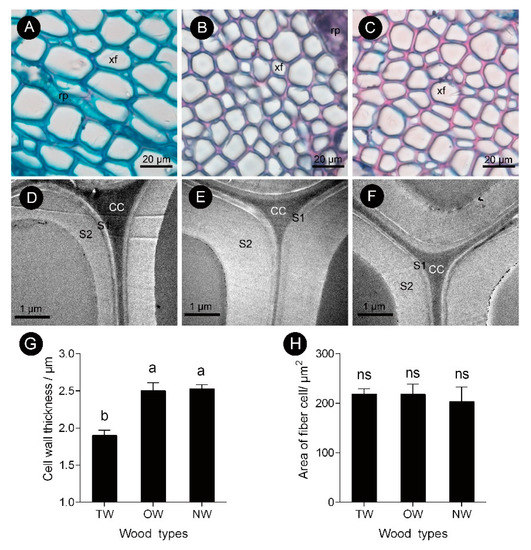
Figure 3. Fiber cell characteristics of C. bungei tension wood that was artificially bent for 3 months. (A and D) Tension wood. (B and E) Opposite wood. (C and F) Normal wood. (xf) Xylem fiber. (G) Cell wall thickness of different wood types. (H) Area of fiber cell of different wood types. (rp) Ray parenchyma. (CC) Cell corner. (S1) First secondary cell wall. (S2) Second secondary cell wall. Different letters indicate significant differences; ns: no significant differences.
2. DEGs and DEPs Between Different Wood Types
A total of 513 significantly upregulated mRNAs and 580 significantly downregulated mRNAs were identified in TW compared with NW. A total of 676 mRNAs were significantly upregulated and 429 were significantly downregulated in TW compared with OW (Figure 4). There were 105 DEPs in TW/NW, of which 67 were significantly upregulated and 38 were significantly downregulated. A total of 138 upregulated and 95 downregulated proteins were detected with significantly different expression levels in TW/OW (Figure 4).
mRNA and protein expression pattern analysis revealed that 29 and 47 genes in TW/NW and TW/OW, respectively, were upregulated at both in transcription and protein levels (Figure 5, Tables S3 and S4), and most of these genes were attributed to primary and secondary metabolite synthesis pathways. The genes in quadrant 2 and 3 have high transcription levels in TW, among which the protein level in quadrant 2 shows no significant difference between different wood types, and the protein expression level in quadrant 3 is low in TW, and both genes in quadrant 2 and 3 may be subject to post-transcriptional regulation. Genes and proteins in quadrant 9 are both downregulated in TW, and most of these genes are involved in metabolic processes (Tables S3 and S4). Genes in quadrant 1 and 9 may be the key genes associated with the change in chemical composition of TW.
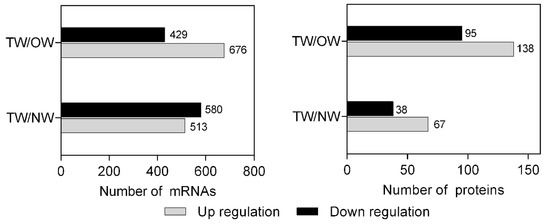
Figure 4. The number of DEGs and DEPs in different wood types.
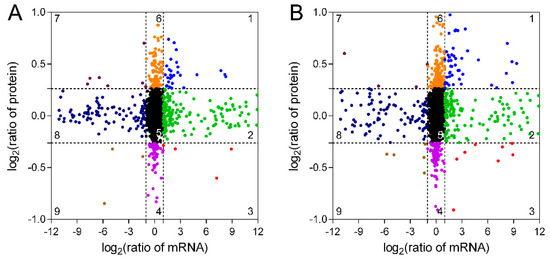
Figure 5. Relationship between mRNA and protein expression in TW/NW (A) and TW/OW (B).
3. GO Analyses of DEGs and DEPs in Different Wood Types
The GO database was used to resolve the functions of DEGs and DEPs. The results showed that most of the differentially expressed mRNAs in the TW/NW comparison were enriched in the carbohydrate metabolic process. Within the molecular function and cellular component categories, and the functions of differentially expressed mRNAs were mainly related to transporter activities and membranes. This suggests that carbohydrate synthesis and transmembrane transport of metabolites may be among the key steps for the formation of TW. In the TW/OW comparison, most of the GO functional annotations of the differentially expressed mRNAs were enriched in terms in the molecular function category involved in catalytic, hydrolase and transporter activities. Additionally, some genes were also significantly enriched in the carbohydrate metabolic process. This suggests that polysaccharide metabolism is an important process during the early formation of TW.
The GO enrichment results showed that some of the DEGs in TW/OW were involved in the synthesis of cellulose and the construction of the cytoskeleton (Table S5). During the TW formation in C. bungei, the DEPs are also involved in carbohydrate metabolism-related functions, such as poly-galacturonase activity, β-fructofuranosidase activity, α-glucosidase activity, carbohydrate derivative transporter activity and extracellular polysaccharide biosynthetic process. In addition, differential protein functions were observed for protein complexes and proteins binding to DNA, most of which were annotated as protein complex assembly, protein-DNA complex, and protein complex subunit organization. This suggests that protein complexes are the forms that are functional during TW formation.
4. KEGG Pathway Analyses of DEGs and DEPs in Different Wood Types
The KEGG pathway database was utilized to facilitate the interpretation of the metabolic processes that differed between TW and NW and between TW and OW. Most differentially expressed mRNAs participate in the carbohydrate metabolism, synthesis of secondary metabolites, and phenylpropanoid, sesquiterpenoid, triterpenoid, anthocyanin and flavonoid biosynthesis. Similar to the GO enrichment, most of the differentially expressed mRNAs act in the carbohydrate metabolism pathway, for example “starch and sucrose metabolism” and “amino sugar and nucleotide sugar metabolism”, in both the TW/NW and TW/OW comparisons. (Figure 6).
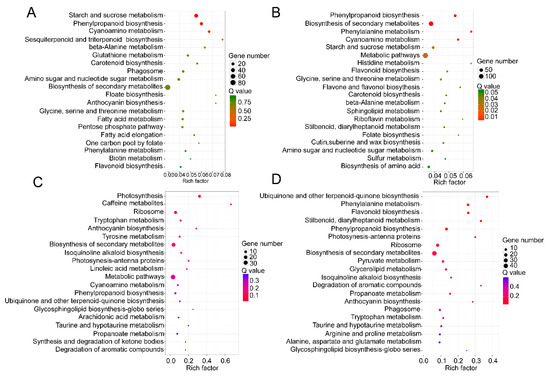
Figure 6. Top 20 of KEGG pathway enrichment of DEGs in the transcriptome (A and B) and DEPs in the proteome (C and D). (A and C) TW/NW, (B and D) TW/OW. The q value is the p value corrected by false discovery rate method.
5. Changes in Gene and Protein Expression in Cellulose, Hemicellulose and Pectin Biosynthesis during TW Formation
Figure 7 shows that the Raman intensity of TW and NW were similar and significantly lower than OW in the wavenumbers 320~650 cm−1. And the peak value of TW was significantly lower than that of OW and NW in the wavenumbers 900~1800 cm−1 and 2000~3200 cm−1. In the Raman spectra, the bands observed in the 2800~3000 cm−1 range could be assigned to the C-H stretching vibrations of –CH, -CH2, -CH3 groups [1][2][3][4][5], in this region all cell walls compounds contributed to the Raman signal. And the peak of TW was lower than that of OW and NW in the range of this wavelength. Confocal microscopy imaging results also showed that the TW Raman signal was weakest and that the precipitation of cell wall polymers from TW was greatly reduced (Figure 7A).
The wavenumbers 326~405 cm−1, 1092~1122 cm−1 and 2800~3000 cm−1 in the Raman spectra reflect the symmetric bending vibration of CCC in the pyranoid ring, the asymmetric and symmetric stretching vibration of COC in the glucosidic bond and the stretching vibration of CH and CH2 in cellulose, respectively [6][7]. Thus, these characteristic peaks represent the relative cellulose content. The spectral results showed that the TW had the lowest absorption peak at 385, 1100, 1125 and 2897 cm−1 (Figures 7).
Meanwhile, during the TW formation process, two cellulose catabolism genes (CELs) were significantly upregulated in TW/NW and TW/OW, respectively. Two β-glucosidase (BGLU) genes were significantly upregulated in TW/NW, and five BGLU genes were significantly upregulated. In addition, two BGLU proteins were also found to be significantly upregulated in the TW formation process according to proteomics. Interestingly, not only BGLU6 transcription but also BGLU6 protein expression in TW was significantly higher than that in OW (Figure 8, Tables S6 and S7). BGLU is one of the members of the cellulase family, hydrolyzing cellobiose to two molecules of glucose. This may contribute to decreased deposition of TW fiber cell wall. We also found that mRNAs related to hemicellulose biosynthesis were differential expression between TW and OW, among which 5 xyloglucan glycosyltransferase (XTH) genes and 1 glucomannan 4-β-mannosyltransferase (CLSA9) gene were significantly up-regulated in TW (Table S6). This suggested that there may be higher content of xyloglucan and glucomannan in TW.
The polygalacturonase (PG) enzyme-coding gene, which is involved in catalyzing pectin degradation in TW, was significantly upregulated in TW compared with NW and OW. There are 5 PGs that are upregulated during TW formation, and the protein products of three of these genes (evm.model.group11.687, evm.model.group7.2243 and evm.model.group7.2616) are also present at high levels in TW (Figure 8, Tables S6 and S7). According to the literature [1][2][3][4]. The analysis of the spectra of plant samples in the 1600~1800 cm−1 range is used to characterize pectin in plant material. In this study, the two peaks (1660 and 1736 cm−1) of TW were lower than that of OW and NW (Figure 7C). This confirmed that pectin in TW was less and may be rapidly degraded. On the other hand, in the cell wall pectin with a different degree of methylesterification can be found. The most prominent Raman marker band for the identification of pectin polysaccharides is centered at 852 cm−1 which is due to the vibrations of α-glycosidic bonds in pectin. The wavenumber position of this band is shifted from 858 cm−1 for a low methylesterification degree to around 842 cm−1 for a high methylation degree [4]. But in our study, there were no obvious absorption peak at 852 cm−1, and the signal intensity of TW was lowest at this wavenumber. It implied the lowest methylation degree of TW. In addition, the significant upregulation of the galacturonic transferase gene (GAUT), glucuronoxylan glucuronosyltransferase gene (IRX7) and glucuronoxylan 4-O-methyltransferase gene and protein in the TW/OW or TW/NW comparisons also implied that pectin metabolism was very important for TW formation (Tables S6 and S7). Due to these enzymes can catalyze the biosynthesis of different types of pectin.
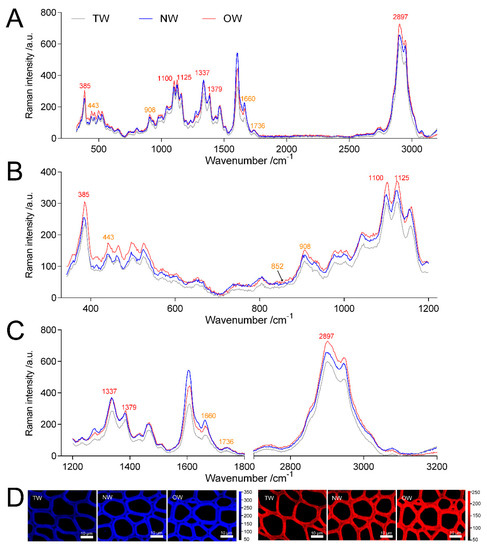
Figure 7. Analysis of Raman spectra of the secondary walls of different wood types. (A) Averaged Raman spectra in the range of 350~3200 cm−1 of the secondary walls of different wood types. (B) Averaged Raman spectra in the range of 350~1200 cm−1 of the secondary walls of different wood types. (C) Averaged Raman spectra in the range of 1200~3200 cm−1 of the secondary walls of different wood types. (D) confocal Raman spectral imaging; blue indicates images of xylem calculated by integrating from 2804~2930 cm−1, and red indicates images of xylem calculated by integrating from 326~405 cm−1.
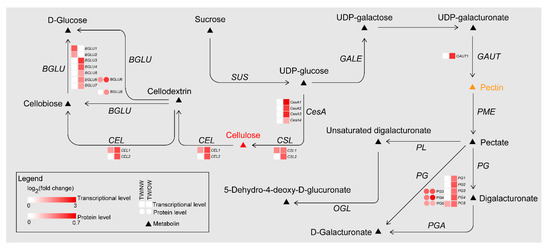
Figure 8. DEGs and DEPs involved in cellulose and pectin biosynthesis pathways of TW formation.
TW has a variety of morphological characteristics, and the most obvious difference is the presence of the G-layer. We reviewed several papers [8][9][10][11][12][13][14][15][16][17] to explore the causes of the non-G-layer TW formation. The expression of cellulose and pectin metabolic genes in C. bungei and other trees was compared (Figure 9). The results are shown in Figures 9A,B. A large number of genes related to cellulose synthesis, for instance CesA and SUS, were upregulated in TW with a G-layer. However, the many cellulase genes (BGLUs and CELs) were significantly upregulated in C. bungei T. For pectin metabolism, some GAUT, PG, BGAL and AF genes were highly expressed in TW/OW of C. bungei. And PME, PAE and PL were differently expressed in TW of other tree species.
Comparison of the proteome between poplar and C. bungei TW formation showed (Figure 9C,D) that several CesA and SUS proteins, which participate in cellulose biosynthesis, had high levels in poplar TW, but no such result was observed in the C. bungei TW proteome. Cellulose hydrolysis-related proteins (BGLU and CEL) and pectin degradation-related proteins (PG) were highly expressed in C. bungei TW. Differences in cellulose and pectin metabolism could be an important reason for the difference in TW morphology between C. bungei and other tree species.
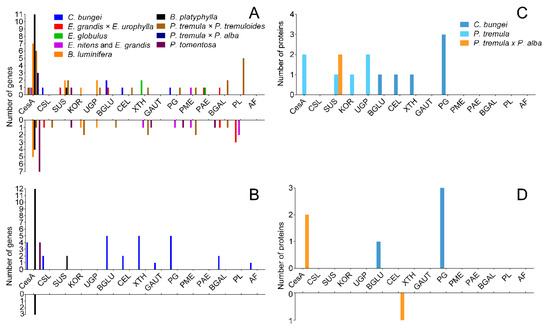
Figure 9. The number of DEGs and DEPs involved in cellulose and pectin biosynthesis during TW formation in different tree species. (A and B) DEGs in the transcriptome, (C and D) DEPs in the proteome.
6. Transcript Levels and qRT-PCR Validation of mRNA in Different Wood Types
To test the reliability of the transcriptome data, eleven mRNAs that were significantly differentially expressed in both comparison groups were selected for qRT-PCR (Figure 10). The results showed that the relative expression trend of the 11 genes in the fluorescence-based qRT-PCR data was consistent with the transcriptome sequencing results. This result indicated that the transcriptome results were highly reliable.
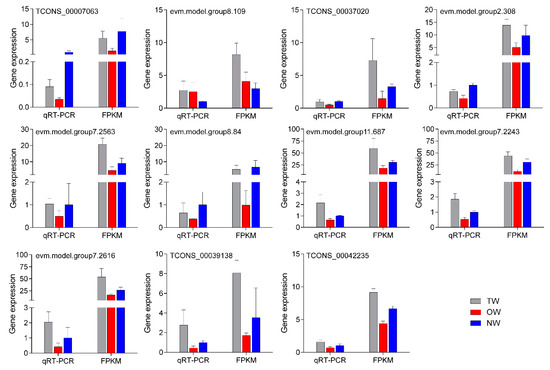
Figure 10. qRT-PCR validation of key genes in different wood types.
7. Transcriptional Regulation Network
Gene function is often inseparable from transcriptional regulation. We analyzed the upstream 2000-bp sequence from the DEG coding sequences and the potential binding motifs of transcription factors, and we found that five transcription factors have paired relationships with key DEGs (Figure 11). Among these transcription factors, the MYB2 transcription factor may regulate PG1 and PG3, and ARF has a potential targeting relationship with BGLU2 and BGLU6. ERF, SBP and MYB1 may regulate the CEL1, CSL2 and BGLU1 genes, respectively.
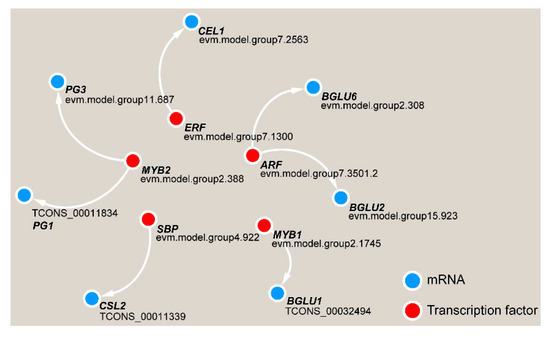
Figure 11. Transcriptional regulatory network in TW formation in C. bungei.
This entry is adapted from the peer-reviewed paper 10.3390/ijms21051686
References
- Socrates, G.. Infrared and Raman Characteristic Group Frequencies. 3rd Ed.; Wiley & Sons: Chichester, New York, UK, Weinheim, Toronto, Brisbane, Singapore, 2001; pp. Chap. 2.
- Monika Szymanska-Chargot; Justyna Cybulska; Artur Zdunek; Sensing the Structural Differences in Cellulose from Apple and Bacterial Cell Wall Materials by Raman and FT-IR Spectroscopy. Sensors 2011, 11, 5543-5560, 10.3390/s110605543.
- Magdalena Wróbel-Kwiatkowska; Magdalena Zuk; Jan Szopa; Lucyna Dymińska; Mirosław Mączka; Jerzy Hanuza; Poly-3-hydroxy butyric acid interaction with the transgenic flax fibers: FT-IR and Raman spectra of the composite extracted from a GM flax. Spectrochimica Acta Part A: Molecular and Biomolecular Spectroscopy 2009, 73, 286-294, 10.1016/j.saa.2009.02.034.
- A Synytsya; J Čopı́ková; Pavel Matějka; V Machovic; Fourier transform Raman and infrared spectroscopy of pectins. Carbohydrate Polymers 2003, 54, 97-106, 10.1016/s0144-8617(03)00158-9.
- Kexia Jin; Xi Yang; Kun Wang; Zehui Jiang; GenLin Tian; Shumin Yang; Lili Shang; Jianfeng Ma; Imaging the dynamic deposition of cell wall polymer in xylem and phloem in Populus × euramericana. Planta 2018, 248, 849-858, 10.1007/s00425-018-2931-9.
- Umesh P. Agarwal; Sally A. Ralph; FT-Raman Spectroscopy of Wood: Identifying Contributions of Lignin and Carbohydrate Polymers in the Spectrum of Black Spruce (Picea Mariana). Applied Spectroscopy 1997, 51, 1648-1655, 10.1366/0003702971939316.
- H.G.M. Edwards; D.W. Farwell; D. Webster; FT Raman microscopy of untreated natural plant fibres.. Spectrochimica Acta Part A: Molecular and Biomolecular Spectroscopy 1997, 53, 2383-2392, 10.1016/s1386-1425(97)00178-9.
- Sara Andersson-Gunnerås; Ewa J. Mellerowicz; Jonathan Love; Bo Segerman; Yasunori Ohmiya; Pedro M. Coutinho; Peter Nilsson; Bernard Henrissat; Thomas Moritz; B Sundberg; et al. Biosynthesis of cellulose-enriched tension wood inPopulus: global analysis of transcripts and metabolites identifies biochemical and developmental regulators in secondary wall biosynthesis. The Plant Journal 2006, 45, 144-165, 10.1111/j.1365-313x.2005.02584.x.
- Eshchar Mizrachi; Victoria J. Maloney; Janine Silberbauer; Charles A. Hefer; Dave K. Berger; Shawn D. Mansfield; Alexander Myburg; Investigating the molecular underpinnings underlying morphology and changes in carbon partitioning during tension wood formation inEucalyptus. New Phytologist 2014, 206, 1351-1363, 10.1111/nph.13152.
- Etienne Paux; Victor Carocha; Cristina Marques; António Mendes De Sousa; Nuno Borralho; Pierre Sivadon; Jacqueline Grima‐Pettenati; Transcript profiling of Eucalyptus xylem genes during tension wood formation. New Phytologist 2005, 167, 89-100, 10.1111/j.1469-8137.2005.01396.x.
- Deyou Qiu; Iain Wilson; Siming Gan; Russell Washusen; Gavin F. Moran; Simon Southerton; Gene expression inEucalyptusbranch wood with marked variation in cellulose microfibril orientation and lacking G-layers. New Phytologist 2008, 179, 94-103, 10.1111/j.1469-8137.2008.02439.x.
- Miaomiao Cai; Huahong Huang; Fei Ni; Zaikang Tong; Erpei Lin; Muyuan Zhu; RNA-Seq analysis of differential gene expression in Betula luminifera xylem during the early stages of tension wood formation.. PeerJ 2018, 6, e5427, 10.7717/peerj.5427.
- Chao Wang; Nan Zhang; Caiqiu Gao; Zhiyuan Cui; Dan Sun; Chuanping Yang; Yucheng Wang; Comprehensive Transcriptome Analysis of Developing Xylem Responding to Artificial Bending and Gravitational Stimuli in Betula platyphylla. PLOS ONE 2014, 9, e87566, 10.1371/journal.pone.0087566.
- W. Azri; A. Ennajah; Z. Nasr; S. -Y. Woo; A. Khaldi; Transcriptome profiling the basal region of poplar stems during the early gravitropic response. Biologia plantarum 2013, 58, 55-63, 10.1007/s10535-013-0364-7.
- Joakim Bygdell; Vaibhav Srivastava; Ogonna Obudulu; Manoj K Srivastava; Robert Nilsson; Björn Sundberg; Johan Trygg; Ewa J Mellerowicz; Gunnar Wingsle; Protein expression in tension wood formation monitored at high tissue resolution in Populus. Journal of Experimental Botany 2017, 68, 3405-3417, 10.1093/jxb/erx186.
- Jinhui Chen; Beibei Chen; Deqiang Zhang; Transcript profiling of Populus tomentosa genes in normal, tension, and opposite wood by RNA-seq. BMC Genomics 2015, 16, 164, 10.1186/s12864-015-1390-y.
- Mélanie Mauriat; Jean-Charles Leple; Stéphane Claverol; Jérôme Bartholomé; Luc Negroni; Nicolas Richet; Céline Lalanne; Marc Bonneu; Catherine Coutand; Christophe Plomion; et al. Quantitative Proteomic and Phosphoproteomic Approaches for Deciphering the Signaling Pathway for Tension Wood Formation in Poplar. Journal of Proteome Research 2015, 14, 3188-3203, 10.1021/acs.jproteome.5b00140.
