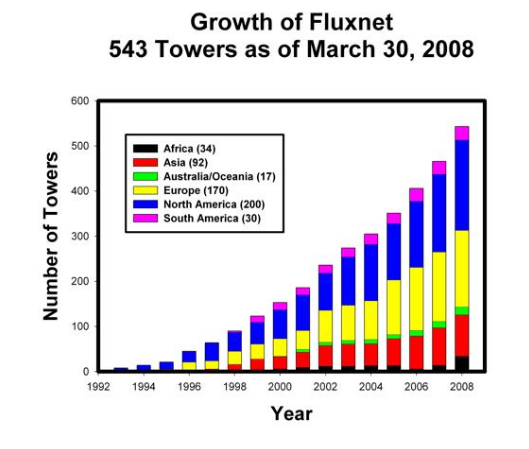
FluxNet is a global network of micrometeorological tower sites that use eddy covariance methods to measure the exchanges of carbon dioxide, water vapor, and energy between the biosphere and atmosphere. Fluxnet is a global 'network of regional networks' that serves to provide an infrastructure to compile, archive and distribute data for the scientific community. It works to ensure that different flux networks are calibrated to facilitate comparison between sites, and it provides a forum for the distribution of knowledge and data between scientists. As of April 2014, there are over 683 tower sites in continuous long-term operation. Researchers also collect data on site vegetation, soil, trace gas fluxes, hydrology, and meteorological characteristics at the tower sites.
- global network
- micrometeorological
- eddy covariance
1. Scientific Goals
According to the Fluxnet website, the goals of the project are as follows:[1]
- To "quantify the spatial differences in carbon dioxide and water vapor exchange rates that may be experienced within and across natural ecosystems and climatic gradients"
- To "quantify temporal dynamics and variability (seasonal, inter-annual) of carbon, water and energy flux densities; such data allows us to examine the influences of phenology, droughts, heat spells, El Nino, length of growing season and presence or absence of snow on canopy-scale fluxes"
- To "quantify the variations of carbon dioxide and water vapor fluxes due to changes in insolation, temperature, soil moisture, photosynthetic capacity, nutrition, canopy structure and ecosystem functional type."
2. History
Scientists have been measuring water vapor and carbon dioxide exchange between the Earth's surface and the atmosphere since the late 1950s. The relatively undeveloped computing capabilities and solid state measurement capabilities made it almost impossible to be able to get accurate measurements. Early scientists such as John Monteith used the "flux gradient" method to make semi-accurate assessments of the fluxes in a variety of natural settings. The work of scientists such as Monteith realized that the Flux Gradient method was not nearly as accurate as it needed to be when used to measure trace gas exchange in tall forests. Eventually, they realized that the downfall of their models was caused by "large scale transport in the roughness sublayer".[2] The reason for these data inaccuracies was hypothesized to arise from Monin-Obukhov scaling theory.
As digital technology advanced throughout the 1970s and 80s, so did advances in the sensors and digital hardware necessary to provide the means to make advanced measurements of fluxes with what became known as the eddy covariance technique. With this method as well as further advances in digital data storage, it became possible for curious scientists to make these eddy flux measurements for long periods of time and consequently get a sense of annual carbon dioxide and water vapor changes in the biosphere. As these techniques became more widespread in the scientific community, more research groups took the initiative to establish further measurement sites. Eventually, enough sites were established to allow research of fluxes over wide areas of land with the help of multiple investigators. An example of such a study is the "Boreal Ecosystem-Atmosphere Study".[3]
With the success of such projects, participating scientists began to explore the idea of creating a global network of sensor sites that could be used to integrate their data and provide access for the members of the academic community and general public. At a meeting in La Thuile, Italy during 1995, contributing scientists began to discuss the feasibility of such a network. With the successful conclusion of this meeting, there was an increase in the rate of sensor site installation and the growth of regional networks. Eventually, the Euroflux network took hold in 1996 and was soon followed by the AmeriFlux network in 1997. When NASA saw the enthusiasm from the scientific community for these two networks as well as the possibility to integrate trace gas data from the ground with data from the Earth Observatory Satellite, it finally funded the Fluxnet project as a whole in 1998.
In 2002, Fluxnet was added to the NOAA Observing System Architecture (NOSA).
3. Future Site Planning
Future FluxNet sites are planned according to a desirable accuracy in the acquired data. With the current model used to determine flux between the surface and the atmosphere, it is desirable to situate the tower in an area with uniform vegetative cover and minimal disturbances in the terrain. Deviations in terrain or plant cover would prevent a constant gas flux along the height of the tower.
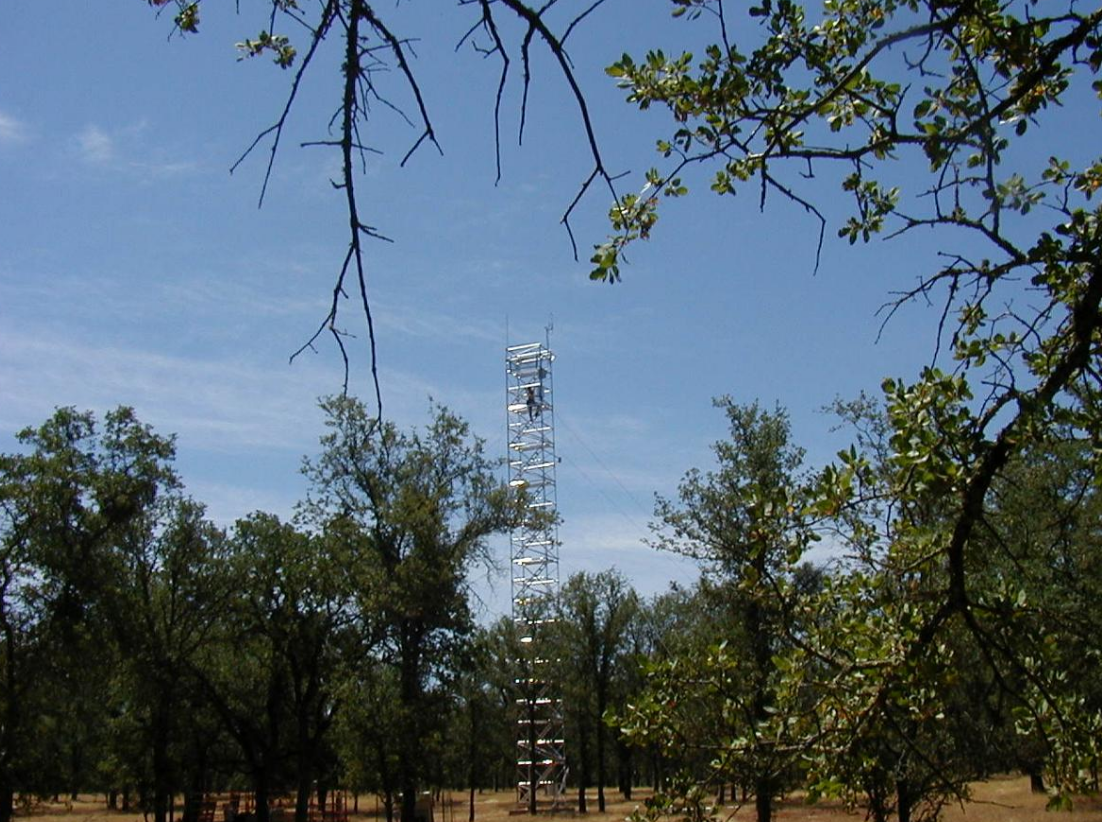
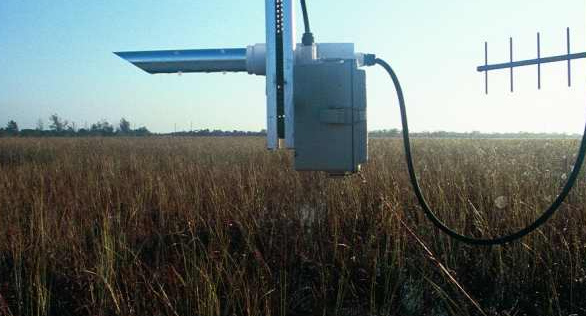
Another very important part of the sensor array is the tower on which it rests. The sensor tower must fit within a certain design criteria dependent on:
- the height of the vegetation in the area
- the average wind speed
- the sampling time of the sensors
Typically, investigators who are monitoring fluxes in agricultural cropland place their sensors close to the ground. Meanwhile, scientists who hope to measure the fluxes in tall forests must place their sensors on relatively high scaffolding. The difference in sizes is attributed to the boundary layers that form close to the ground because of the vegetation. To minimize turbulence from the tower itself, instrumentation is often placed at the top of the tower and offset several feet with the help of booms.
4. Instrumentation and Data Processing
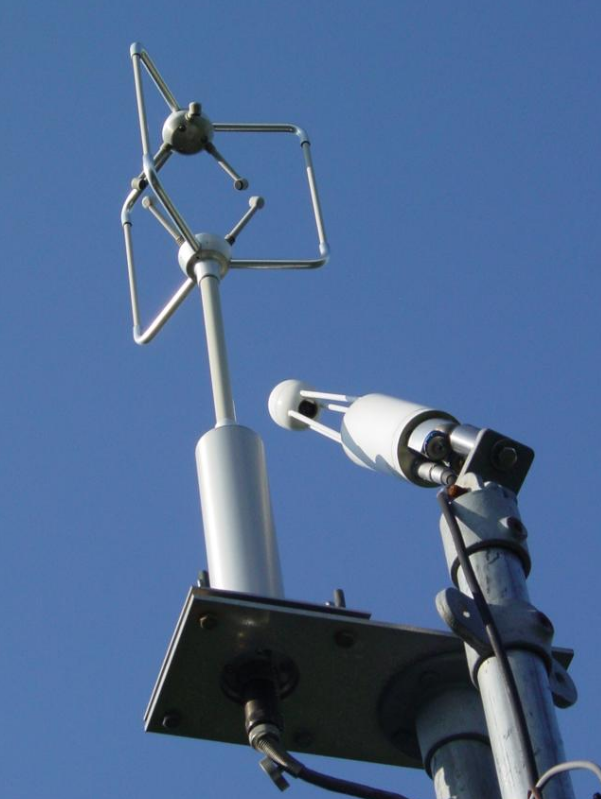
Most FluxNet sites have at minimum sensors to accurately measure the wind speed as well as the concentration of the trace gases in question. To obtain the necessary data, it is common for the towers to employ a sonic anemometer, an infrared gas analyzer and some sensor to measure humidity. These tools are necessary because they provide the necessary variables to be put into the eddy covariance model of gas flux in the biosphere.[4]
The principle behind the eddy covariance technique is that parcels of air have eddy like characteristics in the atmosphere. In other words, when trace gases are respired by vegetation, their velocity can be represented by a 3D vector. The purpose of using such a precise anemometer is to measure value of the wind velocity component in three dimensions. Using the infrared gas analyzer and the humidity sensor, the concentration of water vapor and trace gases in the air sample is measured and sent to a computer which quickly figures out the mass flux of the gas in question. This mass flux makes the FluxNet project a valuable tool to scientists trying to monitor long term changes in trace gas flux within the atmosphere.
Many different forms of anemometer exist on the current market. Unfortunately, the majority of the anemometers can only measure wind velocity in one plane and require a certain start-up wind speed. Sonic anemometers are solid state devices that measure the wind speed by passing ultrasonic sound waves through the moving air. As wind speed changes, so does the air density and when the density changes, so does the speed of sound. By measuring the change in time it takes for the ultrasonic sound wave to make its way from the emitter to the sensor, the sonic anemometer can measure the total air speed as well as its direction.[5]
This sensor works because Infrared light is absorbed by a variety of gases at different wavelengths within the spectrum including methane, carbon monoxide, carbon dioxide and oxygen. To measure the concentration, a beam of light is emitted into the air sample. By measuring the difference between the input and output of the infrared beam, the sensor can determine the amount of the trace gases in the sample.[6] It is common for an infrared gas analyzer to have two configurations. The "open design" operates by shooting a beam of infrared light through the air outside of the sensor body. Meanwhile, the closed design works by sucking air into the sensor body measuring the concentration of trace gases inside of a sealed chamber. Usually, open sensors are placed within half a meter of the anemometer while closed sensors use a collection tube mounted inside the anemometer to get their air sample.[2]
The hygrogemeter is an essential tool used to figure out the concentration of water vapor in the air. Unfortunately, water vapor absorbs several frequencies of light in the infrared range and most of these bands overlap that of the trace gases. Without accounting for water vapor, the Infrared gas analyzer would give false data. To solve this problem, an accurate water vapor measurement is needed. Solid state hygrometers are designed to have two metal plates separated by a small air gap. Differing levels of humidity in the air change the capacitance of the air gap. This can be measured by applying a high frequency AC voltage to the plates and measuring the capacitance through an RC circuit.
5. FluxNet Sites
5.1. Yatir Forest, Israel
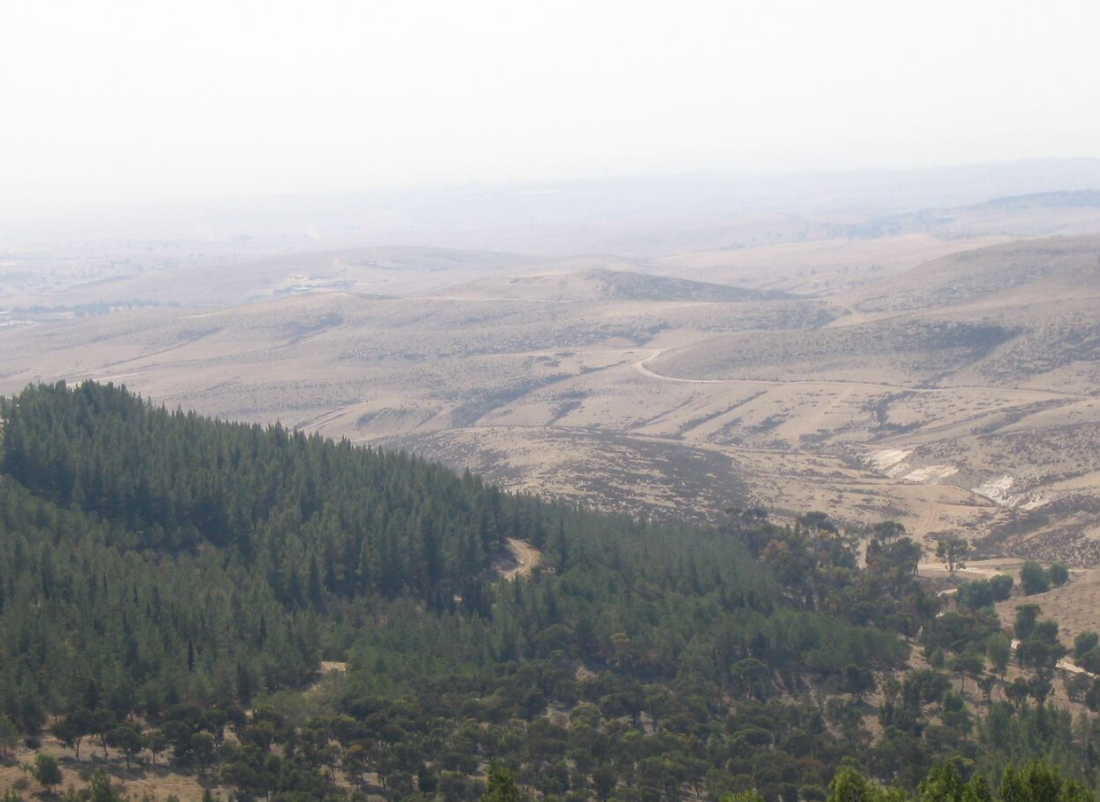
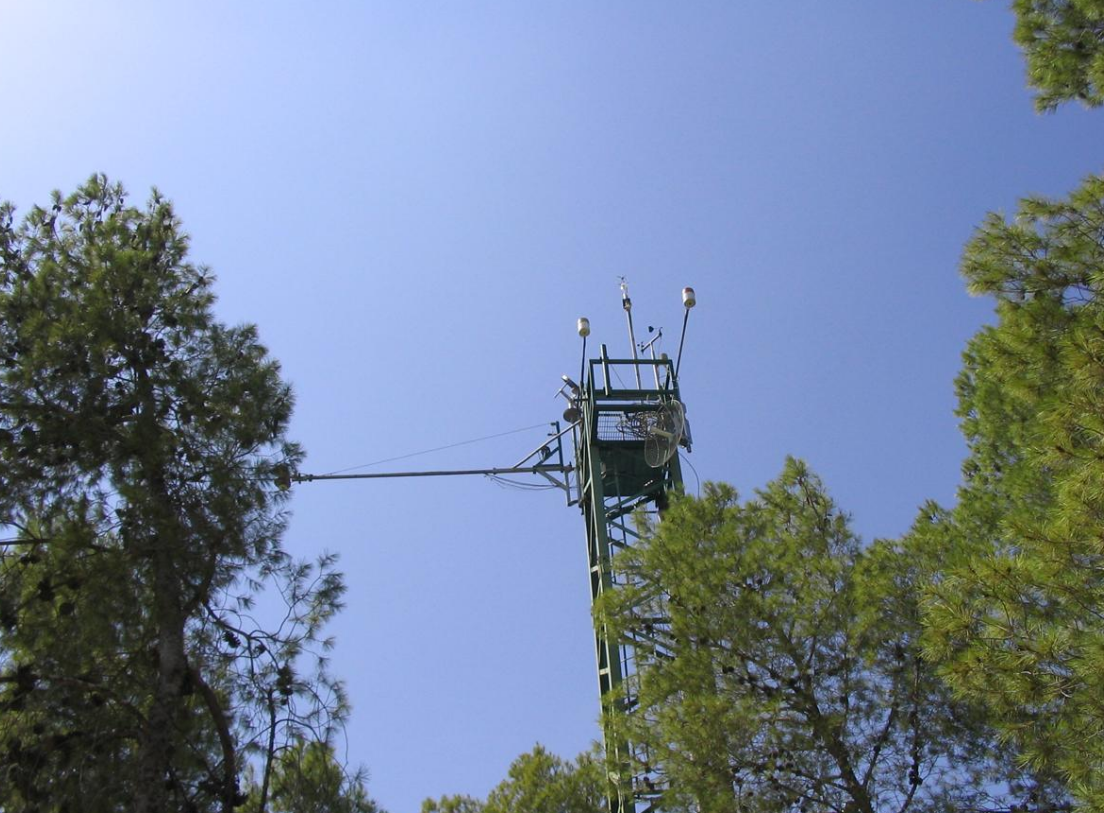
The state of Israel is afforesting the Negev desert, which accounts for 60% of the country's land mass but remains sparsely populated.[7] The Yatir Forest is located on the southern slopes of Mount Hebron, on the edge of the Negev Desert. Covering an area of 30,000 dunams (30 square kilometers), it is the largest planted forest in Israel.[8] It is named after the ancient Levite city within its territory, Yatir, as written in the Torah[9][10] The Yatir forest is a tower site of NASAs research project FluxNet. There is a multitude of modern Israeli scientific research conducted in the Yatir Forest to meet the challenge of climate change, which may result in rapid plant loss and desertification in certain circumstances.[11][12] Studies of the Weizmann Institute of Science, in collaboration with the Desert Research Institute at Sde Boker, have shown that the trees function as a trap for carbon in the air.[13][14] Shade provided by trees planted in the desert also reduces evaporation of the sparse rainfall.[13] Arava Institute for Environmental Studies conducts research at Yatir forest that focuses on crops such as dates and grapes grown in the vicinity of Yatir forest.[15][16] The research is part of a project aimed at introducing new crops into arid and saline zones.[17]
The content is sourced from: https://handwiki.org/wiki/Physics:FluxNet
References
- goals of the Fluxnet project, http://www.fluxnet.ornl.gov/fluxnet/overview.cfm
- Baldocchi, Dennis; Falge, Eva; Gu, Lianhong; Olson, Richard; Hollinger, David; Running, Steve; Anthoni, Peter; Bernhofer, Ch et al. (2001). "FLUXNET: A New Tool to Study the Temporal and Spatial Variability of Ecosystem–Scale Carbon Dioxide, Water Vapor, and Energy Flux Densities". Bulletin of the American Meteorological Society 82 (11): 2415–2434. doi:10.1175/1520-0477(2001)082<2415:FANTTS>2.3.CO;2. ISSN 0003-0007. https://dx.doi.org/10.1175%2F1520-0477%282001%29082%3C2415%3AFANTTS%3E2.3.CO%3B2
- Sellers, P. et al. (1995), "The Boreal Ecosystem–Atmosphere Study (BOREAS): an Overview and Early Results from the 1994 Field …", Bulletin of the American Meteorological Society 76 (9): 1549–1577, doi:10.1175/1520-0477(1995)076<1549:TBESAO>2.0.CO;2, http://ams.allenpress.com/amsonline/?request=get-abstract
- Baldocchi, D.D.; Hincks, B.B.; Meyers, T.P. (1988), "Measuring Biosphere–Atmosphere Exchanges of Biologically Related Gases with Micrometeorological Methods", Ecology 69 (5): 1939–9170, doi:10.2307/1941631 https://dx.doi.org/10.2307%2F1941631
- U.S. Patent 4,031,756 //www.google.com/patents/US4031756
- U.S. Patent 4,914,719 //www.google.com/patents/US4914719
- Professor Alon Tal, The Mitrani Department of Desert Ecology, The Blaustein Institutes for Desert Research, Ben Gurion University of the Negev."NATIONAL REPORT OF ISRAEL, Years 2003-2005, TO THE UNITED NATIONS CONVENTION TO COMBAT DESERTIFICATION (UNCCD)" ; State of Israel, July 2006 http://www.unccd.int/cop/reports/otheraffected/national/2006/israel-eng.pdf
- Planting of Yatir Forest http://fr.jpost.com/servlet/Satellite?cid=1258489197018&pagename=JPost/JPArticle/ShowFull
- "And unto the children of Aaron the priest they gave Hebron with its suburbs, the city of refuge for the manslayer, and Libnah with its suburbs, and Jattir with its suburbs, and Eshtemoa with its suburbs" (Book of Joshua 21:13-14). Located within the Yatir forest now is an ancient Palestinian synagogue, the Anim synagogue (4th–7th centuries CE).
- "". http://fr.jpost.com/servlet/Satellite?pagename=JPost%2FJPArticle%2FShowFull&cid=1176152801104.
- Sahney, S., Benton, M.J. & Falcon-Lang, H.J. (2010), "Rainforest collapse triggered Pennsylvanian tetrapod diversification in Euramerica" (PDF), Geology 38 (12): 1079–1082, doi:10.1130/G31182.1, http://geology.geoscienceworld.org/cgi/content/abstract/38/12/1079.
- Bachelet, D; R.Neilson, J.M.Lenihan, R.J.Drapek (2001), "Climate Change Effects on Vegetation Distribution and Carbon Budget in the United States" (PDF), Ecosystems 4 (3): 164–185, doi:10.1007/s10021-001-0002-7, http://www.usgcrp.gov/usgcrp/Library/nationalassessment/forests/Ecosystems2%20Bachelet.pdf.
- Benefits of planting trees in the desert, Haaretz http://www.haaretz.com/hasen/spages/1131595.html
- KKL-JNF cooperating on afforestation at Yatir forest http://www.kkl.org.il/kkl/english/main_subject/forest_and_places/kkl%20afforestation%20work.htm
- Vu du Ciel-documentary by Yann Arthus-Bertrand http://programmes.france2.fr/vu-du-ciel/accueil.htm
- 2000 year old seed grows in the arava http://www.watsonblogs.org/meef/subjects/plants/
- MERC Project M-20-0-18 project http://www.desertagriculture.org/index.html