1. Introduction
The development of optical technologies and the corresponding component base has led to significant progress in methods and means for the instantaneous frequency measurement (IFM) of microwave signals based on photonic technology, which was previously carried out using the classical electronic component base
[1]. Electronic instantaneous frequency measurement devices are now widely used in both military and civilian areas, for example, in electronic warfare systems, assessment of the electromagnetic environment for device compatibility, etc. However, their use is limited to frequency ranges up to approximately 20 GHz due to the limitations of electronic circuits
[2]. The use of photonic systems allowed for significant expansion of the measurement frequency range, accuracy and resolution of the receivers
[3]. For example, the use of a parallel link based on stimulated Brillouin scattering (SBS) allows for measurement in a range from 0.5 to 28 GHz with a measurement error of 20 MHz
[4].
Instantaneous frequency measurement of single or multiple signals involves measurement of the frequency and amplitude of the laser radiation modulated by the received microwave signal. One of the most commonly used principles for the instantaneous frequency determination of a microwave signal is frequency–amplitude discrimination of the resonance type, which involves passing the measured frequency components of the signal through a dispersion medium
[5][6][7][8]. The previously measured frequency components change their amplitude depending on the frequency response of the dispersion medium. Information regarding the frequency response of the dispersion medium allows for evaluation of the change in the amplitude of the measured frequency components, depending on the frequency response in the dispersion medium of the measured component, and makes it possible to build the so-called amplitude comparison function (ACF)
[9][10][11].
In recent years, a fairly large number of researches have been published in which existing methods, means and implementations were observed. However, these researches considered only general issues related to the application of photonics in microwave measurements
[12][13], reviewed implementation methods based on frequency-to-amplitude, frequency-to-time and frequency-to-space conversions, and covered only general issues related to the principles of operation and implementation of certain solutions without conducting a comparative analysis of technical implementation that could indicate the performance requirements of described systems
[14][15]. The researches did not discuss selective amplitude type discriminators, which leads to a need to review systems based on such discriminators and prepare a comparative analysis of their implementation methods and achieved characteristics as well as ways to improve the metrological performance of the considered systems.
Earlier works on photonic IFM, establishing the methods that were applied in the development of methods and means of IFM based on frequency and amplitude discriminators of resonance type, were based on the optical power measurement of a laser carrier signal modulated by a microwave signal
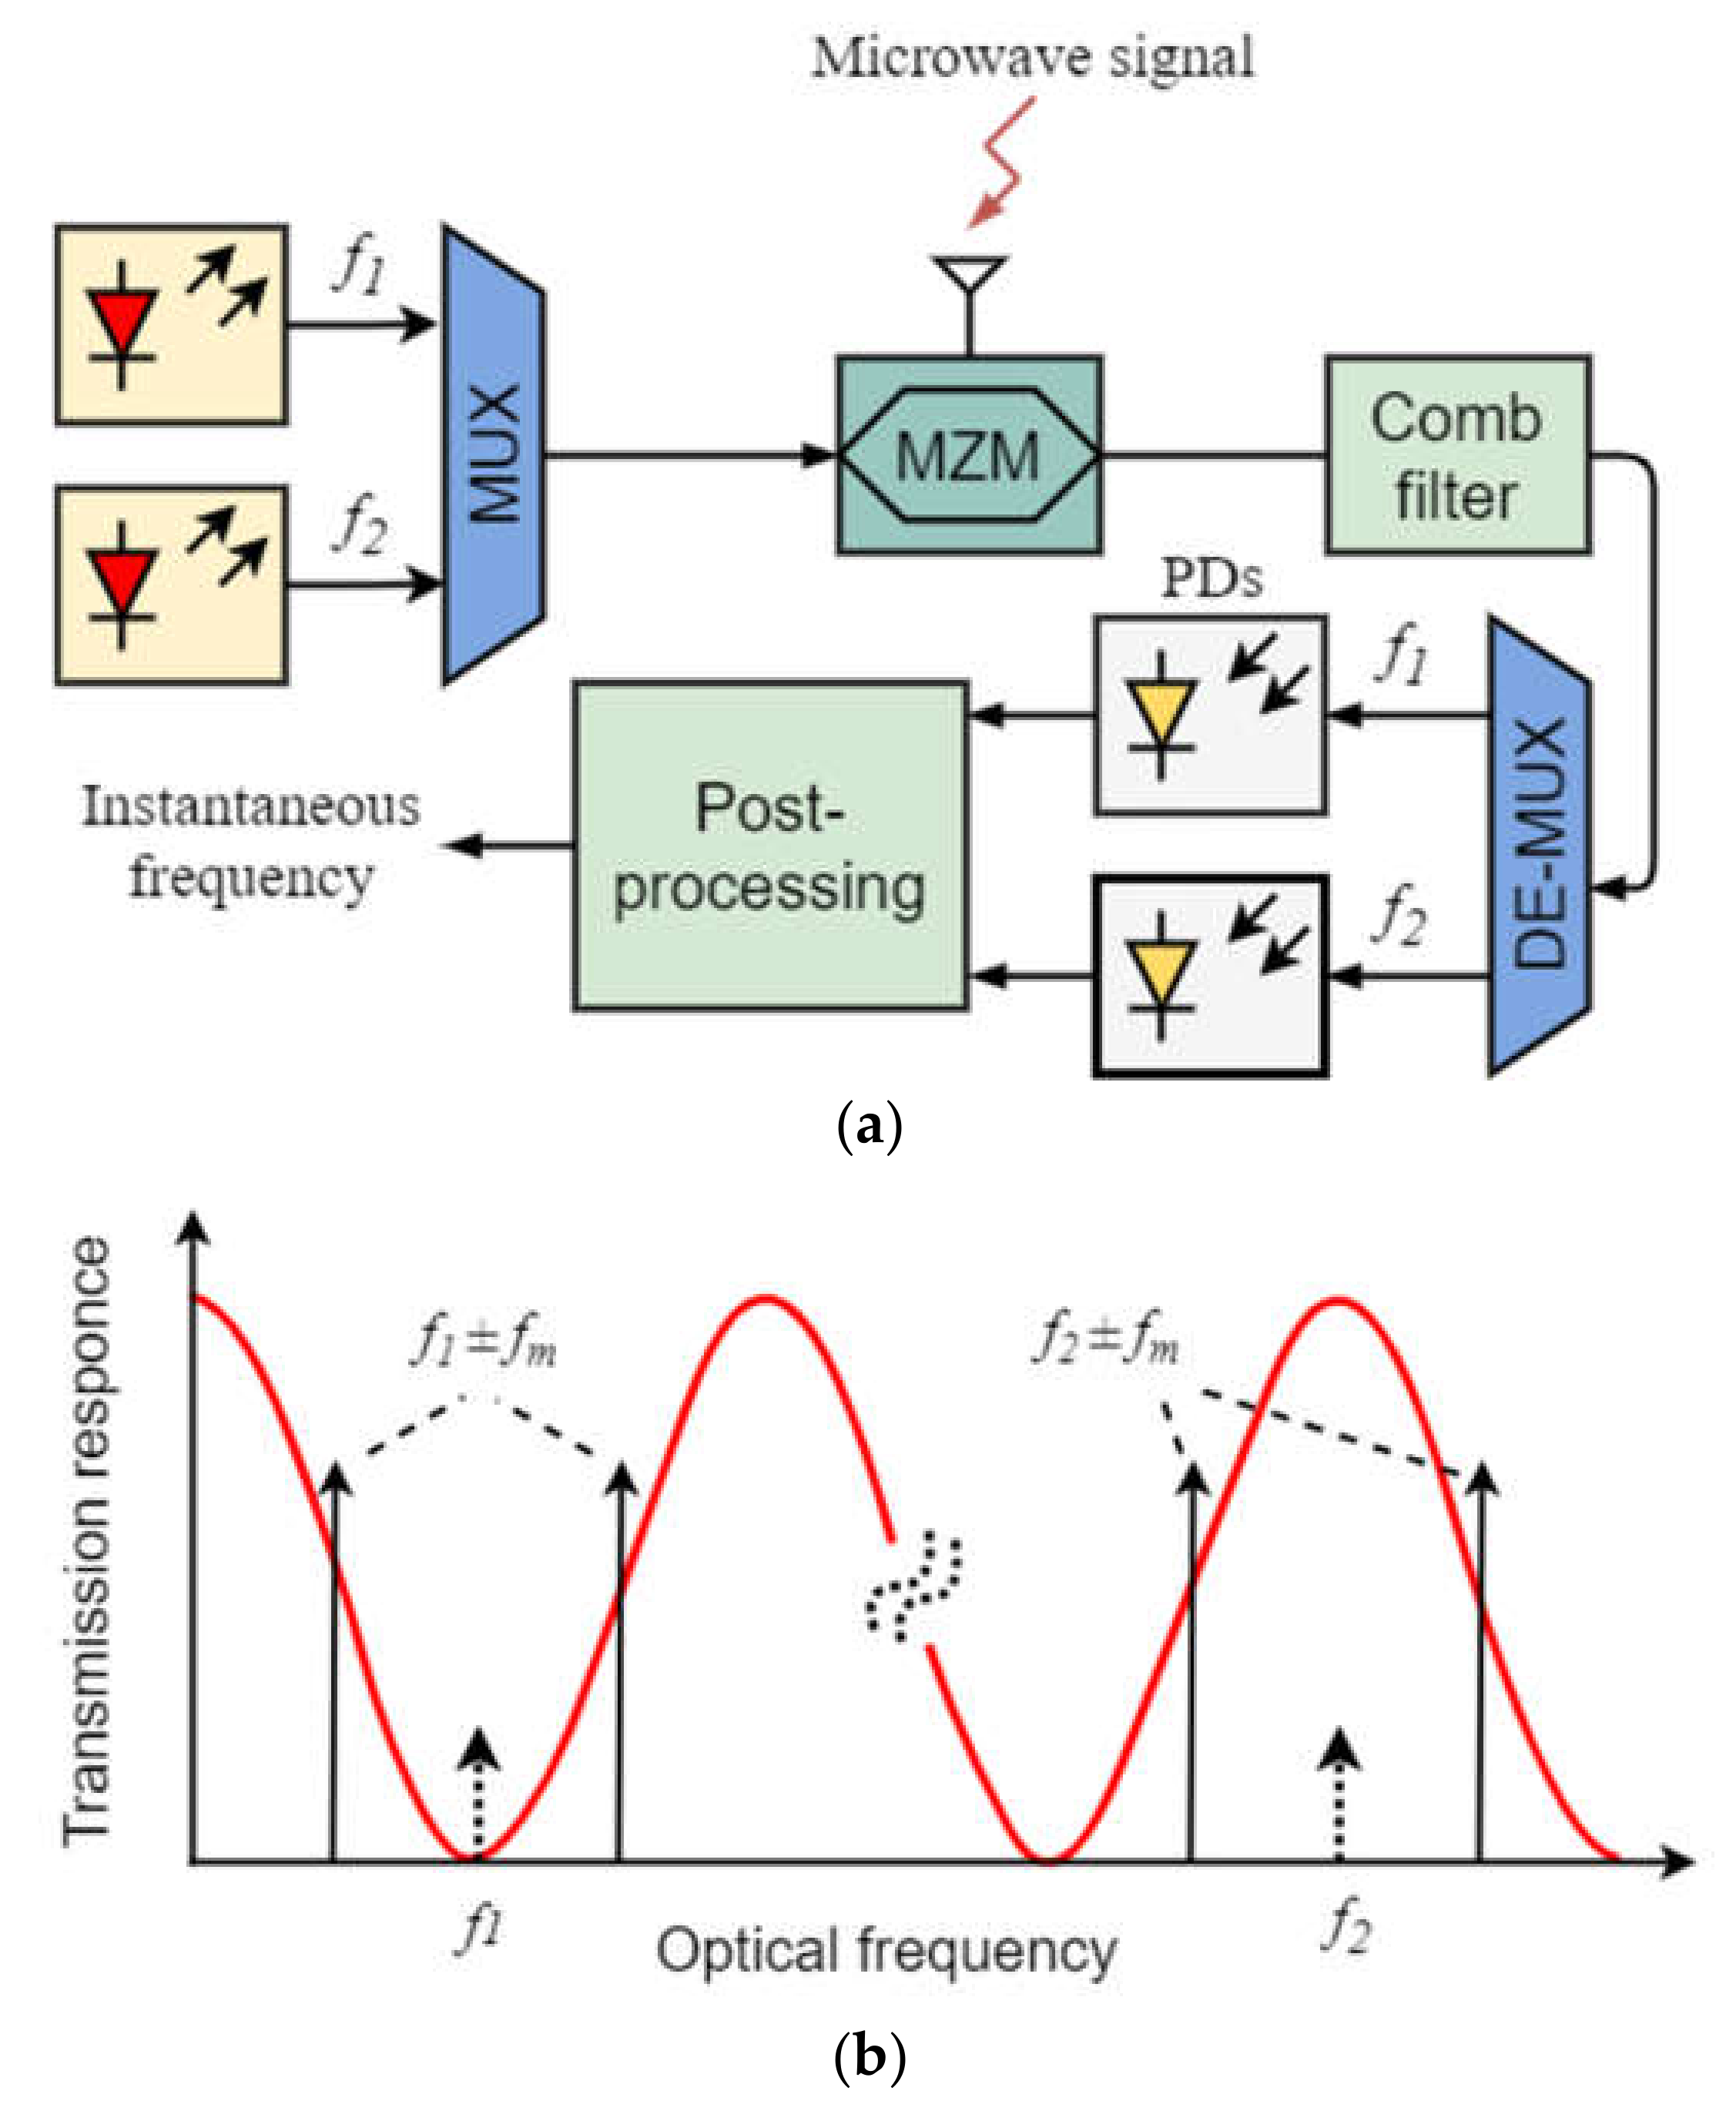
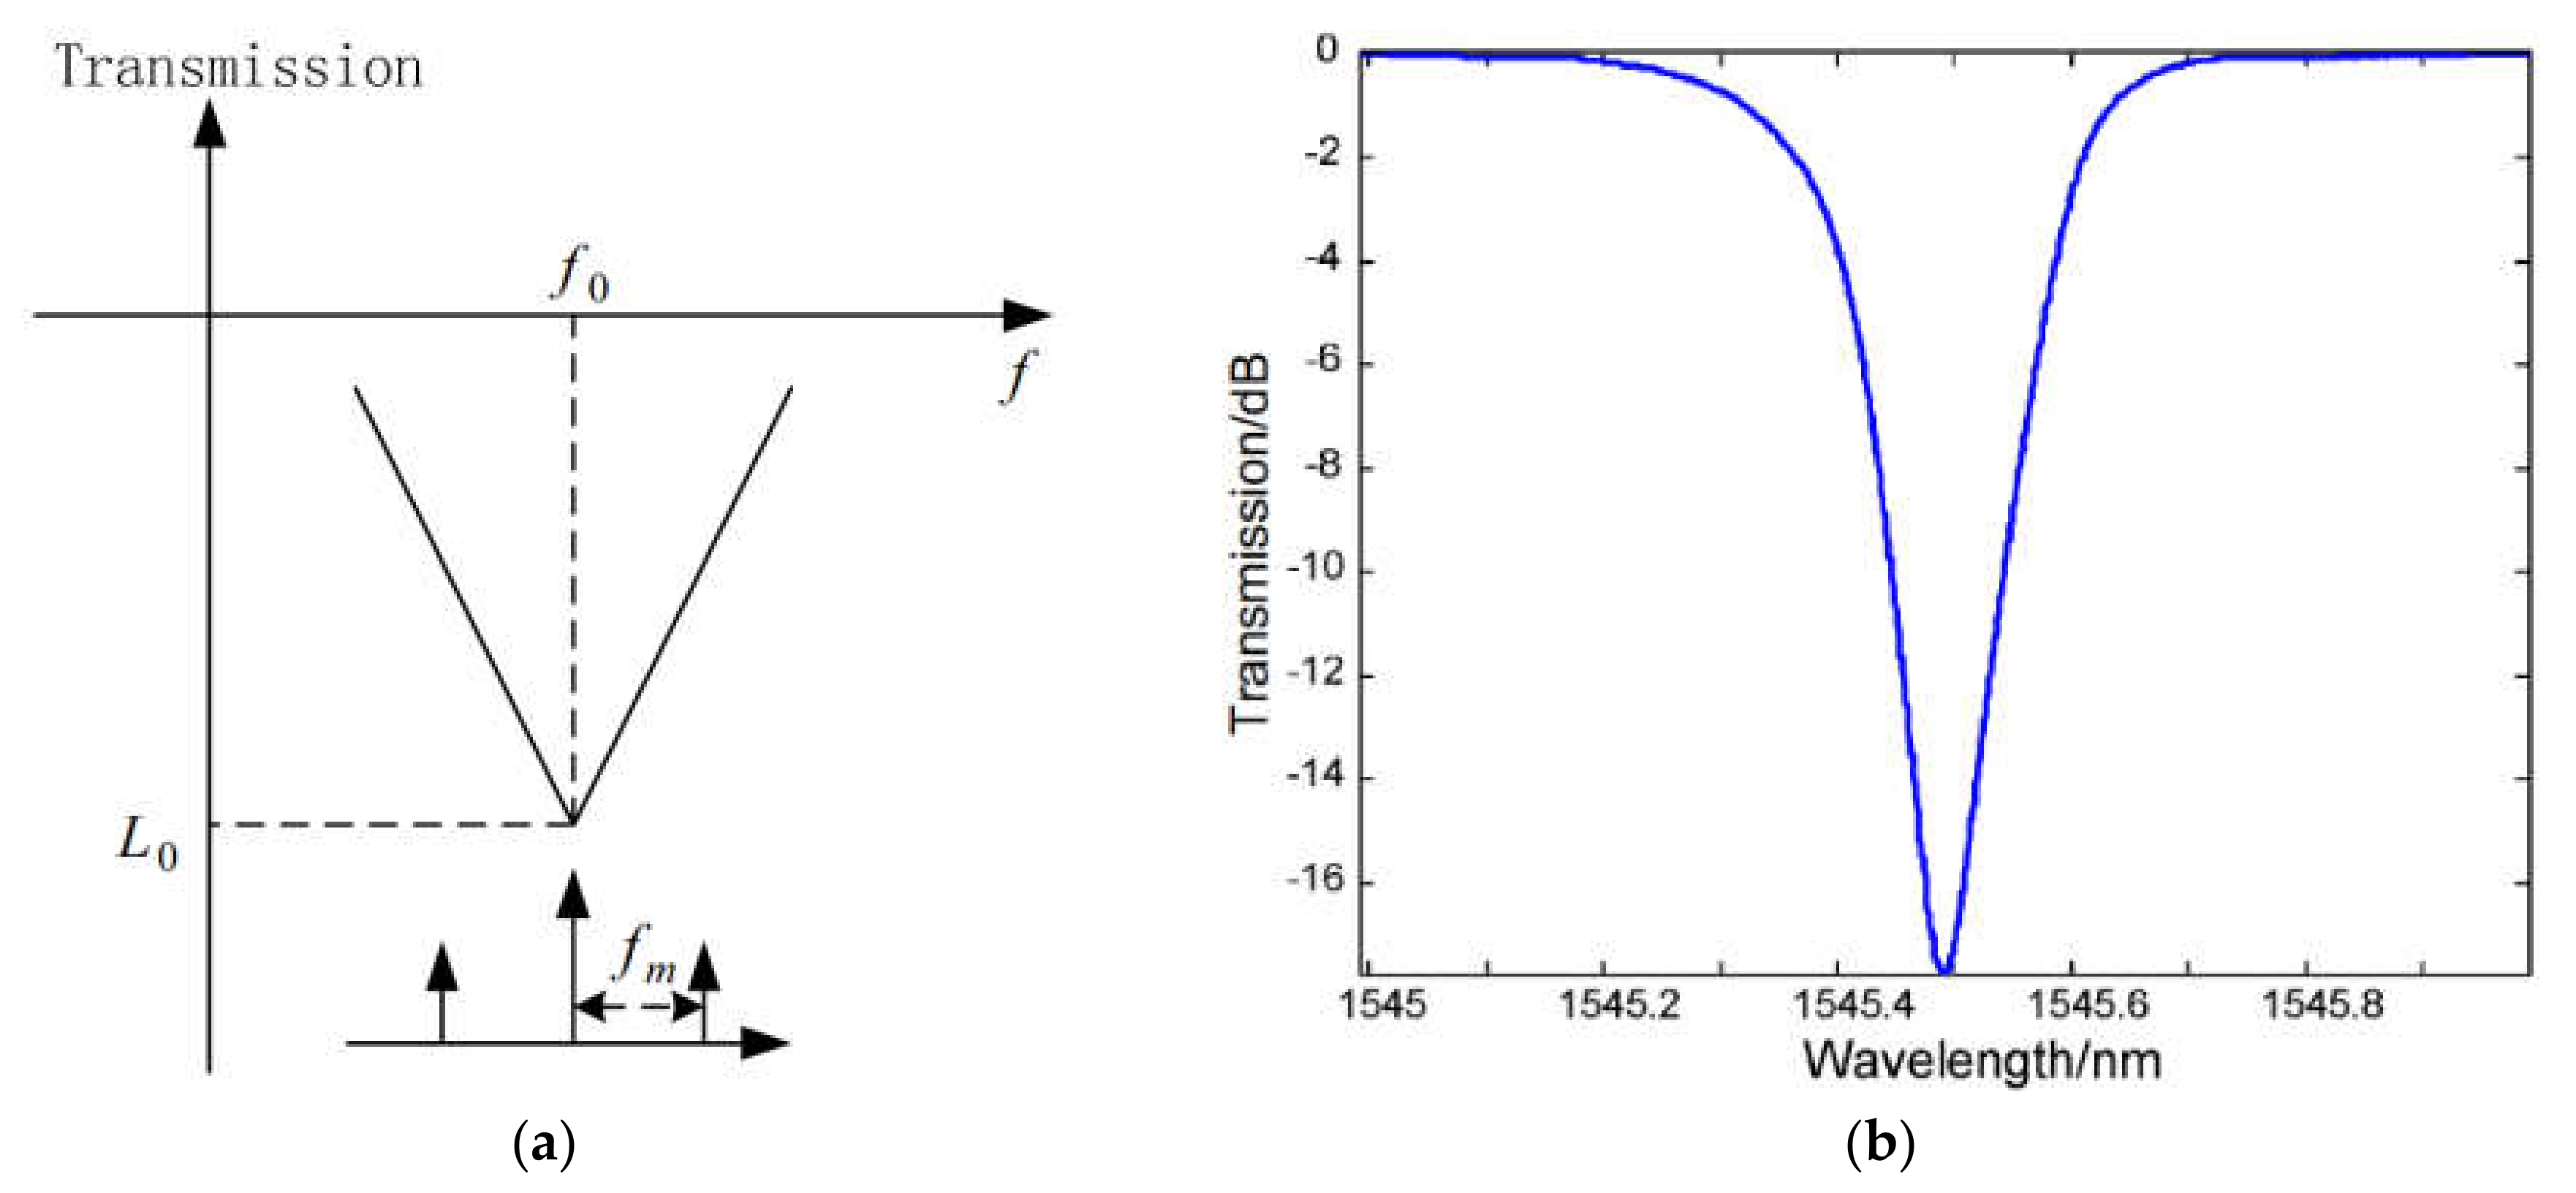
[16][17][18][19][20][21]. The idea behind this method is to use two laser sources with different wavelengths from each other and an optical filter with a sinusoidal spectral response (for example, a Sagnac loop filter (SLF)) and apply modulated laser radiation from both laser sources. An MZM (Mach–Zehnder modulator) operating in carrier suppressed double sideband mode (CS-DSB) was used as an electro-optical modulator, and the two two-frequency signals generated at its output were fed to an optical filter in such a way that the carrier frequency of the first laser was tuned to the peak of the spectral response of the sinusoidal filter and the carrier frequency of the second laser to the middle of its base, so that the harmonic amplitudes of the two-frequency signals changed depending on the spectral response of the filter. At the output of the optical filter, the signals were demultiplexed to isolate the desired pair of harmonics of the two-frequency signal and fed to the corresponding photodetector of the demultiplexer channel, at the output of which the beat signal power was measured and an amplitude comparison function was built, where each measured frequency had its own power value.
A block diagram of an IFM method based on optical power monitoring is shown in Figure 1a and the principle of measurement based on an optical filter with a sinusoidal spectral response is shown in Figure 1b.
Figure 1. Schematic IFM method with optical power monitoring on an optical filter: (
a) Schematic diagram; (
b) operation principle. MUX—Multiplexor; MZM—Mach–Zehnder modulator; DE-MUX—Demultiplexor; PD—Photodiode (adapted from
[16]).
The use of two photodetectors makes it possible to reduce the influence of power fluctuations and instability in the laser radiation source, although it requires the same characteristics in the photodetectors. In
[16], the measured frequency range was 0–25 GHz, and the measurement error was ±0.2 GHz.
Further improvement to this method was made by using a pair of optical filters with a single laser source
[17][18]. This implementation made it possible to simplify the structure of the IFM system, reduce the measurement error, and improve the low-frequency measurement accuracy in the range near the top and bottom of the filter’s spectral response. Alternative implementation methods have been demonstrated, for example, based on two cascaded MZMs and a tunable delay line
[19], a polarization-domain interferometer
[20] or two quadrature optical filters
[21].
It should be noted that conducting a complete and comprehensive review of principles of measurement and existing and promising methods and means implemented on their basis, with an analysis of system performance conditions, achieved technical characteristics and ways to improve, is a very difficult task that would require a lot of time for analysis, processing and writing a report, and such a report would require constant supplementation based on new research and publications.
The first work on the development of a fully photonics-based coherent radar system was presented in 2014 with proposals for further development of the described system in terms of measured frequency range expansion and improved resolution
[22]. The requirements for photonic IFM transmitters and receivers described in
[22] are presented in
Table 1.
Table 1. Performance requirements of a photonics-based radar transceiver (adapted from
[22]).
The key differences between implementation methods lie in the choice of the physical effect and the resonance type discriminator, which are the basis of IFM implementation. According to the measurement method, there are systems based on a fiber Bragg grating (FBG)
[23][24][25][26][27], FBG with a phase shift (PS-FBG)
[28][29][30][31], an optical microring resonator (MRR)
[32][33][34][35][36], stimulated Brillouin scattering (SBS)
[4][37][38][39][40] and Fano resonance
[41].
Due to the extensive list of methods and means for implementing IFM systems based on frequency–amplitude resonance type discriminators, it became necessary to conduct a comprehensive analysis of all the main approaches used to implement photonic receivers, their measurement methods, their advantages and disadvantages and ways of minimizing or eliminating the latter, as well as the achieved characteristics of current technologies.
2. IFM Based on a Fiber Bragg Grating
An FBG-based IFM as a frequency discriminator was proposed in various publications, and is theoretically capable of obtaining a wide frequency range with an accuracy of tens of MHz. For example, in
[25] the achieved accuracy of the simulation model was 80 kHz with a frequency range from 0 to 10 GHz. IFM devices based on FBGs have a fairly wide frequency band
[42][43], which is usually limited by the bandwidth of the photodetector and the cutoff frequency of the electro-optical modulator used, which, based on the requirements, should reach approximately 40 GHz for IFM applications. One of the key problems in such systems affecting the measurement accuracy, apart from possible issues associated with the central wavelength of the laser and the FBG shift, the operating point shift in the electro-optical modulators, and incomplete suppression of higher-order harmonics after modulation, is the presence of monotonic areas in the central region of the wavelength of the FBG in the frequency band of ±0.3 GHz from the Bragg wavelength and the presence of non-linear areas at the borders of the FBG, both of which complicate the construction of a linear ACF.
Possible hardware problems in the form of shifts in the central wavelength of the laser and FBG, drift of the operating point of the electro-optical modulators, and incomplete suppression of higher-order harmonics after modulation were not overlooked by researchers; to solve them, several methods were proposed to minimize their influence or completely eliminate them
[44][45][46].
2.1. Principles of Operation
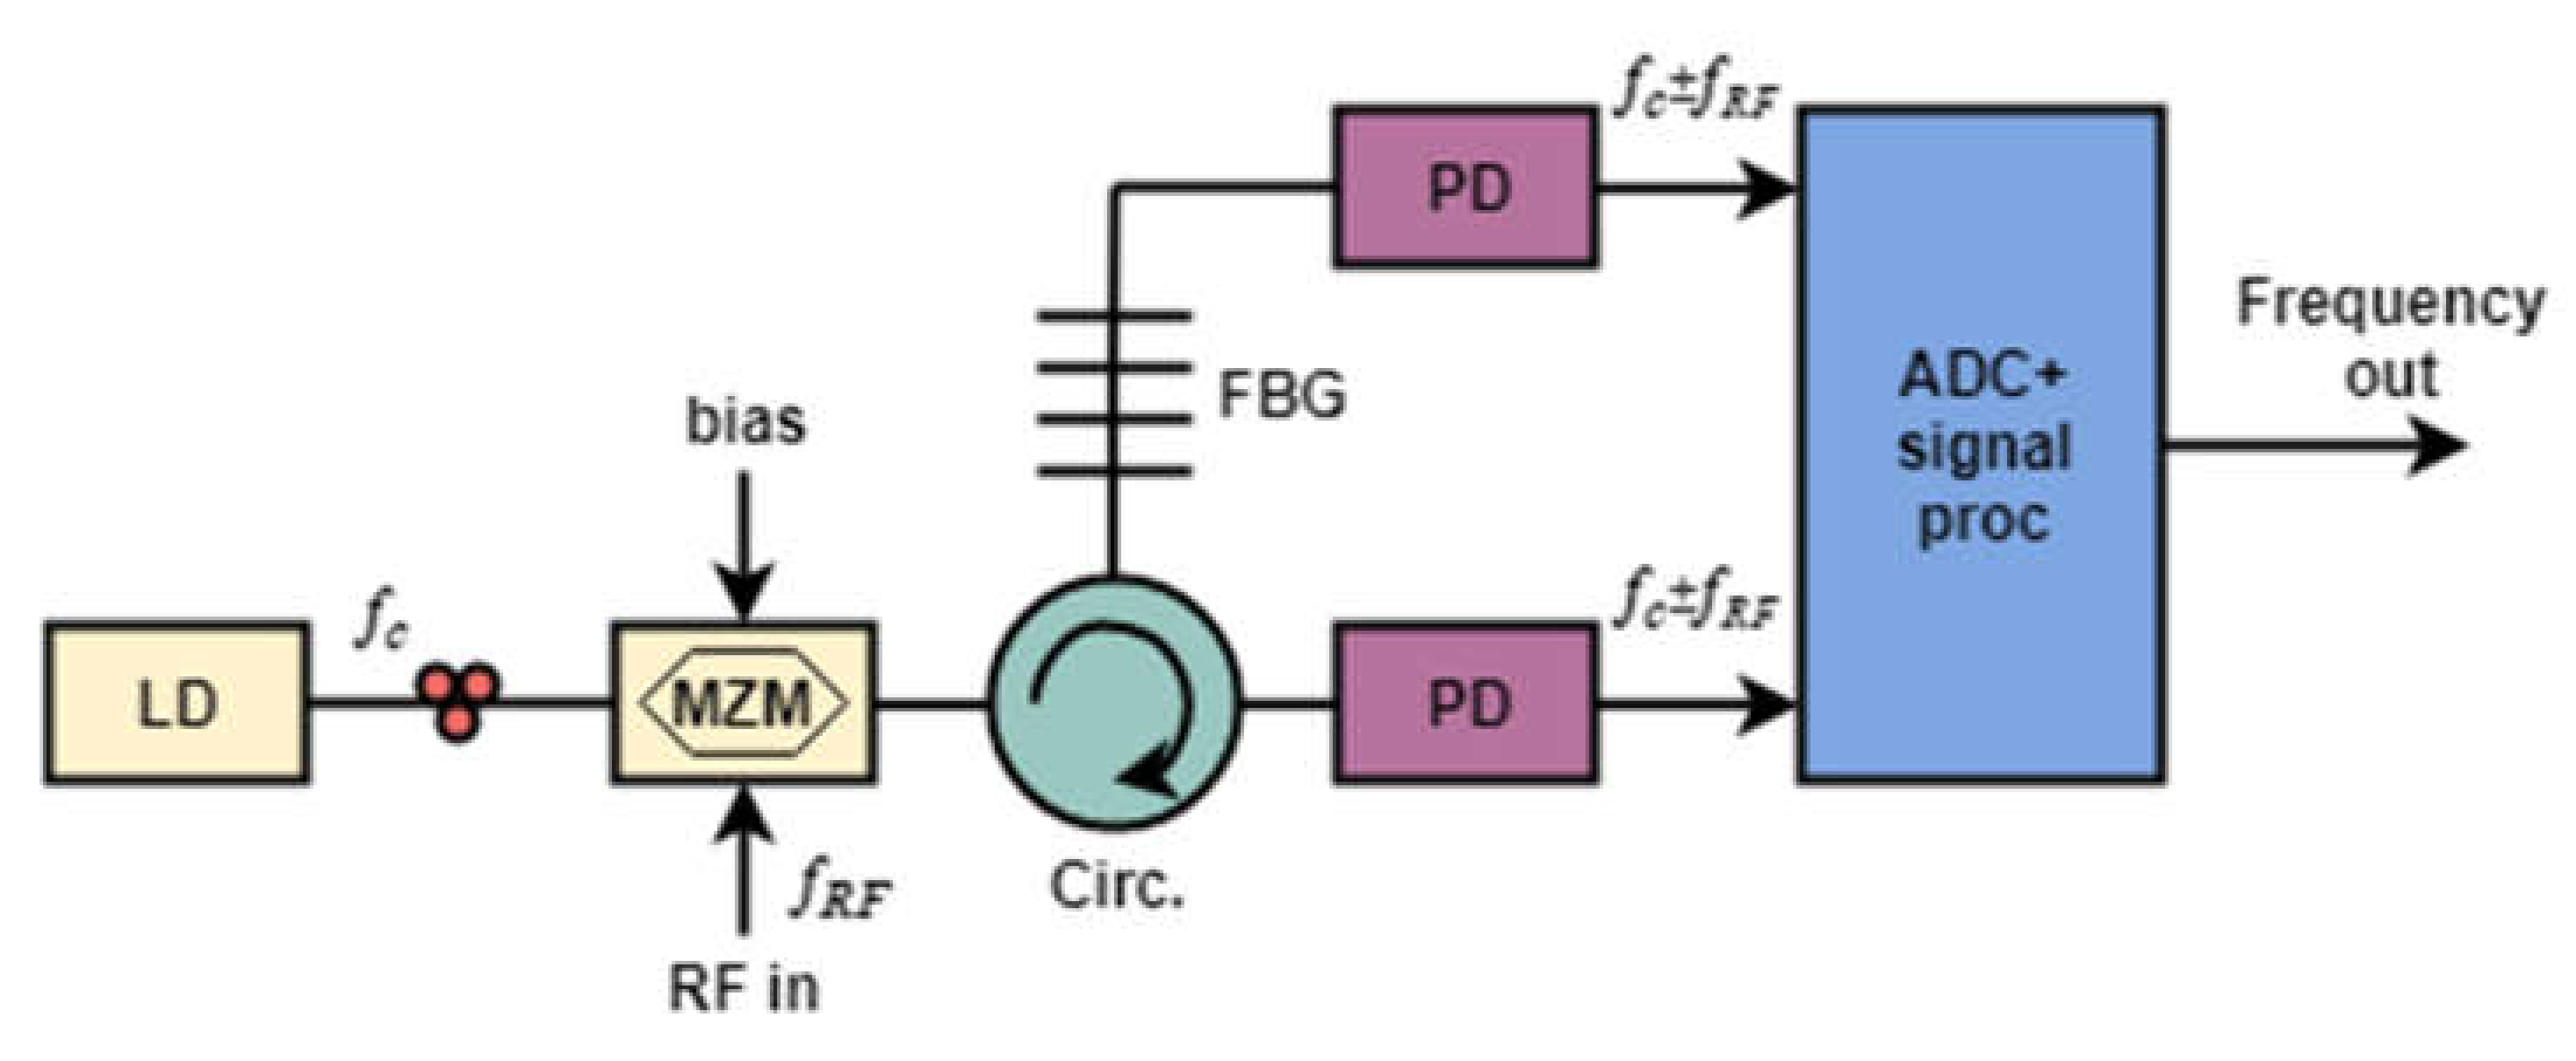
The principles of operation for an IFM device based on an FBG are shown in
Figure 2 in the form of a generalized block diagram
[25].
Figure 2. Schematic diagram of an IFM system based on a fiber Bragg grating for microwave frequency measurement. LD—Laser diode; MZM—Mach–Zehnder modulator; Circ.—Circulator; FBG—Fiber Bragg grating; PD—Photodiode (adapted from
[25]).
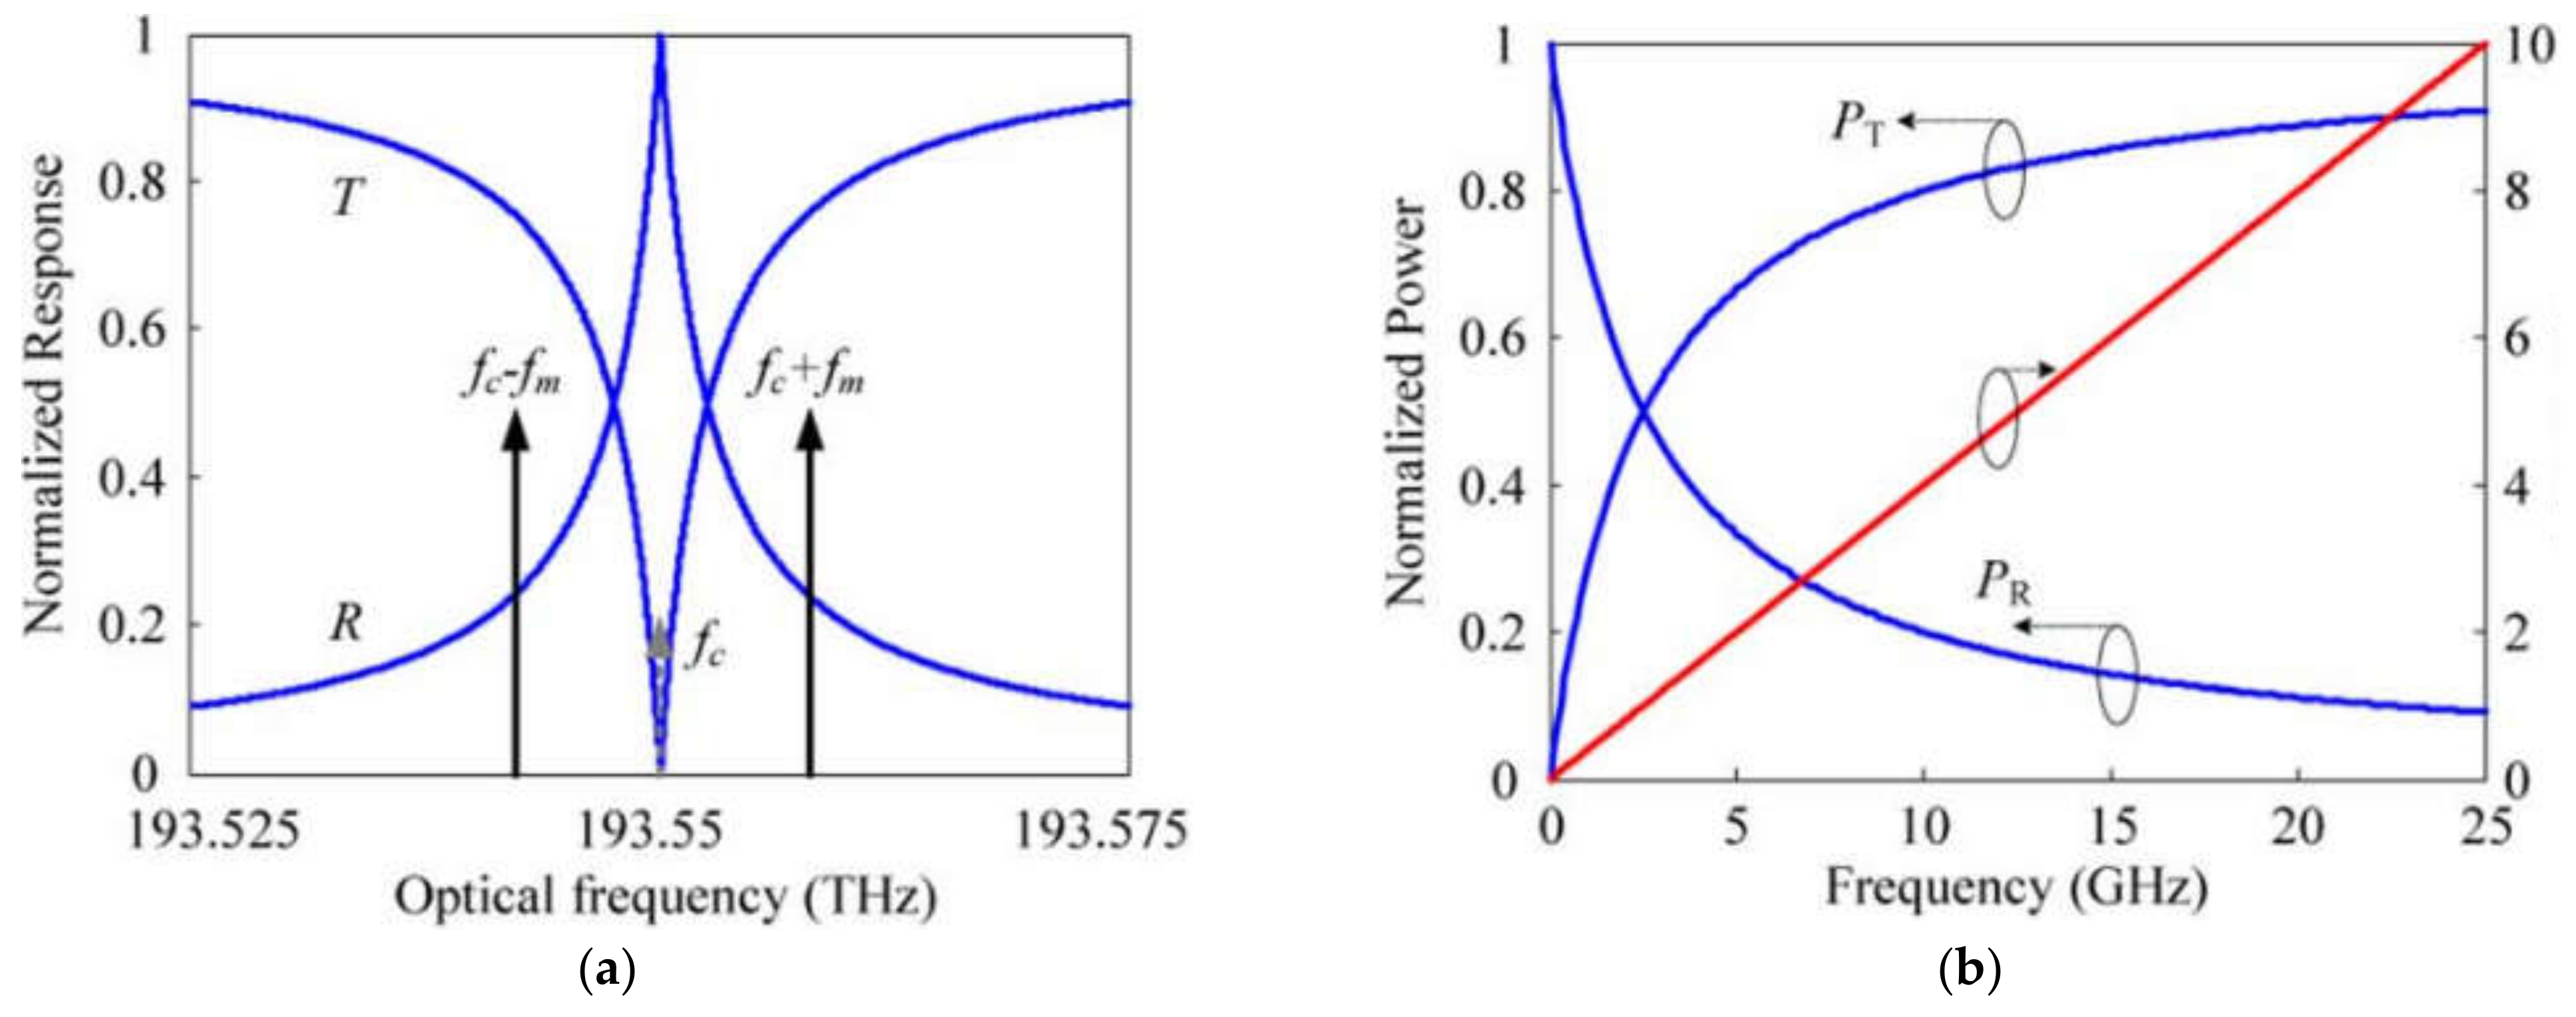
Single-frequency laser radiation passes to an electro-optical Mach–Zehnder modulator (MZM), where the laser radiation is modulated by a measured microwave signal that enters the RF port of the modulator. The MZM operates at the zero operating point to suppress the optical carrier; therefore, the output spectrum of the signal consists of two-frequency radiation with the carrier suppressed, the harmonics of which are equidistant from the carrier by a frequency equal to the frequency of the modulating microwave signal. The modulated two-frequency signal passes through the circulator to the FBG, where the signals transmitted and reflected from the FBG are formed (
Figure 3a)
[25].
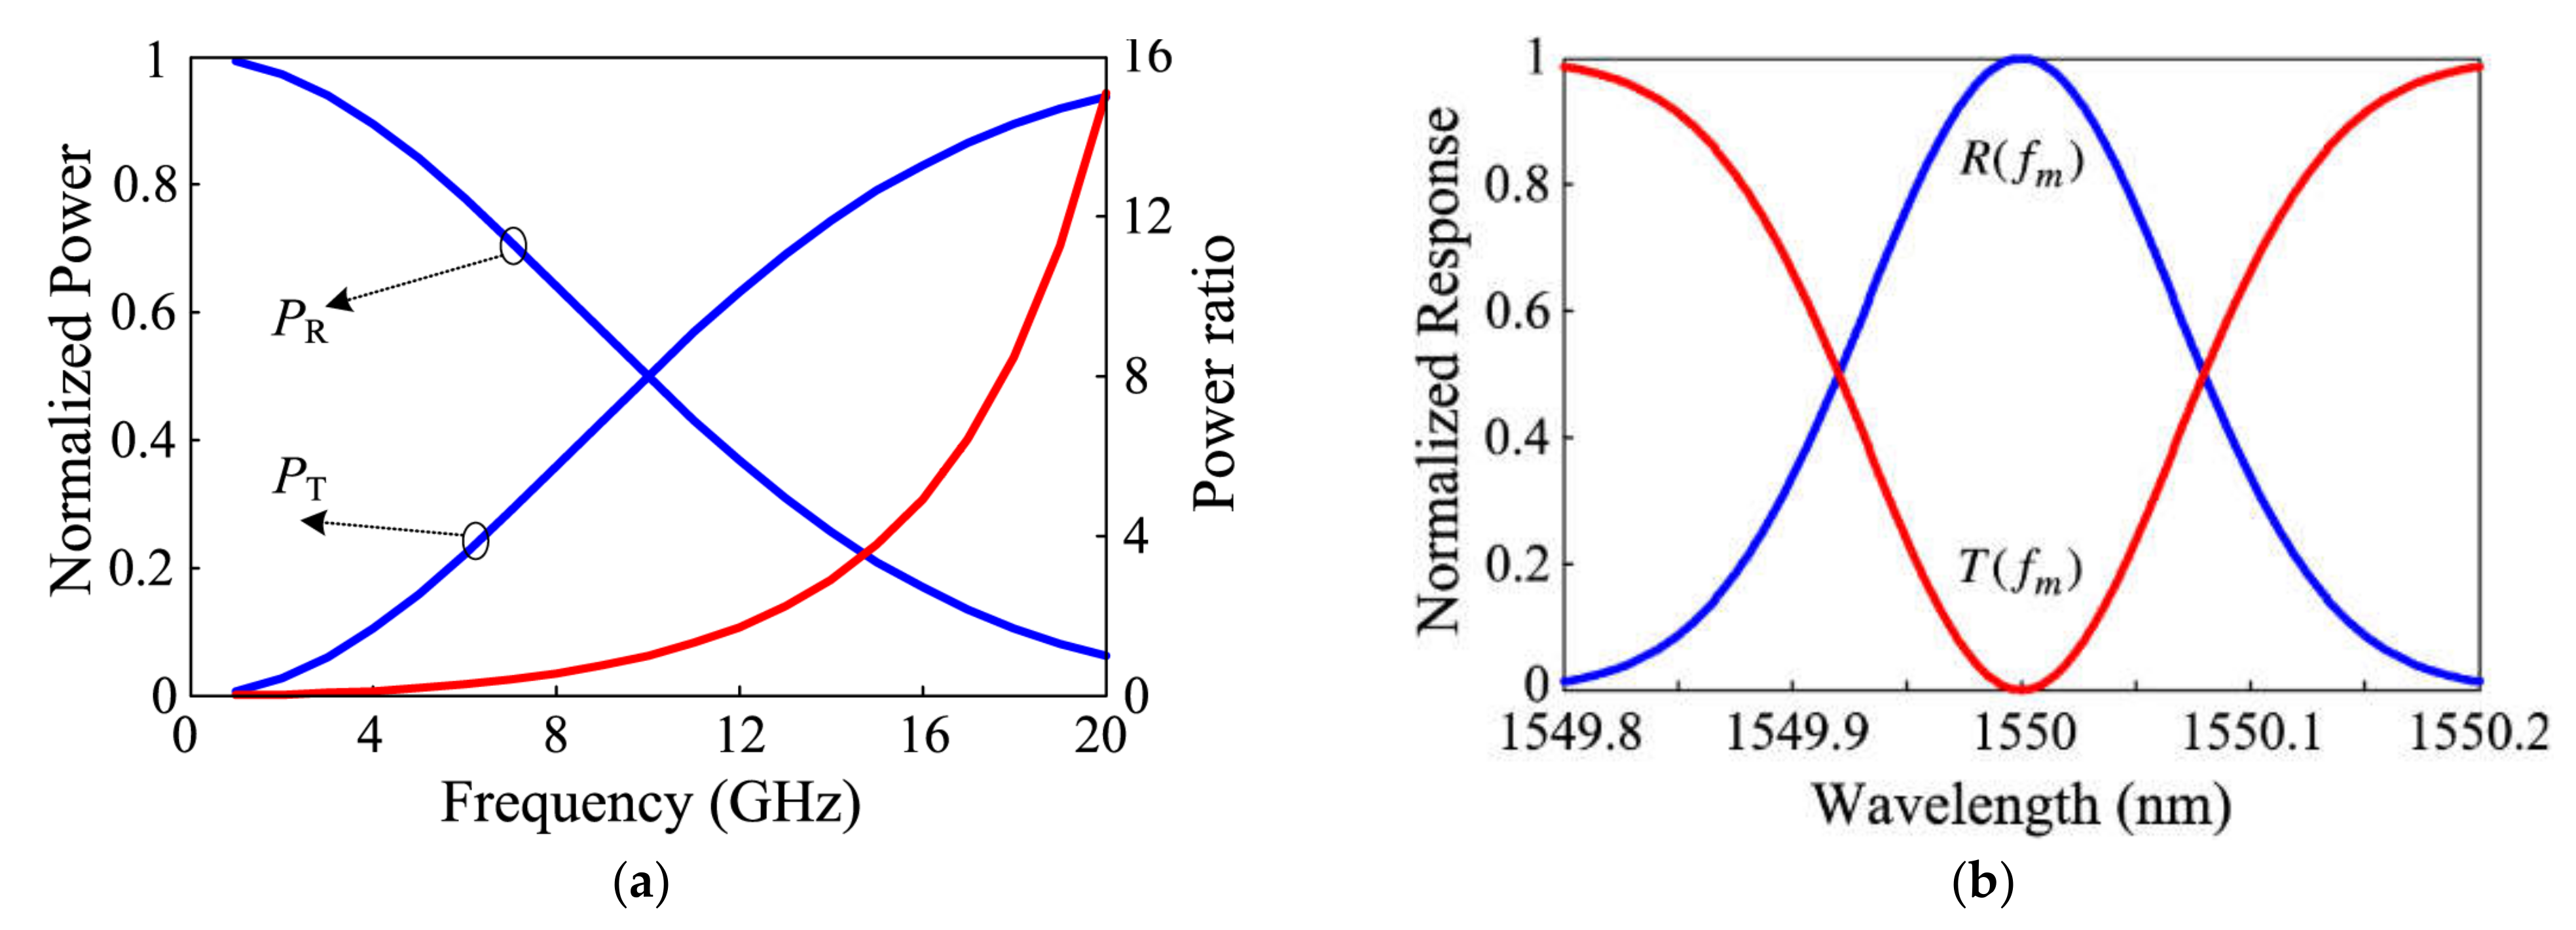
Figure 3. Simulation results of a Gaussian-shaped FBG example: (
a) Dependence of the detected optical power and power ratio on the input microwave frequency; (
b) Normalized frequency response of the FBG
[25].
The wavelength of the laser radiation is adjusted in such a way as to correspond to the Bragg wavelength of the FBG; as a result, the two-frequency signal falls on the slopes of the FBG, where a multiplicative change in the amplitudes of the signal harmonics occurs depending on the frequency response of the FBG (
Figure 3b)
[25]. The two-frequency signals transmitted and reflected from the FBG pass to the corresponding photodetectors of each channel, where a beat signal is formed, containing the magnitude of the constant component and the frequency of the signal to be measured. The power of the signal from the photodetector outputs will be proportional to the optical power of the transmitted and reflected signals from the FBG. In the processing unit, their power values are digitized and measured, and then the ratio of these values is taken to construct an amplitude comparison function, which makes it possible to unambiguously determine the value of the measured frequency (
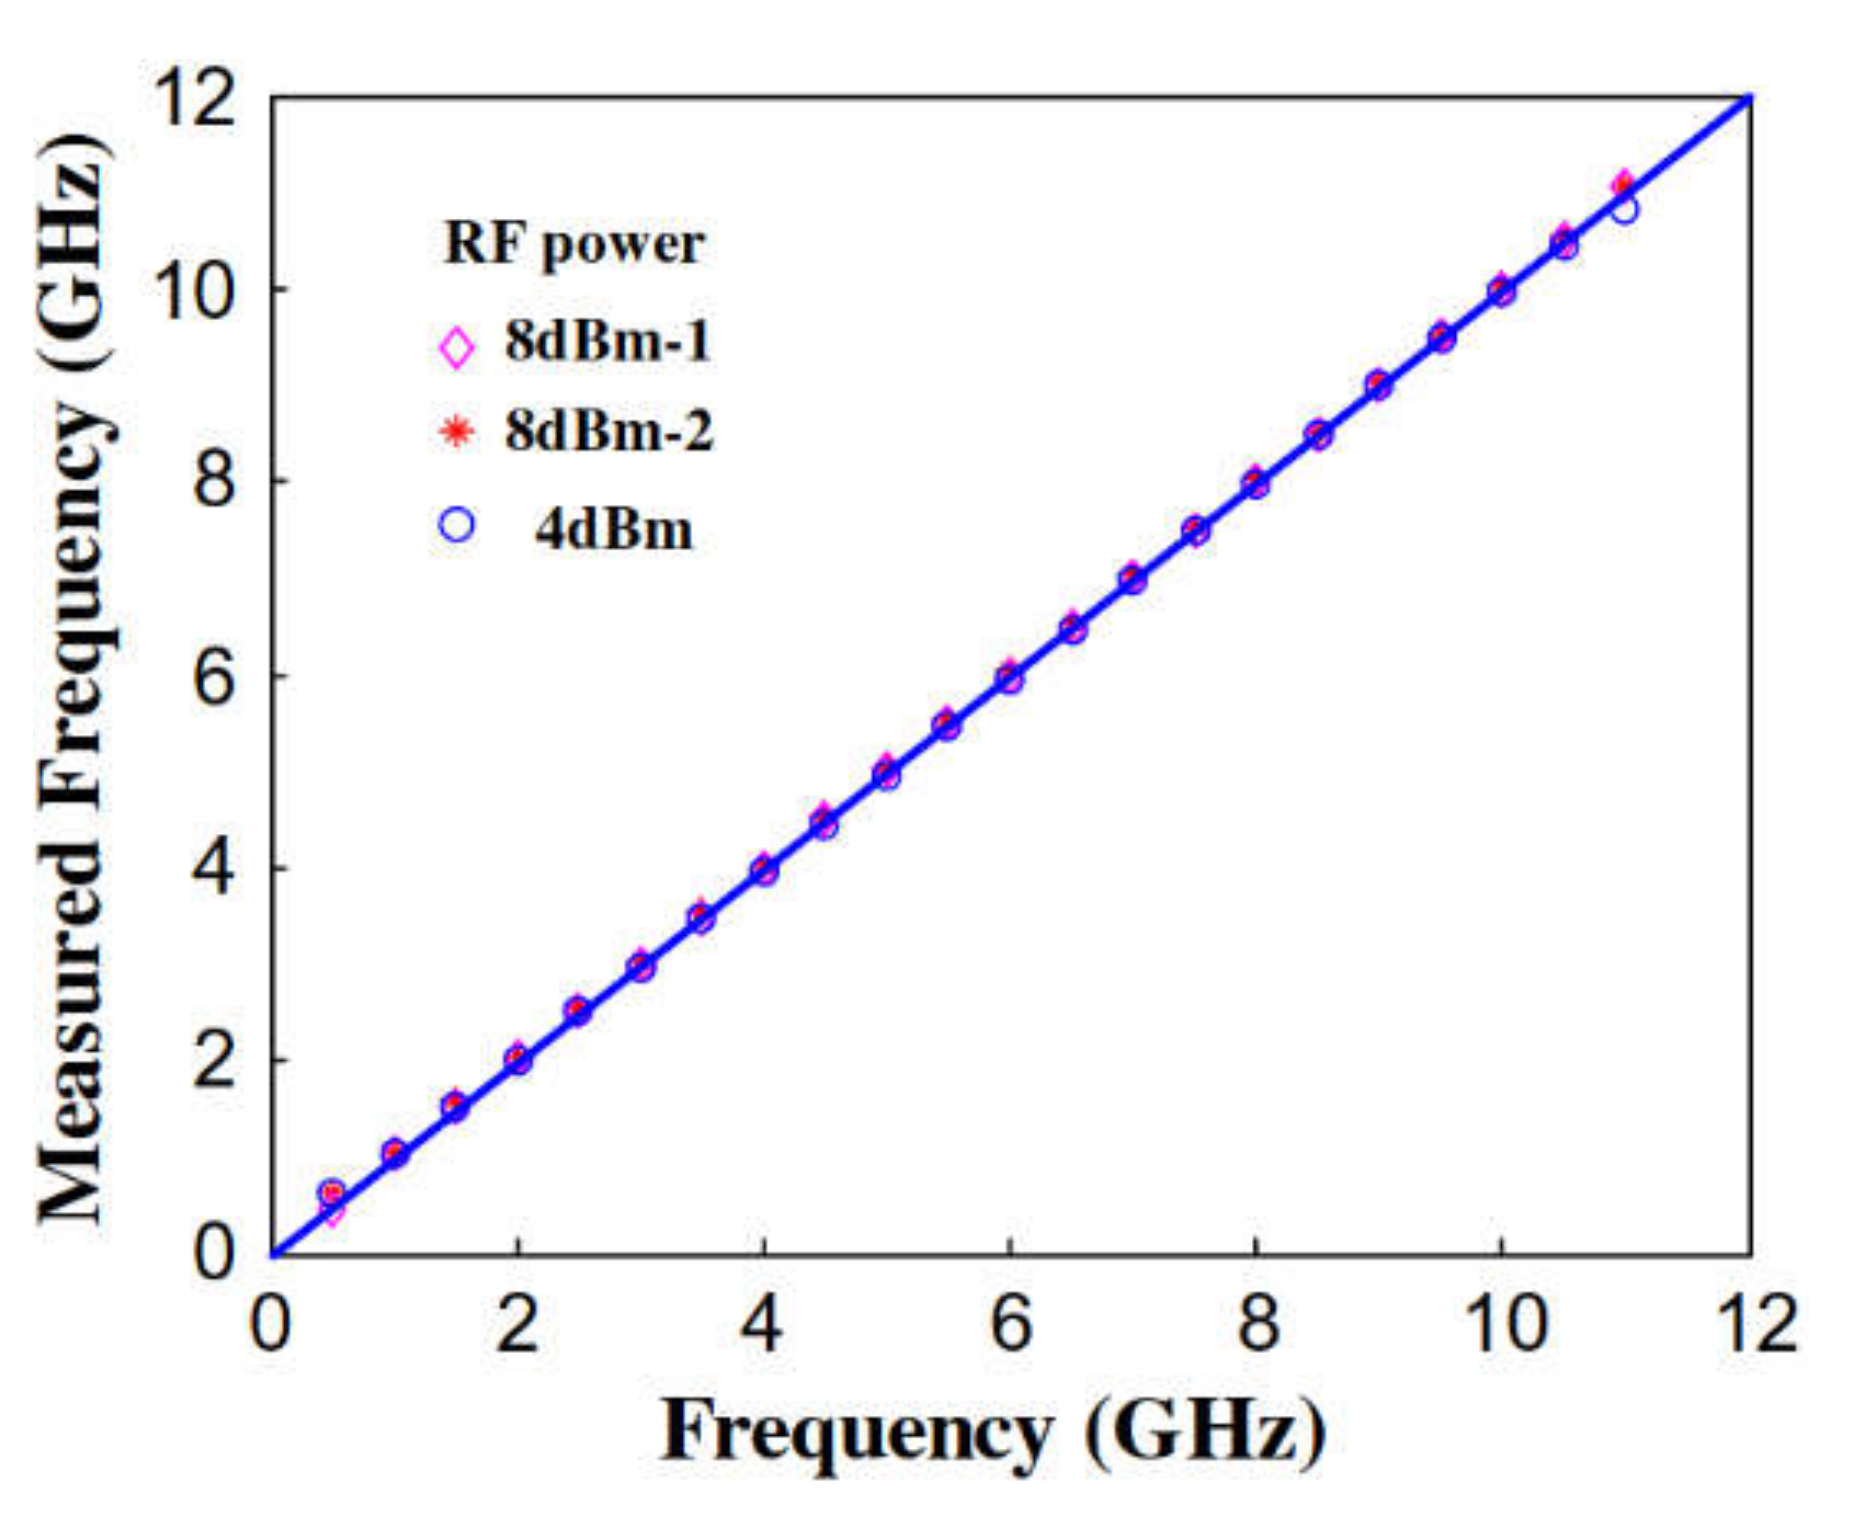
Figure 4).
Figure 4. Estimated frequency based on measured power ratio function
[25].
In earlier works dedicated to IFM based on FBGs, the ACF was constructed by taking the ratio of the transmission or reflection channel power to the laser radiation power; however, this method of implementation had its drawbacks in the form of a dependence of the measured power on the power of the laser and microwave signals, which led to additional measurement errors, due to fluctuations in their power. In the implementation method described above with the transmission and reflection channels, this disadvantage is eliminated.
2.2. Analysis of the Causes of Measurement Errors and Improvement in Measurement Accuracy
Analysis of publications on IFM based on FBG made it possible to identify and analyze the main causes of measurement errors. These include instability in the laser wavelength, shifts in the modulator operating points leading to a change in the operating mode, a shift in the FBG’s central wavelength, and a difference between the photodetectors in the transmission and reflection channels of the system. Instabilities in the laser wavelength, operating point, and central wavelength of the FBG are related to temperature fluctuations, and the problem of differences in characteristics can be eliminated by switching to solutions using only one photodetector. The spectral characteristics of the laser radiation and FBG have a key influence on measurement accuracy, since shifts in both the laser and the FBG central wavelength lead to a distorted FBG and an incorrect measurement result compared with the ACF. A typical shift in the wavelength of a DFB laser due to the influence of temperature is on the order of 12.5 GHz/°K, or 0.1 nm/°K. Existing methods of temperature stabilization that are commonly used in laser–FBG pairs make it possible to reduce the temperature shift to 0.25 GHz/°K, which, as a rule, is insufficient without the use of additional means of temperature control. For an FBG, temperature stabilization will also require additional solutions, as for example noted in
[44][45][46][47]. To solve this problem, the amplitude modulation coefficient can be used as an additional parameter. When using an MZM at the zero operating point with a suppressed carrier, the modulation coefficient of the beat of a two-frequency signal in the absence of temperature shifts in the laser and the FBG is equal to one with equal amplitudes of the components. In the presence of a frequency shift in both the laser and the FBG, the amplitudes of the two-frequency signal components are unequal to each other; therefore, the amplitude modulation coefficient is less than one. Determination of the shifts in the amplitude modulation coefficient and the sign of the frequency, and of the phase difference in the envelopes at photodetectors one and two for both channels, can be performed in the processing unit to compensate for the temperature shift. For an MZM, the temperature shift is on the order of 0.02 V/°K, and leads to a shift in the operating point and the appearance of an additional harmonic at frequency
f0 in the output spectrum, due to an incompletely suppressed carrier. That leads to a decrease in the amplitude of the two-frequency radiation at the modulator output and to the appearance of an additional beating in the two-frequency components with an unsuppressed carrier at the output of the photodetector at frequency
fRF; this beat is the difference between
f0 −
fRF and
f0 +
fRF. This affects the signal-to-noise ratio and the amplitude of the detected signal. This feature is key for radar systems, since, as a rule, the power of the measured signal is small (at the border of the system sensitivity range) and affects the maximum detection distance to the target. The solution to the problem of MZM operating point control lies in monitoring the beat power of the incompletely suppressed carrier and the components of the two-frequency signal at frequency
fRF as well as the beat of the measured signal of the two-frequency components at a frequency of 2
fRF. The ratio of their power makes it possible to determine the value of the temperature shift and take measures to eliminate it.
As mentioned above, one of the key problems with such systems, which depends on the FBG itself, is the monotonicity area in the region of the FBG’s central wavelength, which affects the accuracy of the frequency-to-power conversion and the construction of the ACF (
Figure 3b). To solve this problem, it was proposed to use an FBG with a special concave profile shape, which significantly improves measurement accuracy in the “low” frequency range near the central wavelength due to very steep slopes of the amplitude–frequency characteristic (
Figure 5)
[23]. The disadvantage of this solution is a decrease in measurement accuracy in the “high” frequency region.
Figure 5. Calculated results for a concave FBG: (
a) Dependence of the detected optical power and the power ratio on the microwave frequency; (
b) Frequency response of the special FBG with two slopes that are inversely proportional to the optical frequency
[23].
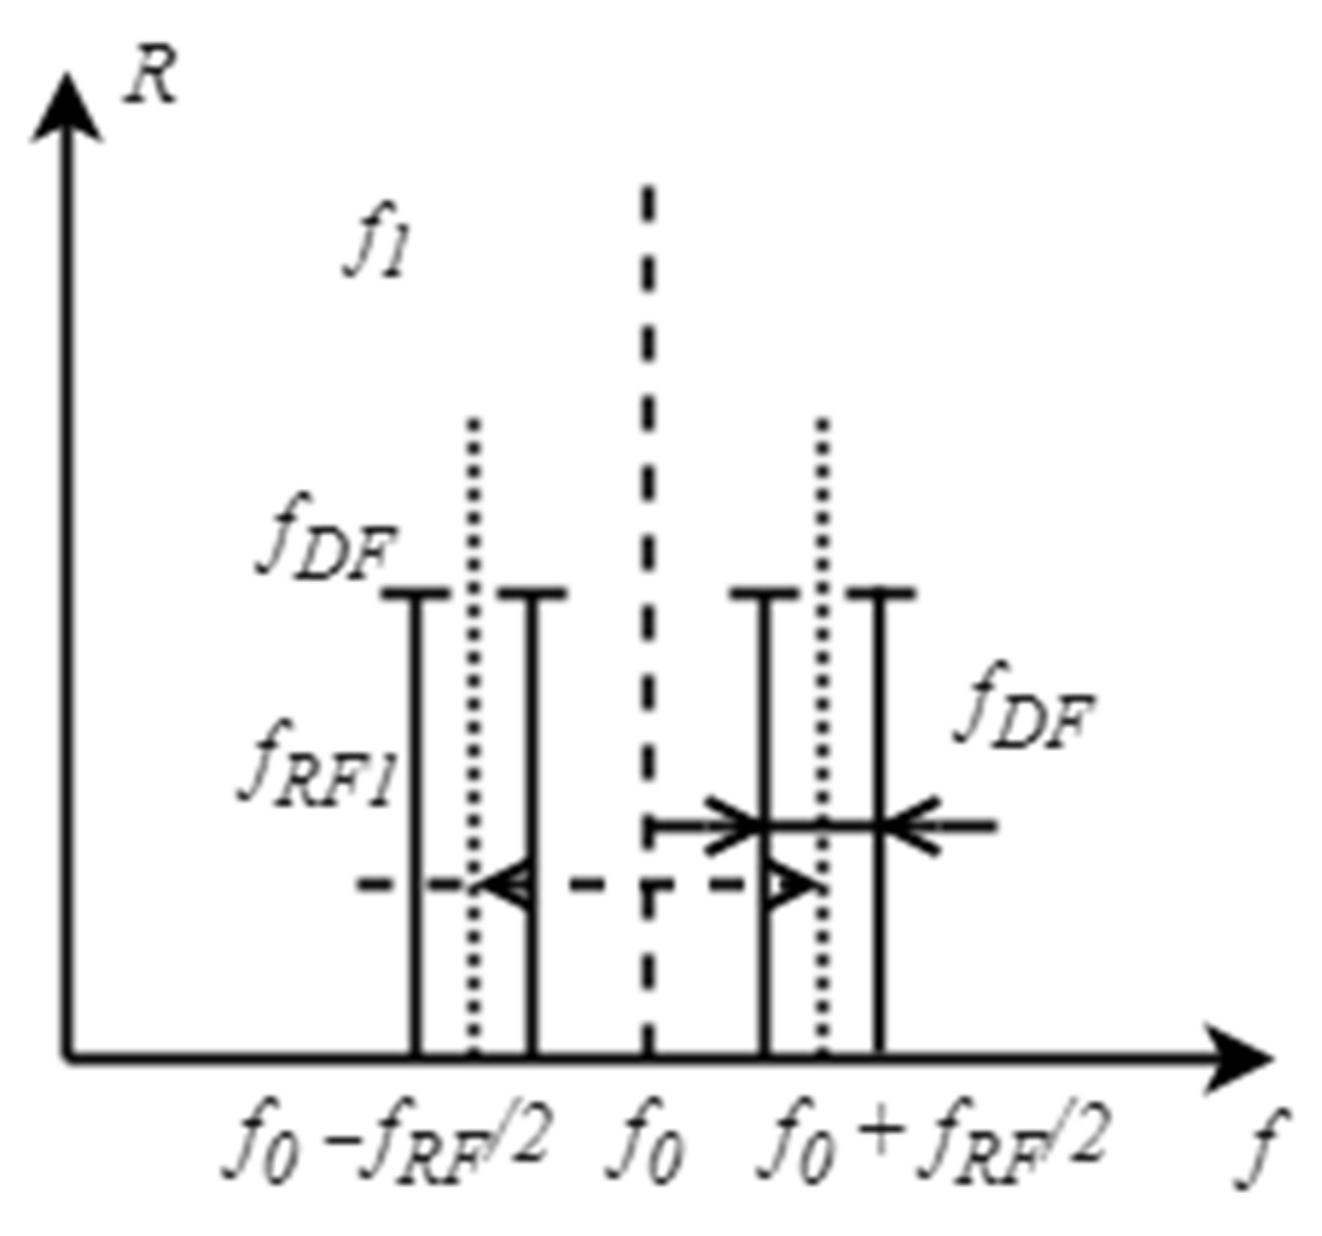
Detection in the “high” frequency region at the border of the FBG frequency range also leads to an increase in measurement error due to the nonlinear change in the frequency-to-power conversion and low signal power in the reflection channel. To solve this problem, it was proposed to detect the beat signal of the two-frequency components of the measured signal at an intermediate frequency by using an additional modulator with a fixed frequency to split each of the two-frequency radiation components to a difference frequency of 100 MHz
[26]. Detection in this case is determined by the beat envelope of the two-frequency components relative to the intermediate frequency of 100 MHz (
Figure 6).
Figure 6. IFM method with increased resolution at “high” frequencies: explanation of the operation principle (adapted from
[26]).
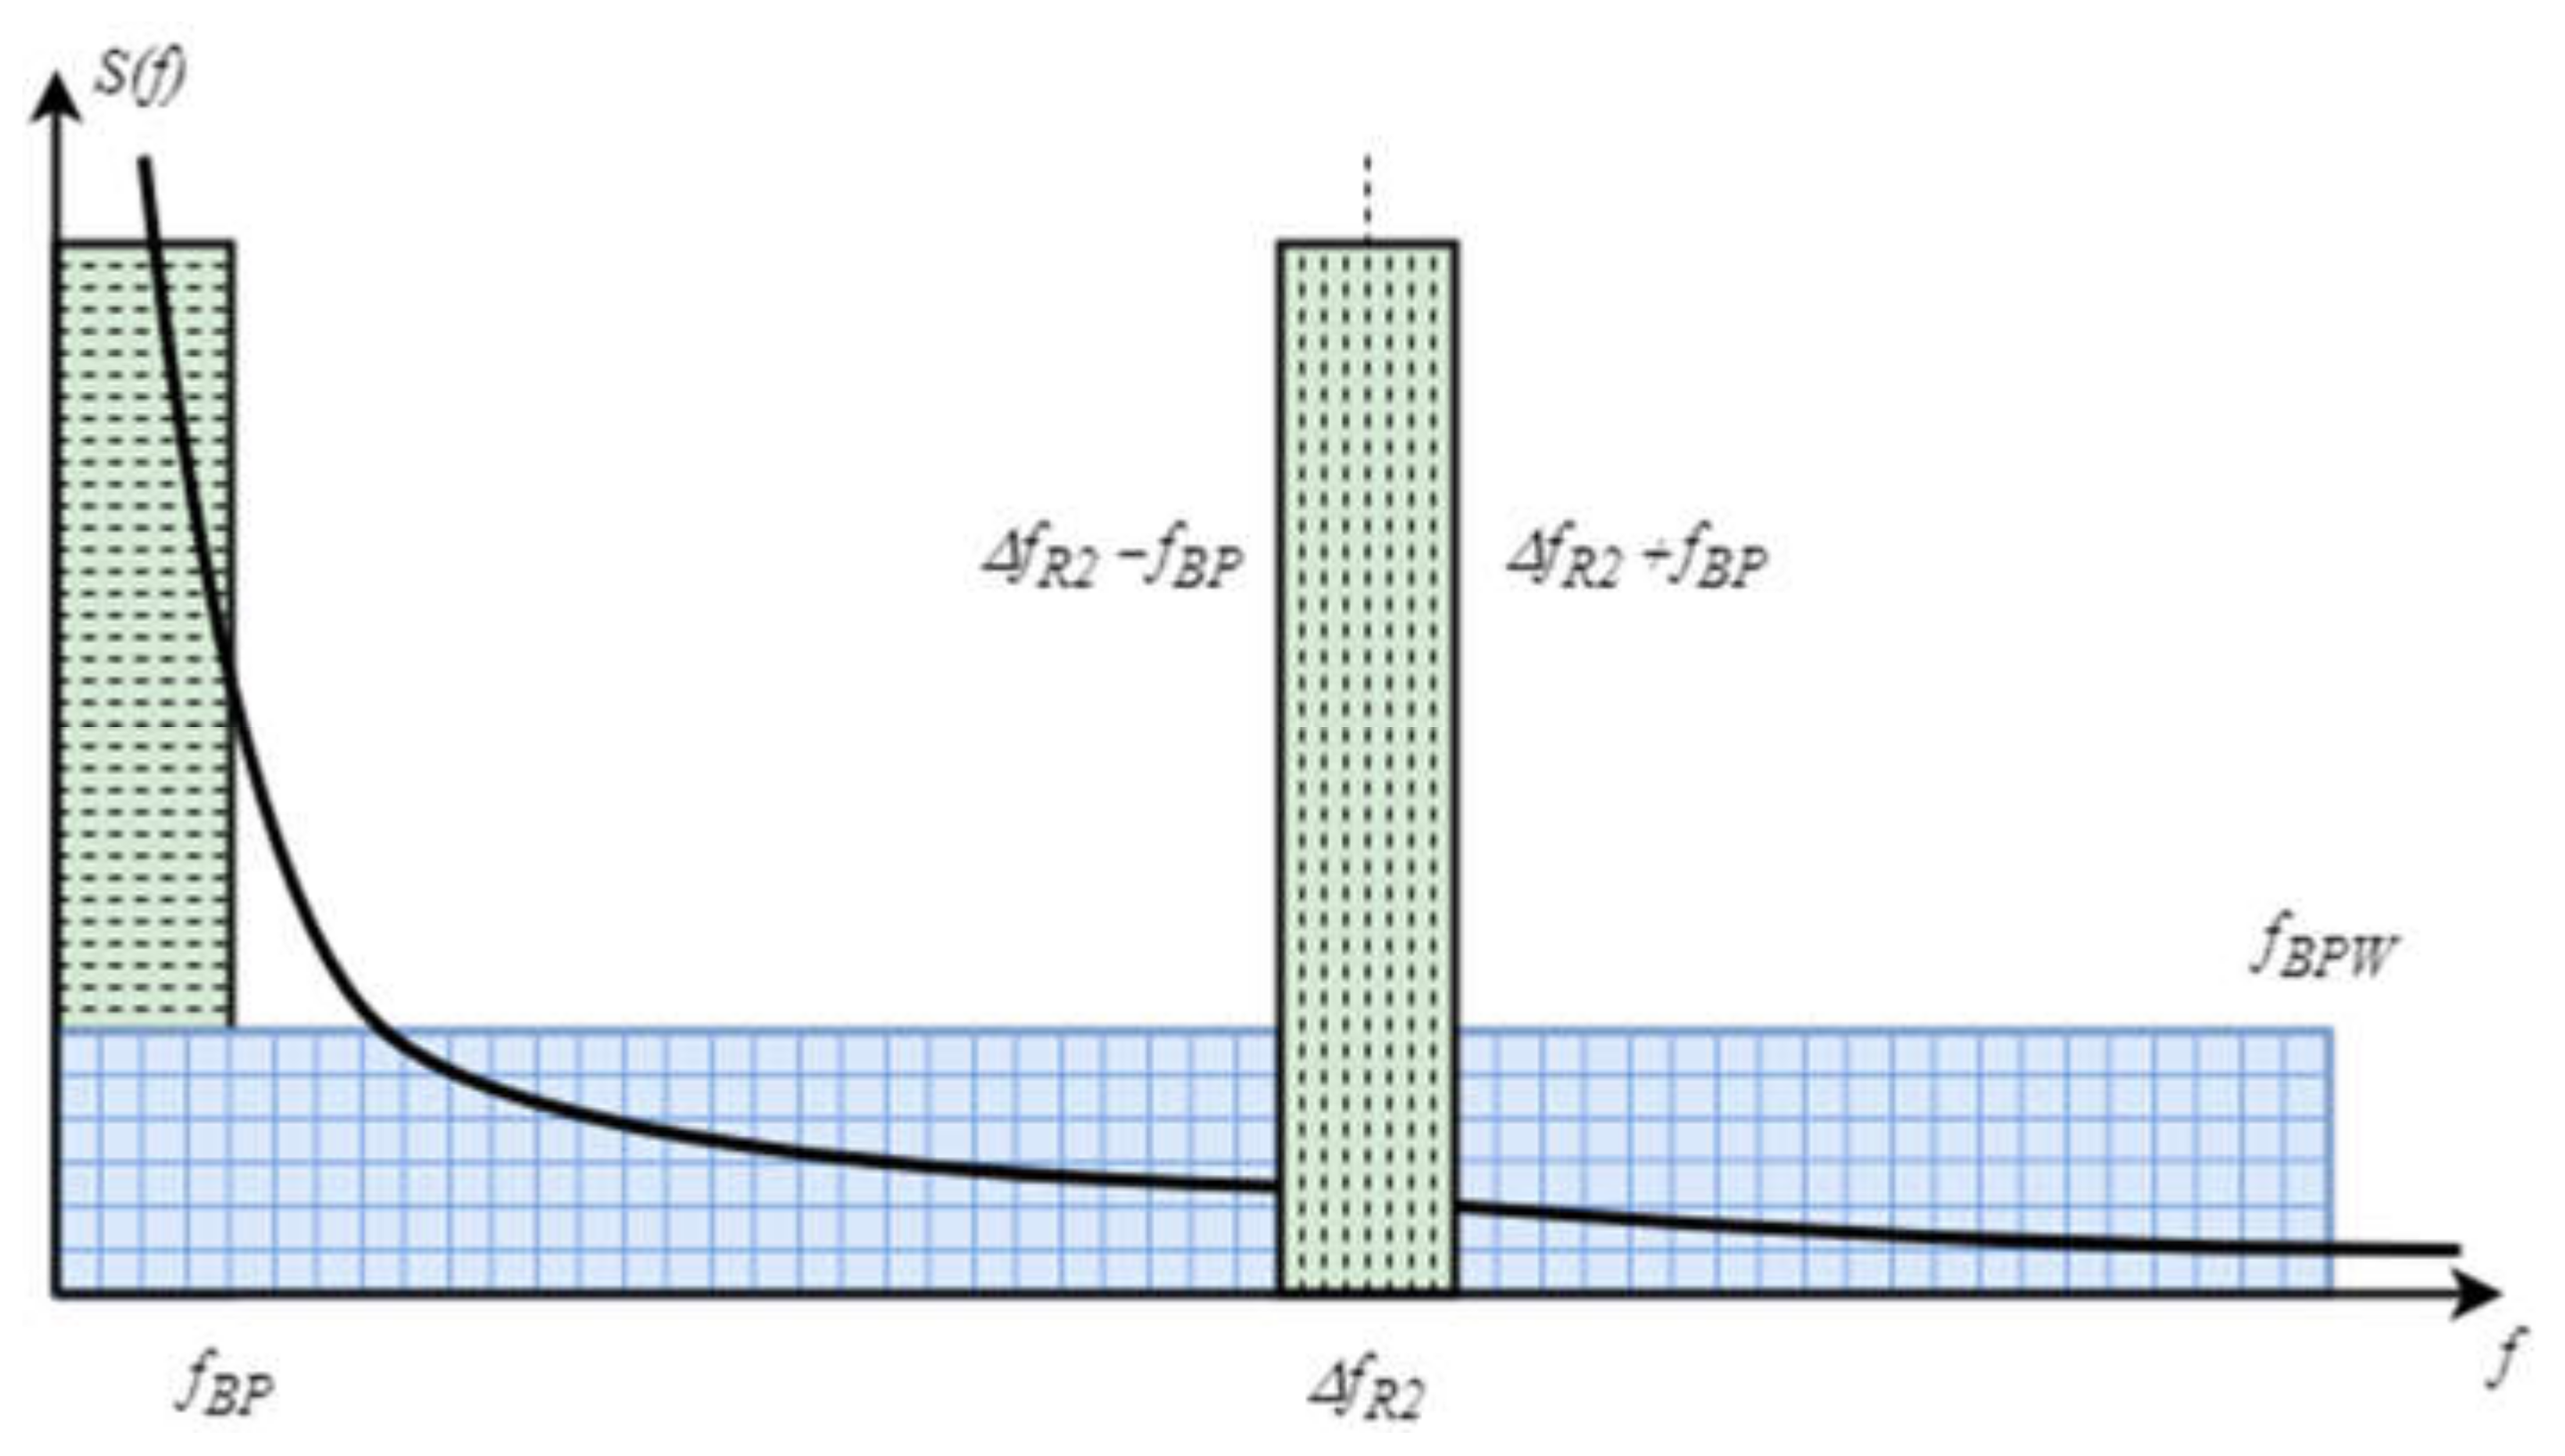
This solution, in comparison with solutions based on direct photodetection, makes it possible to reduce the effects of photodetection noise, namely, thermal, shot, and flicker noise, which are inherently low-frequency by nature, and in turn can increase the signal-to-noise ratio (
Figure 7)
[26].
Figure 7. Explanation of SNR gain using detection at an intermediate frequency, compared with direct detection (adapted from
[26]).
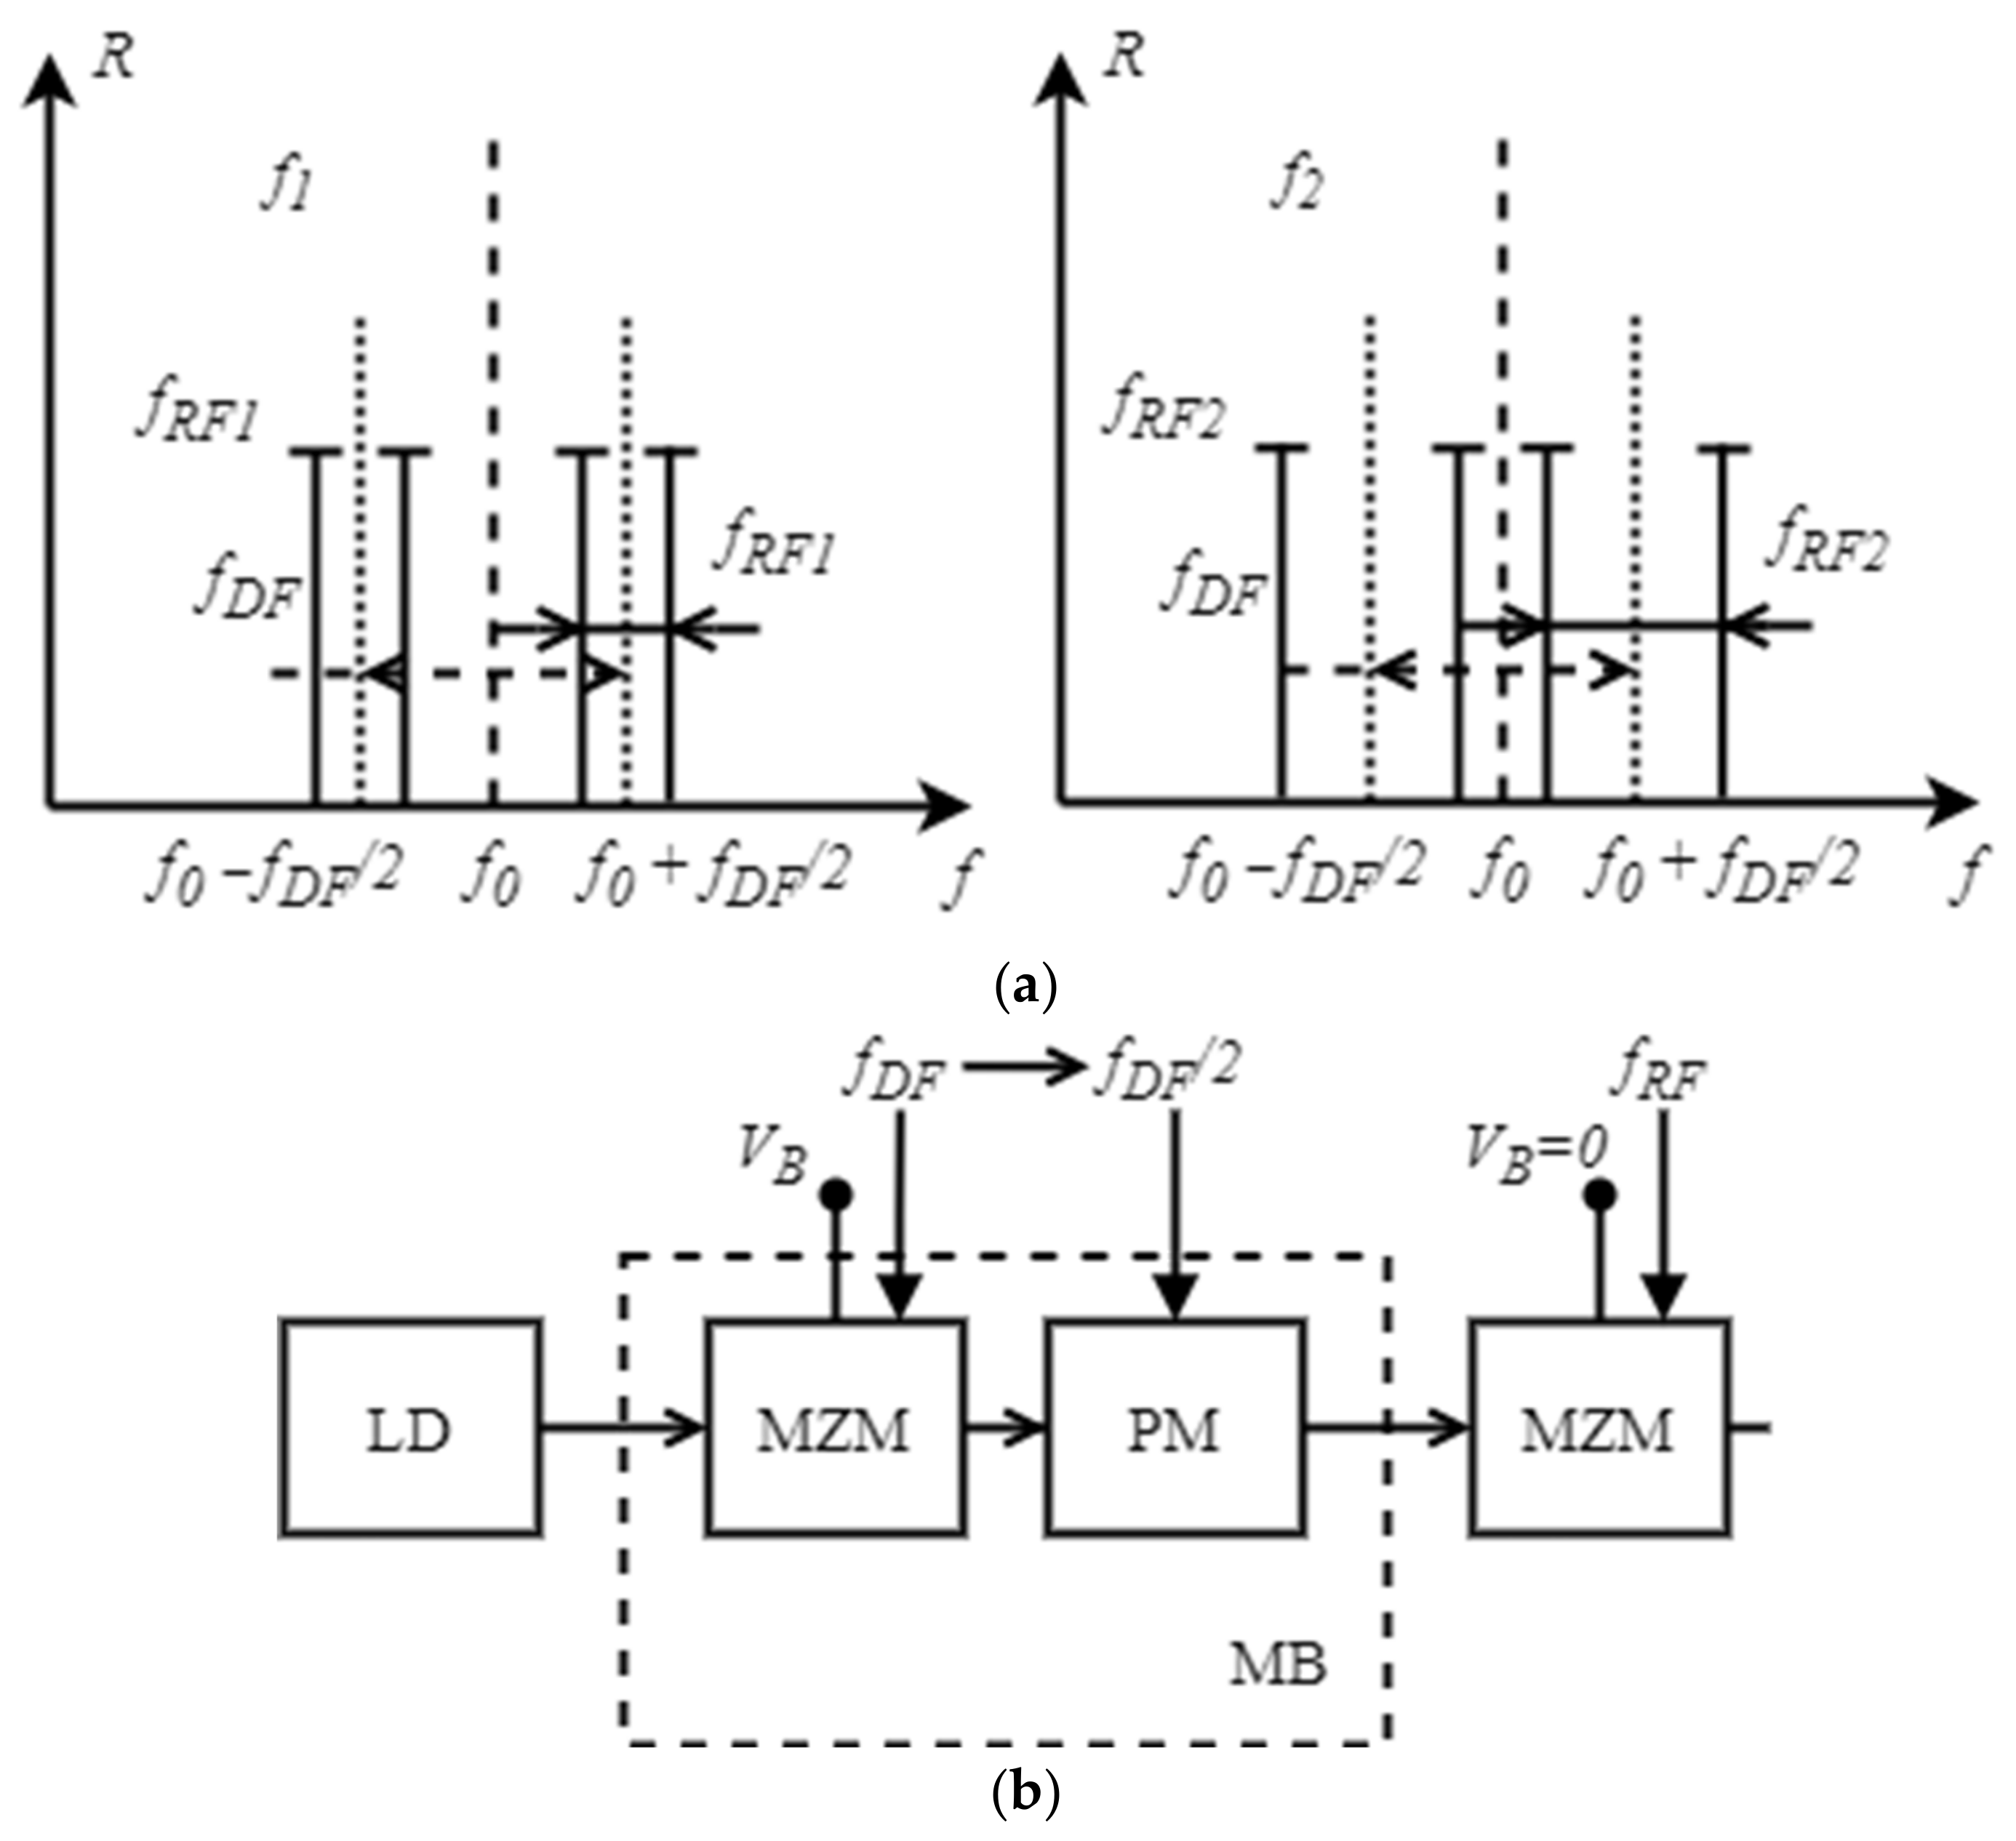
As another solution to the measurement accuracy problem in the “low” frequency region, this research presents the concept of separation of the measured frequencies at the center of the FBG slopes (linear section). This solution is realized by pre-modulating the laser radiation in the MZM at the zero operating point with a signal at a fixed frequency equal to the FBG frequency response at half of its amplitude. A block diagram describing the implementation of the proposed solution and a visual representation of the measured position of the signal harmonics is shown in Figure 8.
Figure 8. IFM method with additional frequency separation: (
a) Explanation of the operation principle; (
b) block diagram of the transmitting part. LD—Laser diode; MZM—Mach–Zehnder modulator; PM—Phase modulator; MB—Modulator block (adapted from
[26]).
The proposed solution allows for complete elimination of several disadvantages: the monotonic section of the FBG frequency response, the low-frequency measurement limit of 100–200 MHz, and the transfer of measurement of the low-frequency signals to the center of the FBG linear slope. This increases the frequency-to-power conversion accuracy and the measurement accuracy, although similarly to the previous solution, it requires an additional modulator and a band pass filter with a bandwidth equal to half of the FBG bandwidth. As a side effect, for a fixed operating frequency range, the bandwidth of the FBG must be two times higher. For example, if the measurement range is 20 GHz, the FBG must have a total width of 40 GHz. To minimize the filter bandwidth, two detection mechanisms are used depending on the amplitude modulation coefficient, where m ∈ [0; 1] defines a frequency range from 0 to 20 GHz and m = 1 a frequency range from 20 to 30 GHz, which also shows the possibility of measuring frequencies higher than the photodetectors’ bandwidth.
As a way to improve measurement accuracy over the entire frequency range, in
[45] it was proposed to use a specially designed triangular FBG as a V-shaped filter instead of the classical Gaussian FBG. The characteristics of the V-shaped filter and the spectral response of the manufactured FBG in the reflection channel are shown in
Figure 9a and
Figure 9b, respectively.
Figure 9. IFM method using a triangular V–shaped filter: (
a) Characteristics of the V–shape filter; (
b) Transmission spectrum of the fabricated fiber Bragg grating
[45].
This type of grating allows for the building of a linear ACF for both the “low” and “high” frequency ranges. The measured frequency range and measurement accuracy in this case are determined by the slope factor of the V-shaped filter. In the case of
[45], the measured frequency range was 2.5–8 GHz with a FBG slope of 1.12 dB/GHz and a measurement accuracy of ±0.25 GHz. As stated by the researchers, measurements above 8 GHz were not carried out due to a high dispersion effect experienced by their fabricated FBG under their experimental conditions, and the measurement accuracy was mainly determined by temperature fluctuations, which could be stabilized by using an athermal isolated FBG. Further expansion of the operating frequency range can be achieved by using a wider FBG.
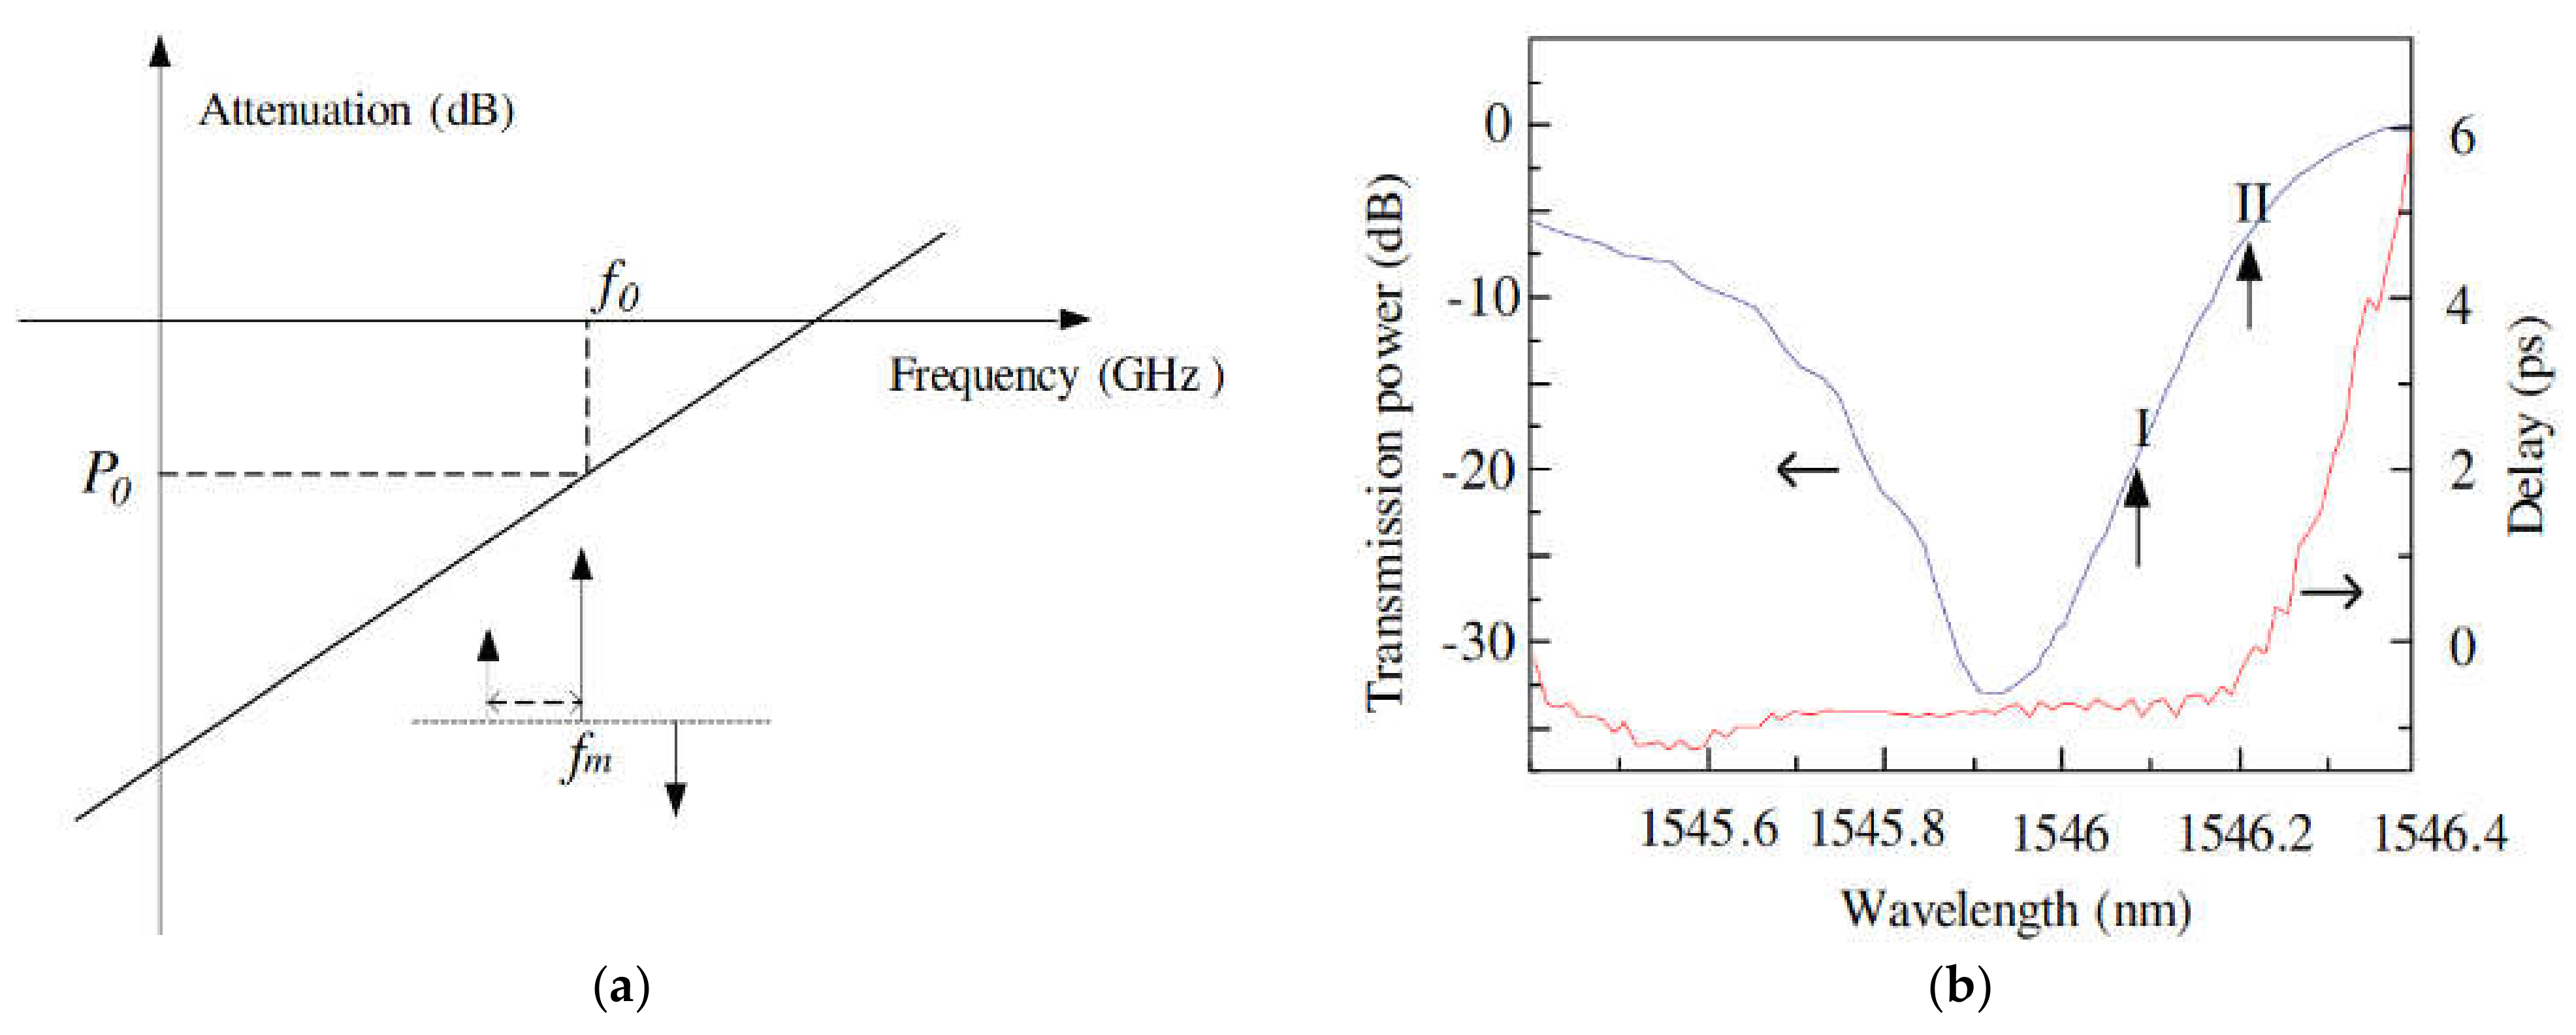
An alternative way to implement a system with improved measurement accuracy, in comparison to systems in which the laser wavelength is tuned to the FBG’s central wavelength, is presented in
[27] where measurements were carried out on only one FBG slope, which was used as a tilt filter. In this work, a tunable laser source with phase modulation was used, and a tilt filter was used to set a phase mismatch after modulation to implement phase-modulation-to-intensity-modulation conversion. A tunable laser source was used to obtain two power ratios at different slope areas of the FBG frequency response. The principles of operation for the tilt filter and the spectrum in the transmission channel with dispersion characteristics are shown in
Figure 10a and
Figure 10b, respectively.
Figure 10. IFM method using an FBG as a tilt filter: (
a) Block diagram of the characteristics of an external tilt filter; (
b) transmission spectrum and dispersion characteristics of the chosen fiber Bragg grating
[27].
The main feature of this method is the possibility of measurement at different parts of the slope with different steepness values, which improves measurement accuracy. It is also worth noting that the system works only in the transmission channel, and therefore requires only one photodetector. The use of a phase modulator eliminates the need to maintain a bias voltage compared to the solutions based on MZM. By taking the power ratio from two points of the FBG frequency response, the system becomes insensitive to laser power fluctuations. The range of measured frequencies can be extended and measurement accuracy can be improved by using an FBG with a special form of frequency response.
2.3. Discussion of Analysis Results
The performance of IFM techniques based on FBG and the achieved characteristics are summarized in Table 2.
Table 2. Performance of IFM techniques based on FBG.
Analysis of publications covering IFM systems based on FBG allows for the conclusion that the shape of the FBG frequency response is the main source of system measurement errors when stable operational conditions are ensured: namely, errors in the “low” frequency range due to the presence of monotonicity conversion and errors in the “high” frequency range due to the non-linear nature of the conversion and low power levels in the reflection channel. These problems can be solved using the methods discussed in the measurement accuracy improvement section. In the considered works, the operating frequency range did not exceed 20 GHz, which does not satisfy the requirements for IFM systems presented in the introduction section. At the output of the MZM at the zero operating point with the carrier suppressed, the difference between the components of the two-frequency signal is twice the modulation frequency, so in order to detect such a signal, twice the bandwidth of the FBG and the corresponding photodetectors is needed. According to the requirements given in the introduction section, the required operating range of the measured frequencies should be 40 GHz; hence, the operating frequency range of the MZM should be up to 40 GHz, and the bandwidth of the FBG and photodetector should be at least 80 GHz. It is possible to use MZMs and photodetectors with operating frequency ranges up to 80 GHz; however, expansion of the frequency bandwidth of the FBG up to 80 GHz will increase the monotonicity area in the “low” frequency range and the conversion nonlinearity in the “high” frequency region for both the classical Gaussian FBG and an FBG with a concave profile. Therefore, it is concluded that for this type of system, the optimal solution in terms of frequency-to-power conversion accuracy and ACF construction accuracy would be a solution with a triangular frequency response, which, however, presents some manufacturing difficulties, for example, requiring a special phase mask for its manufacturing process
[48][49].
This entry is adapted from the peer-reviewed paper 10.3390/photonics9100754