2. Methods, Technologies, and Approaches to Monitoring Plant Water Status
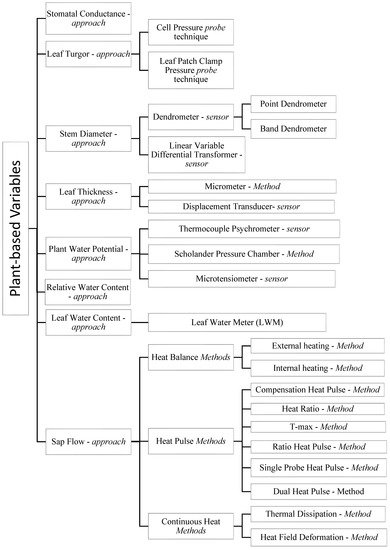
The technical characteristics, strengths, and limitations of the methodologies and technologies are summarized in Table 1, while a graphic representation is portrayed in Figure 1.
Figure 1. Graphical scheme describing the different plant-based variables and approaches, and the respective technology or sensors used to estimate plant water status. The approaches measure physiological variables by means of different methods and instruments.
Table 1. A summary of the main plant-based water stress indicators, measured variables, respective sensors and methods with their technical functions, and their main strengths and limitations for better irrigation scheduling.
2.1. Stomatal Conductance-Based Approach
In the leaf, the role of stomata is to regulate carbon dioxide (CO
2) assimilation with respect to water vapor (WV) loss. Although water loss through transpiration during high-temperature conditions cools down plants, stomatal closure during drought periods is crucial to limit transpiration and prevent possible xylem dysfunction [
61,
85]. Therefore, stomatal regulation of leaf gas exchange is vital for plant survival under arid and semi-arid conditions when potential evapotranspiration is above precipitation [
10,
86].
The measurement of stomatal aperture or g
s is the inverse of the stomata resistance to the rate of passage of CO
2 entering and WV exiting the leaf. Many variables, such as alternations in soil water status and atmospheric demand, cause the stomatal aperture to change regularly [
87,
88]. The constant variation of g
s measurements reflects the plant response to water stress and is considered one of the most effective and sensitive water stress indicators [
32,
89]. The maximum daily g
s (g
smax) is the g
s value measured at the broadest possible stomatal aperture when optimal gas exchange is achieved and is widely considered a water stress indicator [
10].
The g
s is measured using porometers and infrared gas analyzers (IRGAs). The porometer computes g
s to WV, whereas the IRGAs compute g
s to both WV and CO
2. Both devices have a chamber in which the whole leaf, or part of it, is clamped. If the leaf cuticle is permeable to WV and CO
2, the apparatus measures the leaf conductance (g
l). If the leaf has an impermeable cuticle, the device computes the g
s. Toro [
90] showed that the measured g
s strongly differed between the IRGA and the porometer depending on the plant species, water availability, and environmental conditions. Under maximum water stress, g
s measured with the leaf porometer was higher than those measured with the IRGA.
2.2. Leaf Turgor-Based Approach
Leaf turgor is the pressure exerted on the cell walls to maintain its rigidity and form. The leaf loses rigidity and wilts because of water stress and deficit. The osmotic flow of water regulates this pressure. Stomatal closure and aperture control transpiration, which in turn affects leaf water status and subsequently leaf turgor pressure [
91]. The decrease in turgor pressure was shown to be directly proportional to the transpiration rate and stomatal closure [
41,
92]. After studying diurnal oscillations of turgor pressure, Zimmermann [
93] also found that leaf water status can be evaluated according to the size of turgor pressure loss around noon and the time needed for its recovery in the afternoon.
2.2.1. Cell Pressure Probe Technique
The cell pressure probe technique was introduced as a method intended to continuously measure cell turgor [
62,
63,
94,
95]. The pressure probe comprises a microcapillary, a pressure chamber containing a pressure transducer, and a metal rod, with the whole device filled with silicone oil. The probe is then attached to the leaf by inserting the microcapillary into the cell, and pressure is exerted by releasing the oil. Consequently, turgor pressure pushes the sap to exit the cell into the microcapillary, decreasing the cell pressure. Again, oil is released, causing an increase of pressure until the boundary sap–oil reaches an equilibrium, and the pressure on the oil read by the pressure transducer becomes equal to cell sap. This technique is accurate, robust, and straightforward in determining leaf turgor [
96].
2.2.2. Leaf Patch Clamp Pressure Probe
More recently, researchers studied a noninvasive leaf patch clamp pressure probe (LPCPP) designed to measure leaf turgor [
64,
97,
98]. The probes are made up of pressure sensors clamped to the leaves using two magnets to monitor relative water status changes. To consider the measurements accurate, the patches should be in osmotic contact with the whole leaf, and the stomata should be closed to avoid water loss. For these conditions to be achieved, the upper magnet can be moved and clamped according to LT and rigidity, while keeping constant the pressure exerted by the magnets. The probe measures the pressure transfer function of the leaf patch, i.e., the attenuated output pressure (Pp), in response to the magnetic clamp pressure (Pclamp), with cell turgor pressure (P
c) measured on the leaf patch being opposed to this output pressure (P
p) [
64,
99].
A non-invasive magnetic LPCPP (the ZIM-Probe) was developed by Zimmermann [
100] to measure changes in leaf turgor continuously and in real-time.
2.3. Leaf Thickness
The first studies dedicated to the relationship between LT and PWS showed a decrease in LT during plant dehydration, followed by a rapid compensation upon irrigation, causing changes in leaf and stem thickness indicators of water deficit [
45]. Studies showed a correlation between LT and plant water potential [
67,
69], providing an early stress detection measurement. More recent studies showed that LT can be used to measure leaf RWC and overall plant water content [
101].
LT can be measured using micrometers [
67,
68] or using the linear variable displacement transducers, also known as linear variable differential transformers (LVDTs), that similarly measure stem diameter [
69].
2.3.1. Micrometers
The sample leaf is cut and submerged in water after being inserted in a polyethylene bag to prevent evaporative water loss, and then stored in darkness. The leaf is allowed to regain full hydration before measuring its thickness at full turgor. The gear-wheel type micrometer is used to measure LT through an internal spring that exerts pressure when released. A pressure–volume curve is then constructed to calculate thickness and RWC [
67,
68]. Micrometers are considered bulky and hard to automate [
101].
2.3.2. Displacement Transducers
A displacement transducer is a device consisting of a leaf clamp holding a probe and a metal target or rod [
69]. When the instrument is clamped around a sample leaf, an alternating current passes through the probe, generating an alternating magnetic field that induces eddy currents within the target. The circuit is then transformed into a voltage and linearized as a function of the distance separating the sensor head of the metal target and the leaf probe, this distance being the LT. These transducers were introduced in an attempt to allow automated LT measurement [
102].
2.4. Leaf Water Content
The authors of ref. [
70] introduced a novel sensor, the leaf water meter (LWM), that measures leaf water content through the measurement of the absorption of radiation when this propagates through the leaf tissues. The non-invasive tool is based on the photon attenuation of the passage of radiation through the leaf. Three plastic clamp cables are connected to a readout system, which is equipped with climatic sensors. LWM was shown to be a sensitive, non-destructive, and reliable device to monitor plant water status continuously and in real-time during water stress progression.
2.5. Stem Diameter-Based Approach
Stem diameter variation (SDV) is a PWS indicator that permits the early detection of water stress. A strong relation exists between daily variations in PWS and daily variations in stem diameter [
42,
43,
44,
103,
104,
105]. As transpiration (Ep) occurs in the plant leaves, a tension arises in the evaporative surface and extends to all water-storing organs. This rapid response to atmospheric changes causes systematically diurnal diameter changes in all plant parts, including the stem, branches, roots, leaves, and fruits [
105,
106,
107,
108,
109]. As a result, as Ep increases, water loss increases, leading to a decrease in trunk diameter.
Nevertheless, these changes in water content represented by shrinkage and swelling of the tissues are reversible, leading to diurnal SDV. Daily, the fluctuations record SDV-derived variables: a maximum daily stem diameter and a minimum daily stem diameter, with the difference between them being the maximum daily shrinkage (MDS). Another recorded measurement is stem growth rate, which corresponds to the difference between the maximum stem diameter of two consecutive days [
110,
111]. Significant differences in stem diameter variation under different irrigation levels exist as water shortage results in larger maximum daily shrinkage and smaller daily increase [
112].
2.5.1. Dendrometers
Dendrometers are instruments used to measure stem and trunk diameter variation and growth. They give high-resolution data of diurnal stem size variations and seasonal tree growth and water storage fluctuations over the year [
65,
104,
113].
Point Dendrometers
Point dendrometers measure stem growth along the radius or diameter of a tree using a linear potentiometer or sensor consisting of a rod nailed or screwed outside the trunk. The sensor measures a potential difference of either swelling or shrinking of the stem, and translates it into an electrical signal [
66]. An output voltage will then be obtained, indicating the stem’s growth.
Band Dendrometers
Band dendrometers measure the circumference and linear displacement of a band wrapped around the trunk, stem, or branch using a linear potentiometer. Similar to the point dendrometer, as the stem swells or shrinks, the band expands and contracts, transmitting a signal to the potentiometer [
65].
2.5.2. Linear Variable Differential Transformers
LVDTs are sensors fixed on the main trunk by a metal frame of Invar, a metal alloy with minimal thermal expansion. They function by converting stem linear displacements they are coupled to into an electrical signal through a displacement transducer. The sensors should be individually calibrated using a precision micrometer. The LVDT sensors are robust and of high precision [
110]. They are sensitive to small changes in stem growth.
2.6. Plant Water Potential-Based Approach
Water potential or free water energy measures the potential energy of water that allows water to move up the plant [
114].
Leaf water potential (LWP) is measured on a single leaf and can represent local leaf water demand, soil water availability, internal plant hydraulic conductivity, and stomatal regulation [
46,
115]. Xylem water potential (XWP) is measured on a non-transpiring leaf since, when leaves do not transpire, their potential is considered to correspond to stem water potential (SWP) [
7,
116]. XWP is the result of whole-plant transpiration and soil and root/soil hydraulic conductivity. Subsequently, it indicates the ability of plants to conduct water from the soil to the atmosphere [
116]. Studies showed SWP to be a water deficit indicator [
35,
117,
118], and since SWP is equal to XWP, it can replace LWP as a more accurate water stress indicator [
27,
119]. According to Van Leeuwen [
7], under conditions established by dry soil cultivation, plants tend to maintain LWP, especially at midday, through increased stomatal closure to avoid severe water losses. Furthermore, Choné [
46] established a relationship between leaf transpiration and ΔΨ for grapevines. PWP is measured using three main methodologies: thermocouple psychrometers, pressure chambers and Scholander pressure chambers [
68,
72,
120,
121],and more recently, the microtensiometer [
74,
75,
122].
2.6.1. Thermocouple Psychrometers
Thermocouple psychrometers are noninvasive instruments that measure leaf water status on site. Isopiestic psychrometers work by enclosing the sample leaf and a thermocouple in a small container or chamber while maintaining constant temperature [
71]. The thermocouple is made up of two junctions: the reference junction, which measures the chamber temperature, and the measurement junction, which measures the air temperature. As water evaporates from the leaf, air humidity is measured, and water vapor pressure is determined. When evaporation takes place, vapor pressure increases, and subsequently, temperature and voltage detected by the thermocouples decrease. Contrarily, when condensation occurs, vapor pressure drops, and temperature and voltage increase. Nevertheless, when the temperature is kept stable, and neither condensation nor evaporation occurs, vapor pressure is considered equal to air humidity, thus equivalent to the plant water potential [
71].
The water activity meter is considered a subgroup of the psychrometer technique that measures plant water potential based on the chilled-mirror dewpoint technique [
123,
124]. The instrument is made up of a sealed chamber that contains a mirror and a means of detecting condensation. At equilibrium, the water potential of the air in the chamber is equivalent to the water potential of the sample.
2.6.2. The Scholander Pressure Chamber
The Scholander pressure chamber is a simple and effective instrument widely used to measure LWP [
72]. The method consists of increasing the pressure using a high-pressure compressed gas around a leaf until sap from the xylem appears at the end of the shoot, extends outside the chamber, and is exposed to atmospheric pressure [
71]. The pressure needed to keep this condition is equal to the negative pressure existing in the intact stem. The quantity of pressure necessary to force water out of the leaf cells into the xylem is a function of the water potential of the leaf cells [
71]. LWPs are then estimated from the sum of the balancing pressure measured with a pressure chamber, and the osmotic potential of the xylem sap in leafy shoots or leaves.
The pump-up pressure chamber is a newly designed pressure chamber that avoids the use of compressed gases in the Scholander design, achieving the required pressure through a pump [
73]. This novel pressure chamber is mainly designed for irrigation scheduling and monitoring, particularly for managing deficit irrigation.
The authors of ref. [
125] proposed modifications in the sampling technique to obtain more accurate and consistent results, emphasizing the knowledge and proper training of the operator.
2.6.3. Microtensiometer
Since the previous methods do not measure water potential continuously and are labor consuming, microtensiometers were studied as an option for continuous monitoring of water status [
74,
122]. These sensors measure water potential based on a microelectromechanical pressure sensor that is embedded in the trunk and directly measures stem water potential. This method can be automated, providing continuous data in easy-to-interpret pressure units similar to the traditional pressure chamber stem water potential methods [
122]. Blanco and Kalcsits [
74] found that microtensiometers gave accurate continuous measurements of SWP in trees during the growing season across a large range of environmental conditions and soil water content. On the other hand, the author of ref. [
75] found that microtensiometers are sensitive in representing diurnal and seasonal changes in water potential, except under high VPD conditions.
2.7. Relative Water Content-Based Method
RWC represents the relative amount of water present in the plant tissues, i.e., the correlation of the actual water content of a tissue to the highest attainable water content at full turgor [
126]. It is used as a water deficit indicator [
37,
127,
128]. Diurnal RWC is closely related to stem diameter changes and varies inversely with the change in solar radiation, increasing when the radiation decreases and decreasing as radiation increases [
49]. Mathematically, the RWC of plant tissue is calculated according to Equation (1)
. [
48]:
FW, DW, and TW are the fresh, dry, and turgid masses, respectively, of the tissue.
FW is the mass weighed immediately after leaf collection, TW is obtained after floating the leaf in distilled water, and DW is the weight taken after placing the leaf in a heated oven.
2.8. Sap Flow-Based Approach
SF is the movement of fluid in the roots, stems, and branches of plants, and is typically measured in the xylem of plants [
129]. The measurement of the rate at which the sap ascends a plant, whether the whole plant, individual branches, or tillers, can determine the transpiration rate. Since transpiration depends on PWS, and given that the effect is controlled by stomatal opening and g
s, SF can be used as an indicator of PWS and water stress [
129,
130,
131]. According to Alarcón [
130], SF is greatest on warm, sunny days of high vapor pressure deficit, and the least on cooler, cloudy days of low VPD. Additionally, SF would decrease progressively once irrigation water is suspended, and vice versa, increase when irrigation is resumed [
130].
Two main approaches exist to measure SF: one calculating the sap-flow rate through the heat balance methods, the other calculating sap-flux density through either the heat pulse methods or the continuous thermal dissipation methods [
131].
SAPFLUXNET is a global database of SF measurements [
132]. The metadata surveys SF datasets from field studies on species around the globe in order to serve as a benchmark for research.
2.8.1. Heat Balance Methods
Heat balance methods calculate the mass of flow rate of sap, determining, by difference, the amount of heat transported in the moving sap after being subjected to a known amount of heat.
Heat Balance with External Heating, or Stem Heat Balance Method
The stem heat balance (SHB) method, introduced by Sakuratani [
51], is used to measure SF in both woody [
133] and herbaceous [
134] stems. A SHB gauge is made up of a flexible heater (thermopile) and thermocouples to sense temperature differences wrapped around the conductive organ. A small quantity of heat is then applied continuously through the heater, and the connected thermocouple junctions sense the increase of temperature of the enclosed stem.
Energy conservation between the energy put into the stem and the energy losses is calculated, i.e., the heat input from the heater is balanced by the heat fluxes out of the stem, thus obtaining SF [
51,
134].
Heat Balance with Internal Heating, or the Trunk Sector Heat Balance Method
The trunk sector heat balance method of SF measurement used on tree trunks with diameters greater than 120 mm. Similarly to the stem heat balance method, SF rates are derived from the heat balance of a heated stem tissue. However, in the trunk sector heat balance method, heat is applied internally to only a segment of the trunk, instead of externally to the entire circumference of the enclosed stem. Stainless steel electrode plates, as well as thermocouples, are inserted into the trunk to transfer heat. Temperature increase ΔT between the inside and the outside of the trunk is calculated to measure the SF rate at the center of the heated trunk sector [
76].
2.8.2. Heat-Pulse Methods
Heat-pulse techniques are noninvasive methods used to measure SF in plant stems without disrupting the sap stream of the conductive organ [
52,
78,
135]. The obtained measurements are consistent, use low-priced technology, and provide a good time resolution of SF, as well as automated data collection and storage [
136]. The sequential or simultaneous measurements on numerous trees can estimate transpiration from whole stands of trees [
135].
Compensation Heat Pulse method
The compensation heat pulse method (CHPM), introduced by Marshall [
50], is a technique intended to study SF [
130,
137,
138,
139]. Since its introduction, simple instrumentation, robust probes, and reliable measurements have been developed [
136].
This technique uses two temperature probes asymmetrically placed on either side of a central line heater inserted radially into the tree xylem through drilling holes into the sapwood. The heater probe then releases a heat pulse that is then carried via convection and conduction as a tracer in the conducting organ. The heat pulse velocity is then calculated by measuring temperature differences, with the application of a set of theoretically derived corrections to correct errors that might occur due to a stem wound following the drilling [
52,
135,
138].
The comparison between the values of SF and transpiration rates measured underlined the robustness and high sensitivity of the compensation heat-pulse technique for estimating transpiration [
136,
140].
The Heat Ratio Method
The heat ratio method (HRM), an improved heat-pulse-based technique, was developed by Burgess [
77] to modify the CHPM.
The HRM measures the ratio of the increase in temperature, following the release of a heat pulse through a central heater, at points equidistant downstream and upstream. With the HRM, placement errors of the equidistant probes can be tested in situ and mathematically corrected, making it more accurate than CHPM asymmetrical probes [
77].
The velocity of the heat pulse can be calculated from the temperature ratio between the two sensor probes, the thermal diffusivity of the sapwood, and the distance between the heater and the sensor probes [
50,
77], and then converted into sap flux density [
77,
141].
A recently developed external heat ratio (EHR) method aims to obtain a noninvasive and accurate bidirectional SF, and is further adapted to thin stems [
142,
143]. The EHR consists of a small heater and two thermocouples installed on the stem equidistantly, a few millimeters from the center of the heater.
T-Max Method, The Cohen’s Heat-Pulse Method
Marshall’s [
50] analytical theory was used by Cohen [
78] to develop an alternative improved heat pulse method, the T-max method, which, as opposed to other heat-pulse methods that rely on two temperature sensors or thermocouples, uses a single temperature sensor inserted downstream of the line heater. This method simultaneously measures the heatwave at several depths in the trunk by recording the time delay for a maximum temperature rise at the sensor location. A second probe located upstream of the heater serves as a reference probe to compensate for any background changes in stem temperature during the T-max measurement. SF is then determined from the time delay for a maximum temperature rise to occur at the downstream temperature sensor.
Green [
138] described the procedure used to convert raw heat-pulse data into values of volumetric SF by presenting a set of theoretical correction factors for this purpose.
The Ratio Heat Pulse Method
Miner [
79] developed the T
mRatio method using a gauge consisting of three needle probes: the central probe applies a heat pulse, one temperature probe located above the heater probe and the other placed on the side of the heater. The aim is to calculate heat pulse velocity using the ratio of the maximum temperature increase between the downstream and side probe.
The Sapflow+ Method
Vandegehuchte and Steppe [
80] developed a sap flow method that simultaneously measures sap flow density and stem water content, without disrupting the sap flow. The combination of determining heat velocity and water content results in the sap flux density values. These parameters are determined based on the conduction and convection of a short-duration heat pulse, a finite length away from an infinite line source in the anisotropic sapwood. The sensor is formed of a four-needle probe consisting of a linear heater and three measurement needles located at specific distances axially upstream, downstream, and tangentially from the heater [
80].
Measurements can be conducted at different depths to obtain a radial sap flux density profile. Therefore, heat velocity, axial, and tangential thermal conductivity, as well as volumetric heat capacity, are thus derived after fitting the correct heat conduction–convection equation to the measured temperature profiles.
Single Probe Heat Pulse Method
The authors of ref. [
81] presented and tested a new heat pulse method using a single probe, called the single probe heat pulse (SPHP) to monitor sap velocity. This method uses a single needle as opposed to the two to four needles needed in the other traditional methods. The advantages of a single-probe sensor, apart from its simplicity and smaller size, is the decreased physical damage from the insertion of the needle, the lesser thermal trauma and power requirements, in addition to the prevention of measurement errors. Nevertheless, this method was shown to be unreliable in determining low sap velocity [
81]. The authors of ref. [
144] developed an improved single probe method with finite heating duration (F-SPHP) to enlarge the SF density measurement range even at low flow rates. Compared with Sapflow+, F-SPHP needed calibration to enable water content determination. These single probe methods, combined with their simplicity and low cost, present many advantages compared to multi-probe methods [
81,
144].
Dual Heat Pulse Method
The authors of ref. [
82] validated the combination of two heat pulse techniques, HRM and CHPM, in a single set of sensor probes, the dual SF sensor. The integration of the methods allows the measurement of diverse flow ranges such as low and high flow rates, as well as reverse flows. This novel sensor proved to be effective in tracking water demands associated with changing microclimatic conditions. Nevertheless, its efficacy was limited to research purposes due to the variability of the sensors, needing to be evaluated against other techniques [
82,
136].
2.8.3. Continuous Heat
Thermal Dissipation Probe
Granier [
83] developed a simple yet accurate and low-cost constant heating method to relate the dissipation of heat to sap flux density empirically. The thermal dissipation SF meter is composed of two probes inserted radially into the xylem. One of the two probes, the thermal dissipation probe, is heated with constant energy input. In contrast, the other, the reference probe, remains unheated, i.e., keeps the same ambient temperature of the wood. Sap flux density is then calculated as a function of the temperature difference between the two probes, assuming that under thermal equilibrium conditions of the system and constant sap flux density, input of heat is equal to heat dissipated by convection and conduction [
83,
145]. This technique requires species-specific calibration to allow accurate SF measurements [
141,
146]. Alizadeh [
147] developed a new sensor that aims to overcome the limitations of the thermal dissipation probe. The novel trunk RWC sensor (TRWC) includes, in addition to the two probes, a microprocessor and data acquisition, data processing, and heater control system. The microprocessor turns the heater on and off according to temperature changes in the trunk, and then correlates the elapsed time with the water content. The TRWC is designed to reduce the effect of outside temperature.
The Heat Field Deformation Method
The heat field deformation (HFD) method [
148] enables sap flux density measurements to be made through a continuous linear heating system. This constant heating technique shows plant responses to sudden environmental changes and water stress. The sensor used comprises a needle-like heater radially inserted in the sapwood and two pairs of differential thermocouples. The lower reference thermometer of the asymmetrical pair of thermocouples is then positioned in one common needle and placed below the heater. The upper thermometer is placed next to the heater, whereas the thermometers are positioned equidistantly from the heater in the symmetrical pair of thermocouples. This placement allows simultaneous recording of the dissipation and deformation of heat in axial and tangential directions around the linear heater [
148]. The HFD method measures both asymmetrical and symmetrical temperature gradients,
dTsym and
dTas, respectively. It, therefore, eliminates any limitations in the measurements due to the separate application of thermometers as in other methods.
The
dTsym/
dTas ratio thus calculated is proportional to SF rates [
148,
149], and
dTsym is also known as the SF index, which can be used as a stress indicator [
148]. The method is designed to measure SF measurements in tree organs with a diameter greater than 3 cm, as well as those with a diameter less than 2 cm using baby sensors [
150,
151].