Early detection of people’s suspicious behaviors can aid in the prevention of crimes and make the community safer. Existing methods are mostly focused on identifying abnormal behaviors from video surveillance that are based on computer vision, which are more suitable for detecting ongoing behaviors. Due to advances in positioning technology and the increasing number of cameras, smart mobile terminals, and WLAN networks, large amounts of fine-grained personal trajectory data are collected. Such a large number of trajectories provide us with an unprecedented opportunity to automatically discover helpful knowledge, such as identifying suspicious movements and unusual activities. Therefore, crimes can be prevented if people’s suspicious behaviors can be automatically detected by mining the semantic information that is hidden in the trajectory data.
1. Introduction
There is a growing demand for community safety in cities, and predictive policing has received much attention in preventing crimes [
1,
2]. The early detection of suspicious behaviors can be used by law enforcement to efficiently deploy their resources to prevent criminal behavior [
3]. Specifically, suspicious activity is any observed behavior that could indicate a person may be involved in a crime or about to commit a crime. Nowadays, citizens are encouraged to report suspicious behaviors in their neighborhood to help the police make the community safer, such as the Neighborhood Watch Program in the United States and the Safe Residence Program operated in the Algarve [
4,
5]. However, detecting suspicious behavior through police patrol and resident reports lacks automation and is time-consuming. Current studies of people’s abnormal behavior detection have focused on identifying abnormal behaviors from video surveillance data that are based on computer vision [
6,
7]. Unfortunately, this approach is suitable for detecting ongoing violent behaviors, such as fights and brawls, but not for suspicious behaviors before committing crimes. The early detection of people’s suspicious behaviors is crucial for reducing crimes and improving the overall quality of life.
Criminology studies explain why crimes are carried out at a particular place against a specific target, providing the theoretical foundation for suspicious behavior detection. Environmental criminology, including the rational choice theory [
8], routine activity theory [
9], and situational precipitators of crime [
10], have emphasized the importance of an appropriate opportunity and a suitable target. Accordingly, the offender (e.g., theft) searches for a suitable crime scene and target to conduct criminal activities around places and the paths among them. Besides, crime studies increasingly adopt a foraging perspective when exploring criminal activities [
11]. The adopted foraging perspective emphasizes that offenders learn about their environment when committing the first offence in a particular location [
12]. The acquired knowledge reduces offenders’ uncertainty about targets. For instance, a burglar or terrorist may loiter around and repeatedly observe the intended crime scenes. Consequently, even if criminals are aware of most of their behaviors, their pre-crime activities will be unconsciously reflected in locations and trajectories [
13].
Due to advances in positioning technology and the increasing number of cameras, smart mobile terminals, and WLAN networks, large amounts of fine-grained personal trajectory data are collected. Such a large number of trajectories provide us with an unprecedented opportunity to automatically discover helpful knowledge [
14,
15], such as identifying suspicious movements and unusual activities. Therefore, crimes can be prevented if people’s suspicious behaviors can be automatically detected by mining the semantic information that is hidden in the trajectory data.
Under the pressure of safety issues, some studies have tried to develop suspicious behavior detection methods using trajectories from unusual movement patterns in recent years [
16,
17]. However, to prevent crimes, the current methods for suspicious behavior detection from trajectory data suffer from the following problems: (1) they mainly focus on abnormal moving patterns, but suspicious behaviors include not only abnormal movement patterns but also unusual behaviors such as travel at unusual times; (2) the lack of detection methods that are adapted to the complexity of suspicious behaviors in real scenes, such as leaving midway while loitering around the crime scene; and (3) just presented some case studies but lacked quantitative accuracy assessment because there is a lack of trajectory datasets for validating detection algorithms of suspicious behaviors.
2. Detection of Abnormal Trajectories Based on Outlier Detection
The main objective of outlier detection methods is to detect outlier trajectories with large local or global differences from other trajectories using a similarity metric. Outlier trajectory detection can be categorized as supervised classification-based, distance- and clustering-based, statistical model-based, and graph-based methods. The classification methods utilize labeled data for training machine learning or deep learning classifiers to classify the trajectory data. Since many labeled samples are required, and the model does not directly classify abnormal samples, this method is rarely used. The distance-based methods assume that a trajectory that is far from the other trajectories is an outlier [
19]. However, the distance-based methods require a reasonable distance threshold to identify abnormal behaviors and consequently require subjective inputs. Therefore, some researchers have proposed semi-supervised or unsupervised clustering methods using the trajectory distance for clustering [
20,
21]. These methods assume that normal samples can be clustered into several clusters, whereas samples that are difficult to classify into any cluster are abnormal. The third method is based on a statistical model to infer abnormal behaviors, which assumes that a sample is abnormal if the probability of generating its trajectory by the model is low [
22,
23]. The graph-based methods transform the trajectory into a person-place-time graph and group the nodes by their similarity for abnormal trajectory detection [
24].
The outlier detection method can effectively detect trajectories that differ significantly from other trajectories in shape or other similarity metrics. There have been various effective deep learning-based outlier detection methods in recent years [
25]. However, in detecting suspicious behaviors, the similarity measurements are not shape-based but intention-based, which leads to a vague definition and may not be appropriate for applying common trajectory mining or outlier detection methods. Moreover, the people’s behaviors before committing crimes are often complex, and a trajectory that differs from other trajectories does not necessarily indicate suspicious behavior and a threat to city safety. The detected outlier trajectory lacks semantic information, and further analysis is required. Besides, the high computational complexity and few suspicious behavior samples are key aspects, especially when the technique is applied in real-life. Therefore, it is challenging to identify suspicious behaviors that may endanger urban community safety only by using outlier detection methods.
3. Abnormal Behavior Detection Based on Trajectory Analysis
T
A total of 215 incidents of access to important areas, 130 loitering incidents, 136 incidents of aimlessly wandering, 104 frequent short stops, 592 unusual visit locations, 229 unusual routes, 220 unusual visit times, and 1 crowd gathering behavior were detected in the TucityLife dataset, the accuracies of detecting the access to important areas, loitering, aimlessly wandering, frequent short stops, and crowd gathering were verified; the results are listed in Table 1. History-based suspicious behaviors must be analyzed using long-term historical information, which are easily mislabeled in an activity log; therefore, the unusual visit location and visit time were not checked for accuracy. The accuracy of detecting the unusual routes was verified by manually comparing the regular route clusters with the unusual route; the precision is shown in Table 1. The recall rate of all the six suspicious behaviors is 93.5%, and the precision is 87.6%; the recall and precision of the individual categories are relatively high. Comparative experiments (Figure. 10) show that our method outperforms the compared methods as described in Section 4.2.3 in detecting all three suspicious behaviors. By analyzing the detected results, we found that the compared method cannot effectively identify discontinuous loitering behaviors in detecting loitering, such as leaving briefly. In the detection of aimlessly wandering and unusual route behaviors, the comparison methods were more sensitive to the noise. The results show that the proposed method could detect suspicious behaviors hidden in the massive trajectory data, providing decision support for the early detection of safety incidents. Identifying the possible offenders and potential target places in advance will play an essential role in urban safety management
Table 1. Accuracies of the detection algorithms for the suspicious behaviors
|
Type of suspicious behaviors
|
Number of logged behaviors
|
Number of detected behaviors
|
Number of correctly detected behaviors
|
Recall
|
Precision
|
F1-score
|
|
Access to important areas
|
215
|
215
|
205
|
0.953
|
0.953
|
0.953
|
|
Loitering
|
123
|
130
|
118
|
0.959
|
0.908
|
0.933
|
|
Aimlessly wandering
|
120
|
136
|
106
|
0.883
|
0.779
|
0.828
|
|
Frequent short stops
|
93
|
104
|
86
|
0.925
|
0.827
|
|
|
Unusual route
|
-
|
229
|
198
|
-
|
0.865
|
-
|
|
Crowd gathering
|
1
|
1
|
1
|
1.000
|
1.000
|
1.000
|
|
Total
|
-
|
815
|
714
|
0.935
|
0.876
|
0.905
|
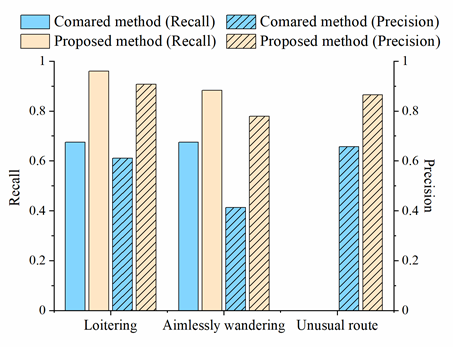
Figure 10. Comparison of the accuracy of different methods in suspicious behavior detection
This entry is adapted from the peer-reviewed paper 10.3390/ijgi11090478