The net primary productivity (NPP) of forest ecosystems is an important factor for understanding the carbon budget of forest ecosystems. There have been many studies on the spatialtemporal characteristics and change trends of the NPP in southwest areas based on observation and remote sensing models. With serious water and soil loss and rocky desertification the environment has become sensitive and fragile, so karst areas have become one of the most vulnerable ecological areas in China. The delicate ecological environment and frequent human activities make it difficult to restore the vegetation in the karst area once it is damaged; the damage affects ecosystem services and other functions and leads to fluctuations in the carbon sequestration and sink enhancement capacity in the area. Therefore, combining, analyzing and summarizing the research regarding forest NPP in karst areas is of great importance for improving the estimation accuracy and assessment of carbon storage and sequestration potential in this area.
1. Preface
Forests are an important part of terrestrial ecosystems and the main contributor to carbon sequestration. Their annual average carbon sequestration accounts for approximately 80% of total value for the whole terrestrial ecosystem in China
[1]. They play an important role in achieving carbon neutrality in China. With the continuous improvement of forest quality, the net primary productivity (NPP) and carbon sink growth potential of forests are large
[2]. Net ecosystem carbon exchange (NEE) can be defined as the difference between ecosystem NPP and its heterotrophic respiration (R
h), so the growth of NPP can reflect the growth of the carbon sink to a certain extent. Currently, China’s forest total carbon sequestration amount is 434 million tons per year, equivalent to 1.591 billion tons of CO
2, according to the report of the “China carbon emission network” (
http://www.forestry.gov.cn/ (accessed on 14 March 2021)). In 2018, China’s CO
2 emissions were 10 billion tons, and the amount of CO
2 absorbed by forests reached 15.91% in the same period, contributing greatly to carbon sequestration. This will play an important role in China’s efforts to reach the peak value of carbon dioxide emissions by 2030 and achieve carbon neutralization by 2060.
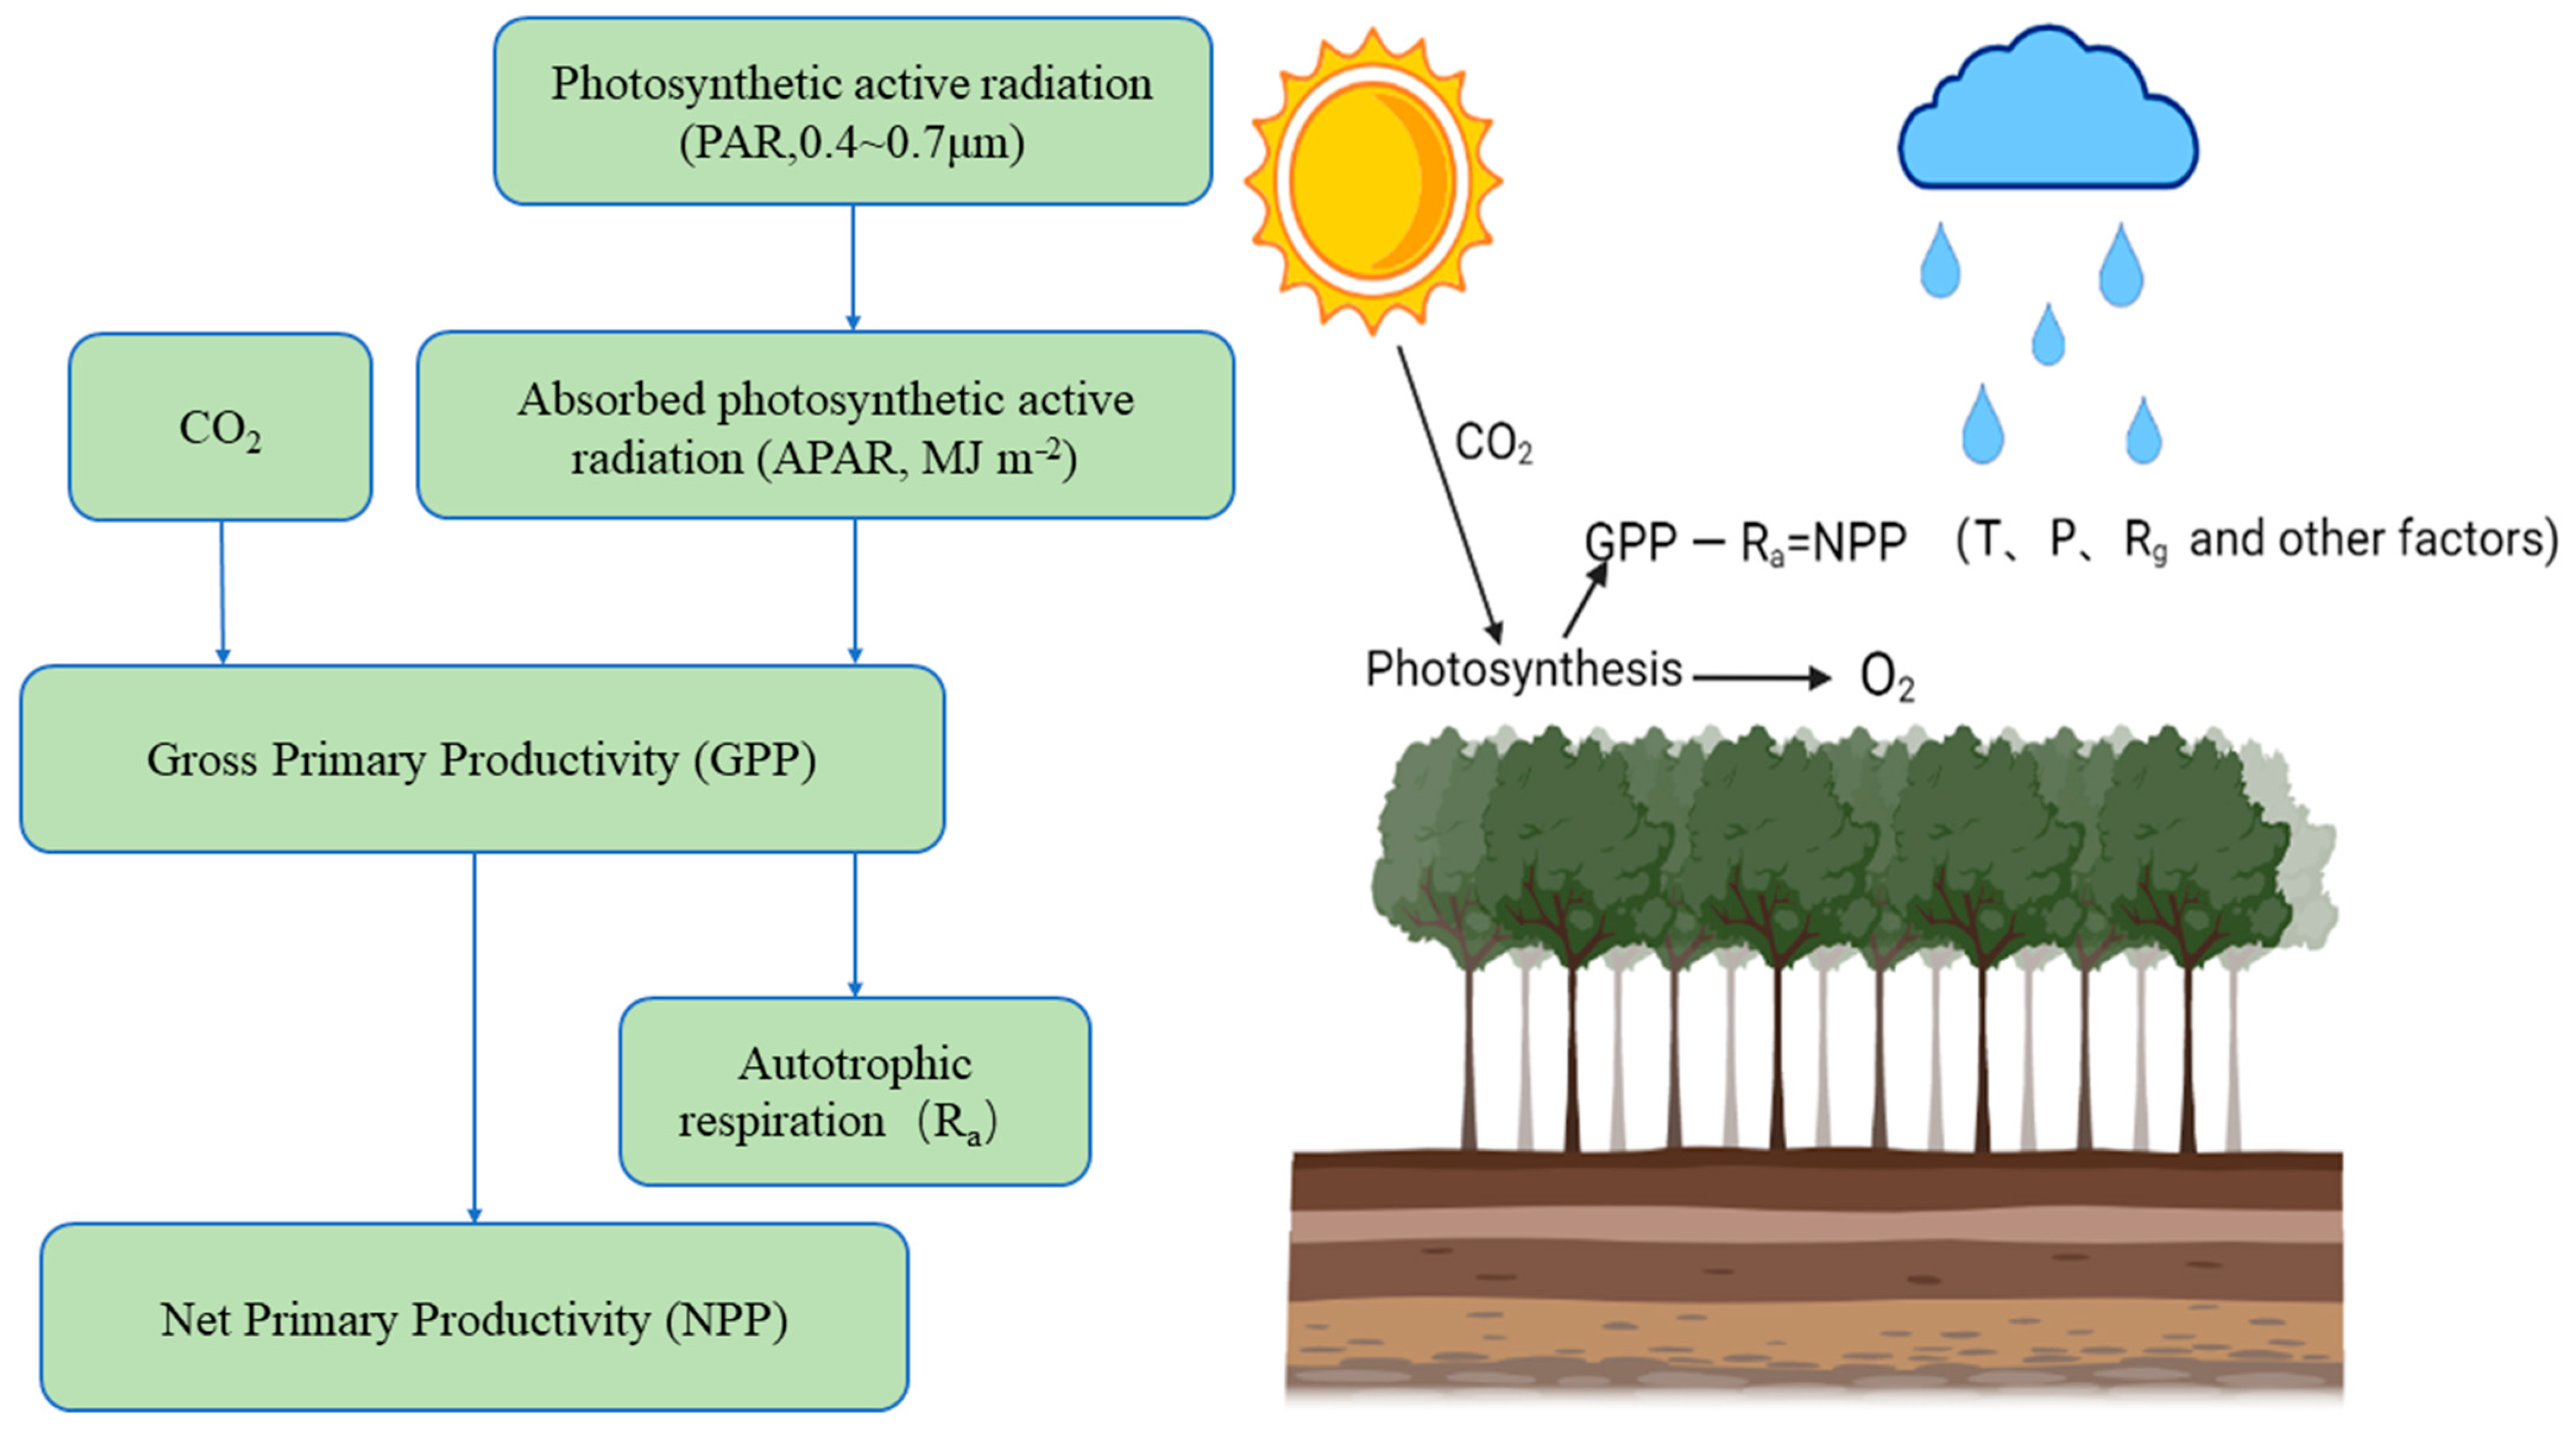
The NPP of ecosystems refers to the net content of dry organic matter produced by vegetation
[3]; it is the difference between the total amount of organic matter produced by vegetation photosynthesis and the amount of organic matter consumed by autotrophic respiration (
Figure 1). NPP represents the ability of vegetation to fix carbon. It is the ability of vegetation to use sunlight for photosynthesis (sunlight + inorganic matter + H
2O + CO
2→ heat + O
2 + C organic) and to fix and convert inorganic carbon (CO
2) into organic carbon. It is an important part of the carbon cycle. Changes in climate and other factors have a great impact on NPP. Precipitation, temperature, CO
2 concentration and changes in land cover affect physiological activities such as plant transpiration, photosynthesis and respiration, which causes changes in the NPP of terrestrial ecosystems and affects their carbon balance
[4].
Figure 1. NPP mode diagram. Solar radiation irradiates vegetation and is absorbed and reflected. The vegetation fixes CO2 as organic carbon through photosynthesis (the fixed amount of CO2 is usually expressed by the total primary productivity (GPP) minus the organic carbon consumed by autotrophic respiration (Ra), which is NPP). This process is affected by temperature (T) and precipitation (P), as well as the joint influence of climate factors such as radiation (Rg) and other environmental factors (topography, soil nutrients, CO2).
Southwest China is the second largest forest region in China
[5] and contains the largest and most typical karst forest in the country. Rain–heat synchronization, afforestation, the binary three-dimensional geological structure and large-area-distributed carbonate rocks are features of karst areas that form a unique carbon cycle and create a huge carbon sink potential; these areas play an important role in the regional and global carbon cycles
[6][7]. Based on the forest resources inventory data from 1989 to 2019 (the 4th to the 9th forest resources inventory) and the average biomass of the forest stand studied by Fang
[8], it is calculated that the forest carbon reserves in the southwest forest area have increased by 0.95 PG, the annual change rates of forest area, stock density and biomass conversion ratio are 1.79%, 0.07 and −0.05%, respectively, and the net increase of biomass carbon is 1.81%, which is equivalent to 31.95 Tg per year,
[9]. However, with serious water and soil loss and rocky desertification the environment has become sensitive and fragile, so karst areas have become one of the most vulnerable ecological areas in China
[10]. The delicate ecological environment and frequent human activities make it difficult to restore the vegetation in the karst area once it is damaged; the damage affects ecosystem services and other functions and leads to fluctuations in the carbon sequestration and sink enhancement capacity in the area. Therefore, combining, analyzing and summarizing the research regarding forest NPP in karst areas is of great importance for improving the estimation accuracy and assessment of carbon storage and sequestration potential in this area.
2. Research Progress on NPP in Karst Areas of Southwest China
2.1. Overview of NPP Research Models
Currently, NPP research methods are mainly divided into two classes: field investigation/observation and model estimation. Methods developed in the early stages of station observation, such as the sample land inventory method (direct harvesting method, etc.), aerodynamics method, biological investigation method and Eddy Covariance Technique (EC method), can directly or indirectly obtain high-precision sample NPP and provide basic parameters and verification data for the construction of an estimation model; obtaining NPP results in large areas is a challenge for these methods
[11]. The model estimation methods used to estimate large-scale NPP developed rapidly in the late 20th centuryand can be classified into three main categories: statistical models, process models and light energy utilization models. The NPP process of forest ecosystems is complex and is jointly affected by natural and human factors; the development of NPP estimation models faced major bottlenecks in terms of theory and technology
[12]. At the beginning of the 21st century, with the rapid development of remote sensing technology, large-scale and high-resolution remote sensing data became available, providing favorable conditions for the quantitative creation of the spatial–temporal features of the light energy utilization model (parameter model); it became widely used as the main method for simulating and estimating large-scale and even global NPP. Based on the respective advantages of remote sensing observations and model simulations, researchers have proposed an observation method combining plant growth models and remote sensing models, in which the remote sensing models directly drive the plant growth models, remote sensing observations and plant growth model simulation assimilation methods
[13].
2.1.1. Field Observation Method
The study of NPP at the ecosystem scale is mainly realized by field observation methods (field investigation method and Eddy Covariance Technique (EC method)). In the field survey method, the biomass of vegetation is estimated on the sample plot/site scale and then the value is extrapolated to the watershed scale. The data sources required by this method include the forest resource inventory data of the site or measured biomass (volume) sample plot data published in the literature, such as the work of Fang
[14], which is based on continuous forest resource inventory data and in which the change in wood volume is calculated. Then, the change in forest biomass carbon storage is derived from the biomass conversion equation. Another widely used NPP observation method is the EC method, which uses the micro meteorological principle to estimate the covariance of vertical wind speed and material or energy fluctuation to directly measure the energy and material exchange flux between the vegetation canopy and the atmosphere
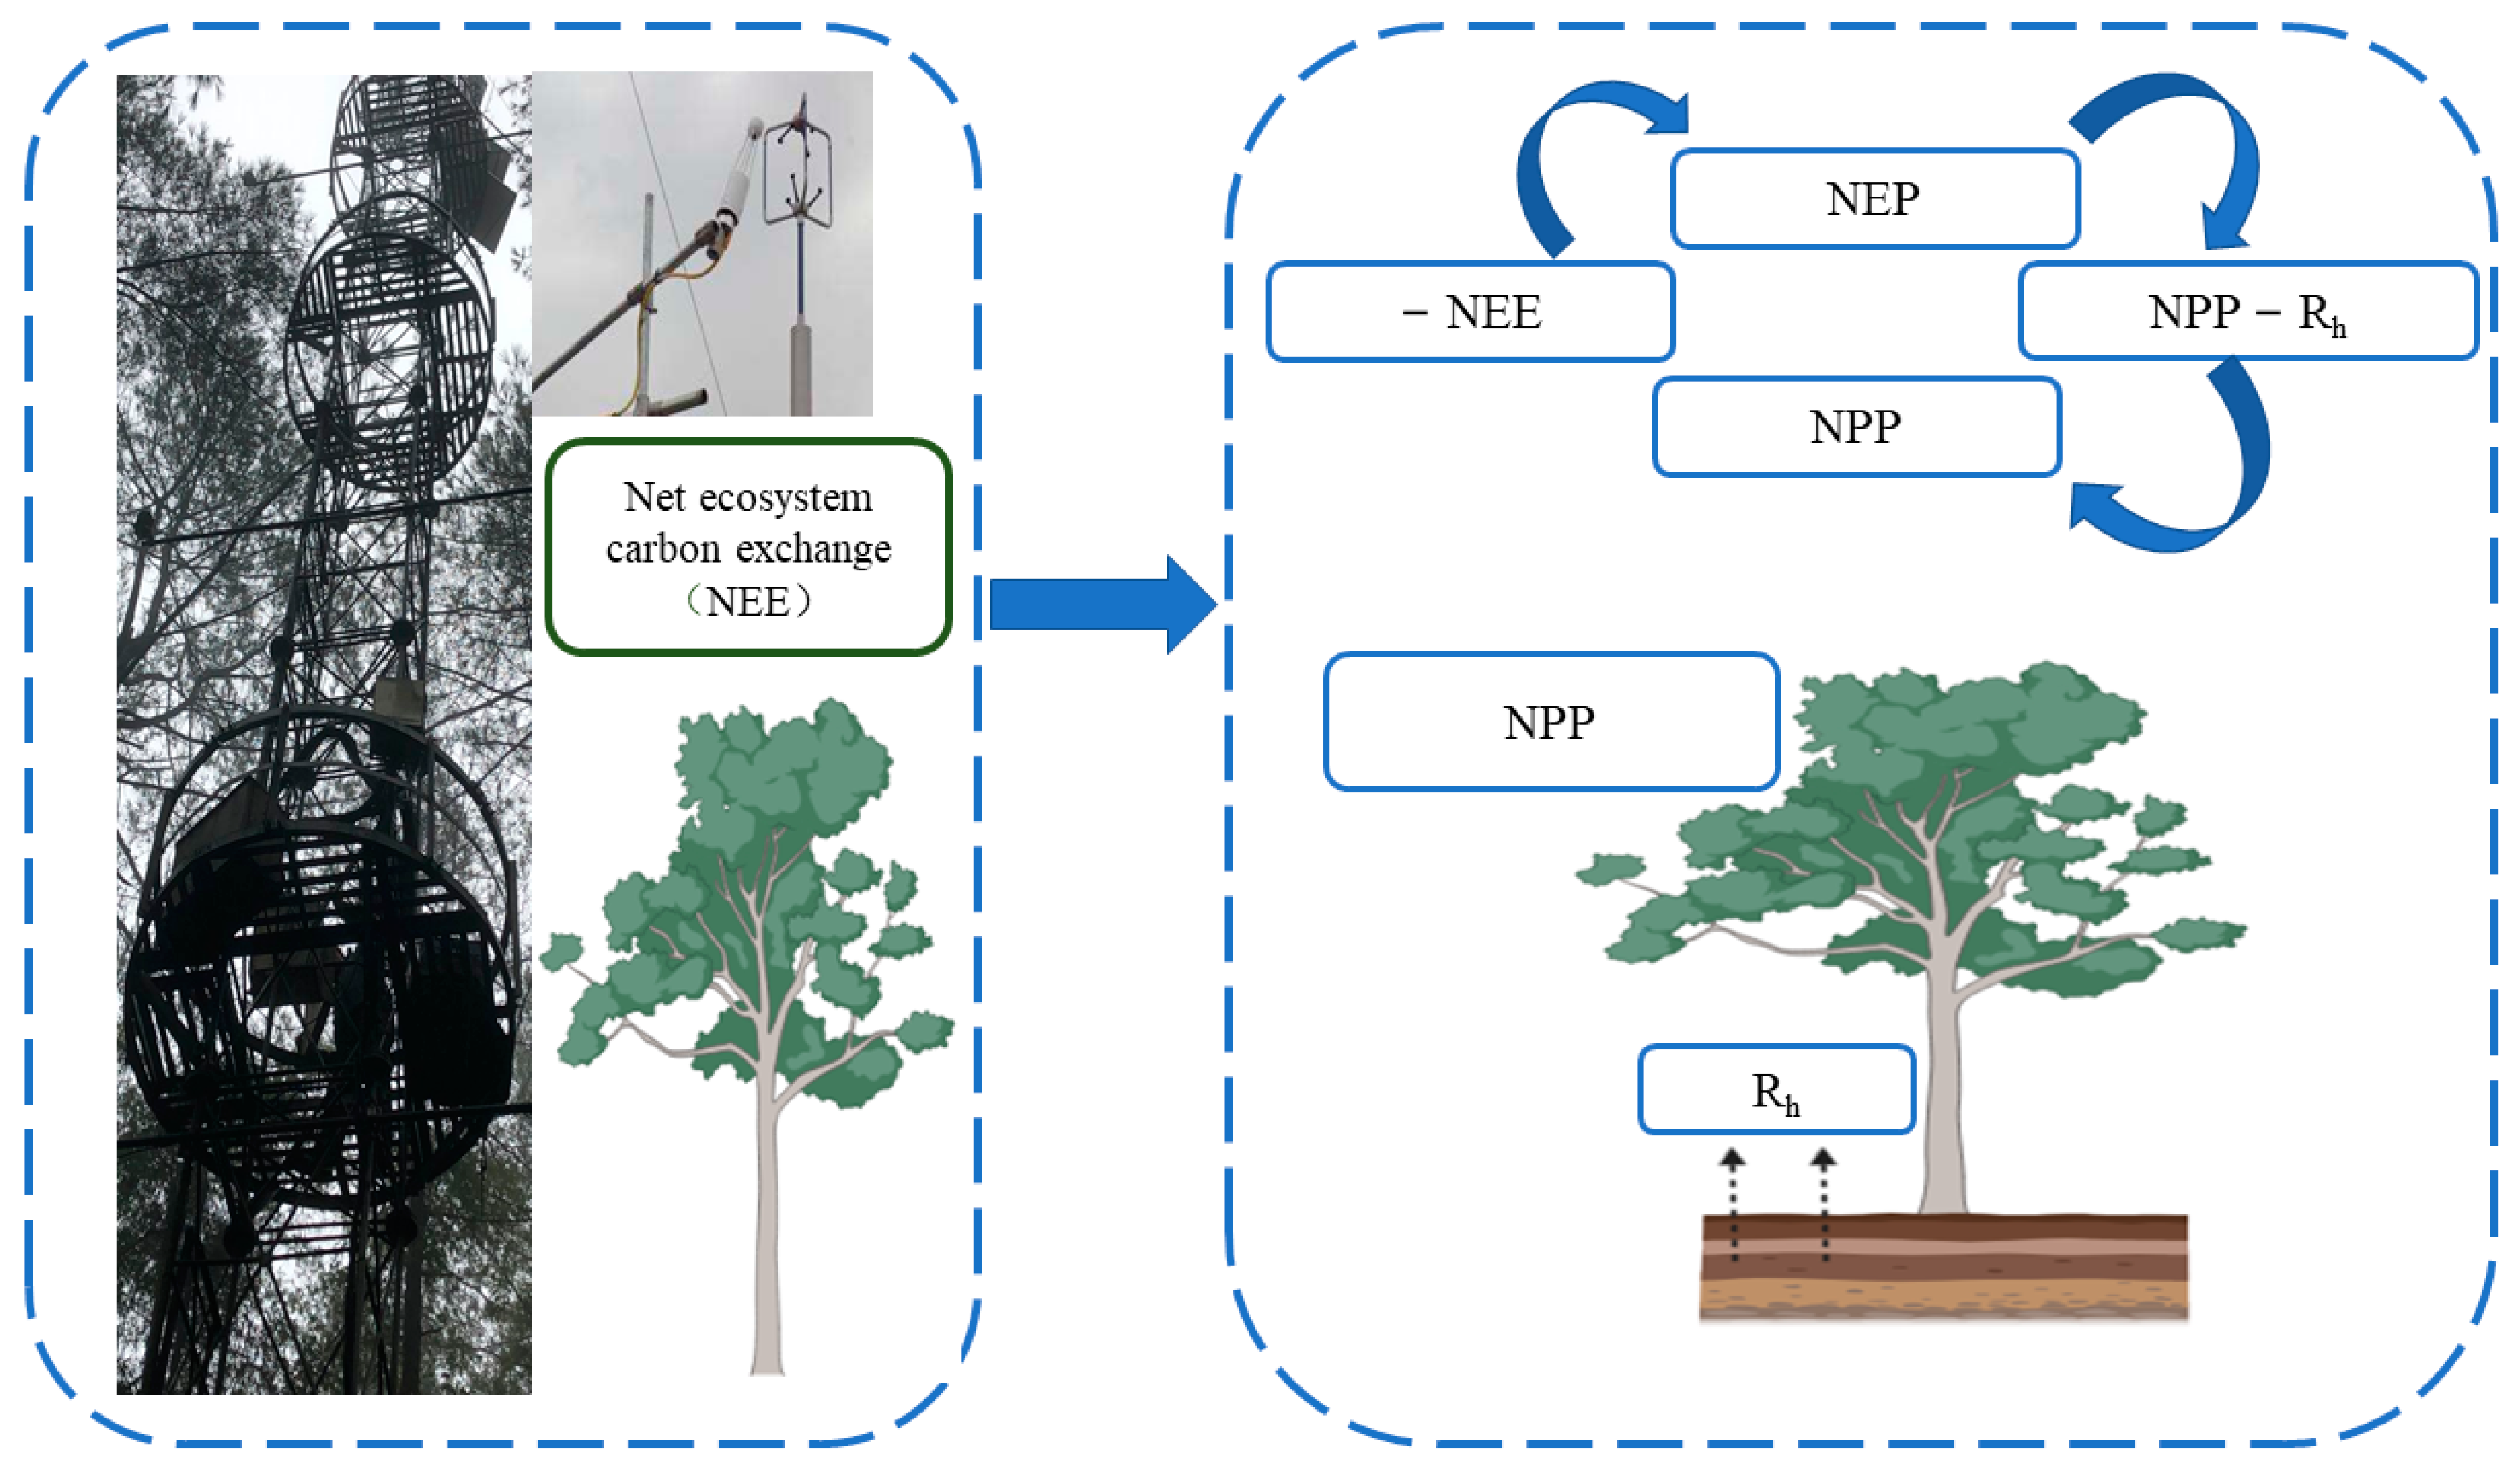
[15]. Therefore, this method can obtain NEE values and indirectly obtain NPP values through the relationship between NEE and NPP (
Figure 2). The EC method has developed into an international standard method for flux observation. Compared with conventional observation methods, it has the following main advantages: the net exchange of ecosystems measured by vorticity correlation technology is based on the integration of the whole ecosystem and atmospheric material and energy exchange
[16], and it can realize long-term continuous positioning observation of ecosystem carbon flux on a fine time scale, which is helpful for understanding the response of the carbon cycle process to environmental change and its mechanism
[17]. The main limitation is that forest ecosystem flux observation stations are often set in areas with little human impact, which makes it difficult to account for the differences in forest age and ecosystem heterogeneity, resulting in deviation in regional-scale carbon sink deduction results
[17]. Due to the large uncertainty of current remote sensing observations and model fitting methods in productivity estimation, long-term flux observation data have been used in many studies to verify these results or for model parameterization
[15].
Figure 2. The Eddy Covariance Technique is converted to an NPP schematic diagram after measuring NEE. Net primary ecosystem productivity (NEP) can be obtained by directly measuring the NEE value in the vorticity correlation system, and NEP is the difference between NPP and heterotrophic respiration (Rh). Therefore, the NPP value can be obtained by measuring NEE and heterotrophic respiration (Rh).
2.2. Response of the NPP to Climate Change in Karst Areas of Southwest China
Quantifying the relative contributions of climate change and human activities to vegetation dynamics is the key to coping with global climate change
[18]. The southwest karst region covers a vast territory with complex landforms. In addition, the influence of upper air circulation has formed a unique and diverse climate. The main part is characterized by a warm and humid subtropical monsoon climate
[19]. Climate determines the NPP of vegetation in terms of the physiological structure and processes of vegetation by changing the environmental conditions. Therefore, changes in NPP can directly reflect the response of vegetation ecosystems to environmental and climatic conditions
[20]. In general, climate factors and season length are positively correlated with NPP, while the relationship between regions is more varied
[21].
2.2.1. Effect of Temperature Change on NPP
Temperature affects the growth and metabolic rate of all organisms
[22] and affects the processes of photosynthesis and respiration. Usually, based on the remote sensing model of light energy utilization, photosynthesis (rate) rises along the temperature, but only up to certain threshold above each of which it is too hot for the plant and the rate goes down, and respiration is positively related to temperature. Most models also consider the temperature dependence of other processes, such as water balance, evaporation or decomposition rate. In addition, the model usually assumes that the minimum temperature is more important than the average temperature
[23]. The impact of temperature on forest NPP is complex. Temperature rise simultaneously controls the two processes of vegetation photosynthesis and respiration. The impact on these two processes determines the increase or decrease in ecosystem NPP; that is, there are both positive and negative effects.
On the one hand, the increase in temperature will increase the respiration of forest vegetation, consume dry matter, and reduce the NPP value. At the same time, the increase in temperature will increase the transpiration of vegetation and affect the growth and development of vegetation. For example, in some areas of southeast Yunnan and central Guangxi, the temperature is negatively correlated with the vegetation coverage. The lack of surface water and the increase in temperature aggravates the surface evaporation in this area, thus inhibiting vegetation growth
[24]. In the south of the Hengduan Mountain, when the temperature rises and the precipitation remains unchanged, the NPP shows a downwards trend
[25]. The NDVI values of coniferous forests in Yunnan Province are significantly negatively correlated with air temperature
[26].
On the other hand, with the increase in temperature, the enzyme activity of photosynthesis in plants is enhanced, and the photosynthetic efficiency of vegetation is improved, which promotes the growth of vegetation and improves the NPP of vegetation
[27]. The growth of many middle- and high-latitude forests is limited by the nitrogen supply to some extent, and warming can lead to an increase in soil nitrogen availability, which may also indirectly promote an increase in forest vegetation productivity. There are many reports on the promoting effect of warming on the NPP. For example, in March and April, when the temperature is ≥10 °C, plants begin to grow and the NPP in Guizhou Province begins to increase gradually. In summer (June–August), before the end of June, all parts of Guizhou experience the first day of temperatures ≥20 °C, and the vegetation enters a rapid growth period. From July to August, the average temperature in Guizhou is approximately 20 to 28 °C, depending on the altitude. The vegetation enters a high-speed growth period, and the NPP value reaches the maximum value in a year
[28]. On a monthly scale, temperature is the controlling factor of the NPP in humid and semi-humid regions
[29].
Temperature is one of the main climatic factors driving changes in the NPP, with obvious seasonal variation. In high latitudes, vegetation growth is periodic, and in humid and semi-humid areas, temperature promotes NPP growth by promoting photosynthesis of vegetation and the release of nutrients in soil. When the temperature is too high, it aggravates the transpiration of vegetation and decreases the NPP.
2.2.2. Impact of Precipitation Change on NPP
The distribution pattern of forest productivity in China mainly depends on the hydrothermal conditions in the climatic environment, and the moisture conditions play a decisive role in determining the level of forest productivity in most regions of China
[30]. Most of the karst areas in southwest China are monsoon climate areas, with abundant annual precipitation. Most areas have an annual precipitation between 1000 and 1600 mm, and some areas have an annual precipitation between 1800 and 2000 mm; the annual average relative humidity is 75% to 80%. The region has the distribution characteristics of hydrothermal and thermal synchronization, but the spatial and temporal distribution of precipitation is extremely uneven. In response to water stress or high temperature, the stomata of leaves will partially close, to prevent excessive transpiration of water, thus limiting the entry of CO
2 into the plant through the stomata, reducing the concentration of CO
2 between mesophyll cells. This results in an increase in the content of solute in the plant and a decrease in the stomatal conductance of leaves, leading to a weakening of light cooperation, thus affecting the growth and development of vegetation and the accumulation of dry matter
[31]. Although the temperature in different vegetation distribution areas in southwest China has increased to varying degrees, the change trend of forest NPP is consistent with the change trend of precipitation in vegetation distribution areas
[32]. For example, in the southern part of the Hengduan Mountain, under the condition of constant temperature, the change trend of NPP is consistent with that of precipitation, indicating that precipitation is the dominant factor affecting the change in the NPP in this region
[25]. In the two decades from 1981 to 2000, forests were widely distributed in the southwestern region. The temperature rise rate was 0.037 °C/year, the precipitation change trend was not obvious, and the NPP of forest vegetation did not exhibit an obvious change trend
[32]. From 2000 to 2011, the average temperature in Sichuan was 12.3 °C, and the annual average precipitation was 732.4 mm. From 1981 to 2000, the annual average temperature was 12.3 °C and the average annual precipitation was 976.0 mm. The average annual temperature was relatively stable, and the precipitation decreased significantly. At the same time, the coefficient of variability obtained from the correlation analysis between NPP and precipitation reached 83.4%, indicating that precipitation was the main driving factor affecting the change in the NPP of vegetation in Sichuan Province
[33]. In addition, the impact of precipitation on the NPP was due to the effects of dry and wet environments of vegetation. For example, during the drought events in southwest China from 2009 to 2010, the NDVI value of vegetation exhibited a general downward trend in the region, especially in southwest Yunnan and Guizhou
[34], which corresponded to the general downward trend of NPP in this region as a result of precipitation changes.
Precipitations is one of the main climatic factors driving changes in the NPP. NPP can be promoted in the vegetation growth period and in arid areas, as seen in the drought from 2009 to 2010. However, the southwest karst region is located in the subtropical monsoon region. Although the rainfall (1000–2000 mm) is relatively low, the water stress effect caused by engineering water shortages caused by karst landforms and their impact on the NPP are very worthy of attention and research.
3. Current Situation and Change Trend of the NPP of Forest Ecosystems in Karst Areas
The terrain of southwest China is inclined from southeast to northwest and includes mostly mountainous and hilly landforms. The region is rich in forestry resources and is an important forest resource zone in China
[35]. At the end of the 20th century, the planting of fast-growing forests (mainly eucalyptus, poplar and pine) was promoted in the region, the vegetation coverage increased (the forest area in Southwest China accounted for 47.6% of the total land area in 2018), and the NPP and carbon reserves in the region also increased. From 2001 to 2018, the NPP of vegetation in southwest China fluctuated significantly. The highest annual average value of NPP occurred in 2015, which was 752.55 gC/m
2·a, the lowest value occurred in 2004, which was 668.21 gC/m
2·a, and the multiyear average value was 710.44 gC/m
2·a. In terms of spatial distribution, it was high in the south and low in the north, and there were great differences among different provinces, Yunnan (989.63 gC/m
2·a) > Guizhou (773 gC/m
2·a) > Chongqing (597.2 gC/m
2·a) > Sichuan (496.27 gC/m
2·a)
[36].
For the study of the forest NPP in Southwest China, the vegetation was mainly classified into coniferous forest, broad-leaved forest and coniferous broad-leaved mixed forest
[36][37]. However, most NPP studies in Southwest China focused on the overall vegetation NPP, while little information was reported regarding the total NPP of forests and the NPP of different types of forest vegetation. Based on previous research results, in this entry, researchers classified and summarized the annual average NPP of different regions in Southwest China, as well as that of major forest vegetation types in China (
Table 1), along with the annual average total NPP of forests (
Table 2). The results showed that the annual average NPP of evergreen broad-leaved forests was the highest in all regions of Southwest China, and even in the entire country, due to the long growth cycle of evergreens and the long duration of light and action. The annual average NPP of mixed forests and coniferous forests were ranked second and third. However, the NPP of the evergreen broad-leaved forest in the Qinba Mountain area was slightly lower than that of the evergreen coniferous forest, mainly because the evergreen broad-leaved forest is better suited for growing in subtropical areas, while the Qinba Mountain area is at the intersection of subtropical and warm temperate zones. Compared with subtropical areas with lower latitudes, the subtropical climate characteristics in the Qinba Mountain area are relatively weak, affecting the growth of evergreen broad-leaved forests
[36][38]. From the perspective of the average value of total forest NPP, all the southwestern provinces, except Sichuan Province, exceed the national average value of forest vegetation, of which Guizhou Province has the highest average value (1100.31 ± 6.39 gC/m
2·a), and Yunnan Province does not include tropical rainforest, so the average value is low.
Table 1. Summary of the annual average NPP of different forest vegetation types in Southwest China and China.
| Region |
Year |
NPP(gC/m2·a) |
Reference |
| Broad-Leaf Evergreen Forests |
Broad-Leaf Deciduous Forests |
Needle-Leaf Evergreen Forests |
Needle-Leaf Deciduous Forests |
Needle-Leaf and Broad-Leaf Mixed Forests |
| Yunnan Province |
1982–2014 |
996 |
778 |
/ |
536 |
/ |
[39] |
| Chongqing Province |
2001–2011 |
830.4 |
726.74 |
663.51 |
525.81 |
/ |
[40] |
| Yunnan Province |
1981–2000 |
1000 |
/ |
/ |
/ |
400~800 |
[32] |
| Southwest China |
1982–2006 |
925.29 |
/ |
911.01 |
/ |
976.45 |
[41] |
| Qinba Mountain |
2000–2015 |
554.71 |
445.67 |
557.97 |
463.00 |
483.49 |
[42] |
| China |
1982–2015 |
1323.71 |
637.21 |
497.59 |
442.35 |
832.06 |
[43] |
Table 2. Summary of the annual average NPP of forests in Southwest China and China.
| Region |
Year |
NPP gC/m2·a |
Reference |
| Yunnan Guizhou Plateau |
2000–2014 |
875.69 |
[44] |
| Guangxi Province |
1989–1993 |
1000.3 ± 5.97 |
[45] |
| Guizhou Province |
1989–1993 |
1100.31 ± 6.39 |
[45] |
| Sichuan Province |
1989–1993 |
600.35 ± 3.40 |
[45] |
| Yunnan Province |
1989–1993 |
700.75 ± 4.88 |
[45] |
| China |
1982–2015 |
650.73 |
[43] |
For the estimation of the annual average NPP of common forest vegetation in Southwest China, the research results of different scholars are different (
Table 3). Based on forest inventory data, Yu estimated that the average NPP in southwest China from 1989 to 1993 was 9.64 t·ha
−1year
−1, of which the annual average NPP of evergreen broad-leaved forest was the highest
[45]; Ni calculated the annual average NPP of different forest vegetation types according to Luo’s data from 1989 to 1993
[46][47]; Liu summarized the literature published from 1982 to early 2013 and summarized the annual average NPP of different forest vegetation types in Southwest China
[37]. Liu’s annual average NPP is much lower than that of Weilian and Ni because the latter adopts the combination of forest inventory and field investigation.
Table 3. Summary of the annual average NPP of common forest vegetation in Southwest China.
| Vegetation Type |
NPP(t·ha−1year−1) |
|
| [45] |
[46] |
[37] |
| Broad-leaf evergreen forests |
25.4 |
21.9 ± 5.3 |
17.6 ± 7.2 |
| Needle-leaf evergreen forests |
18.66 |
13.5 ± 3.0 |
12.1 ± 6.5 |
| Needle-leaf and broad-leaf mixed forests |
/ |
9.9 ± 5.0 |
9.0 ± 5.0 |
| Tropical rainforest |
16.85 |
27.1 ± 9.2 |
20.9 ± 6.7 |
| Needle-leaf deciduous and broad-leaf mixed forests |
/ |
15.2 ± 3.0 |
11.9 ± 2.4 |
In conclusion, the spatial distribution of vegetation NPP in Southwest China is related to the regional hydrothermal conditions and the zonal distribution of vegetation types. The highest NPP of forest vegetation in Southwest China is broad-leaved forest, followed by mixed forest and coniferous forest. From the distribution pattern, Yunnan has better hydrothermal conditions, with the highest NPP (989.63 gC/m2·a) in Yunnan and the lowest NPP (496.27 gC/m2·a) in Sichuan. Moreover, the forest NPP of Yunnan Province and Guizhou Province exceeded the national average of forest NPP.
This entry is adapted from the peer-reviewed paper 10.3390/f13091367