Your browser does not fully support modern features. Please upgrade for a smoother experience.
Please note this is an old version of this entry, which may differ significantly from the current revision.
Subjects:
Engineering, Electrical & Electronic
The idea of using a vacuum as an insulating medium is to take advantage of the fact that when the gas pressure is reduced to a value at which the average free paths of molecules and electrons are greater than the contact gap in the insulating system, the development of electron avalanches that initiate discharges in gases is impossible.
- noble gases
- electrical strength
- electrical breakdown initiation
- glow discharges
1. Current Research Directions Related to Low Pressure Gas Discharges
In recent decades, there has been considerable interest in the use of vacuum technology as an insulating medium in power switchgear. Despite many scientific studies, the physical aspects of discharges in vacuum insulation systems are still of interest to researchers worldwide.
Most of the available scientific work related to low-pressure gas discharges relates to studies carried out using direct voltage (DC)-powered stations [1,2,3,4,5], as well as combinations of direct and alternating voltage (AC) systems [6,7]. This work is primarily concerned with the measurement of breakdown voltages in environments of different types of gases, with different configurations of the contact systems, with an emphasis on the physical aspects of the observed and measured phenomena.
However, the scientific works cited above cover the pressure range, including the right and left branches of the Paschen curves along with the so-called “well” of these curves. The authors of this paper have focused on lower pressure values (higher vacuum) at which the electric strength reaches a constant value and the strength curve flattens out. At such pressure values, the probability of the development of electron avalanches at the initiation of an electrical breakdown is significantly reduced.
The research carried out by the authors was conducted with a view to industrial applications in vacuum switchgear, and therefore the test rig was powered by an alternating test voltage (AC) with a mains frequency of 50 Hz, which is new compared to the abovementioned works.
In terms of industrial applications, recent publications in the scientific area under review are mainly concerned with insulating alternatives to harmful sulfur hexafluoride (SF6) and the detailed analysis of electric arc burning processes in vacuum [8,9,10,11,12]. In addition to the commonly produced extinguishing chambers based on vacuum or sulfur hexafluoride, mixtures of SF6 gas with nitrogen, in the ratio of 40% SF6 and 60% N2, are currently encountered. The projected direction of research on the application of electro-insulation gases in vacuum interrupters mainly involve mixtures of sulfur hexafluoride with helium, argon, nitrogen, tetrafluoromethane (CF4), or hexafluoroethane (C2F6) [13]. Both sulfur hexafluoride and the aforementioned perfluorocarbons increase their temperature while residing in the atmosphere and thus create a greenhouse effect. This is evidenced, among others, by the GWP index (greenhouse effect potential), which is 22,200 for SF6, 5700 for CF4, and 9200 for C2F6 [14].
2. Analysis of Discharge Development in the Environment of Selected Noble Gases
The value of the mean free path of molecules in a gas can be calculated using the following relationship [15]:
The average free path of electrons in the considered gas can be determined in a similar way [15]:
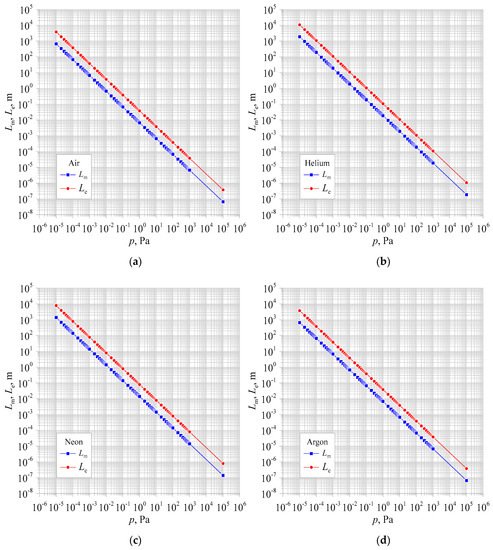
Using the above relationships, the average free paths of Lm molecules and Le electrons in the gases used in this study (air, helium, neon, argon) were calculated. The temperature T = 293 K was assumed for the calculations. The characteristics of Lm and Le as a function of the pressure of the selected gas are shown in Figure 1a–d. The values of the mean free paths were calculated for gas pressures p ranging from 10−5 Pa to 105 Pa.

Figure 1. Dependence of mean free paths of molecules and electrons as a function of pressure of selected gases: (a) air, (b) helium, (c) neon, (d) argon.
On the basis of Equations (1) and (2) and the following figures it can be stated that the larger the diameter of the molecule of the studied gas, the smaller the value of the average free path of electrons and molecules at a given gas pressure. Among the noble gases analyzed, helium has the smallest particle diameter, while argon has the largest [16]. Therefore, at the selected pressure value, electrons and helium molecules will travel the longest distance between subsequent collisions, in contrast to argon, where the distance travelled by electrons and molecules between subsequent collisions will be the shortest among the noble gases analyzed.
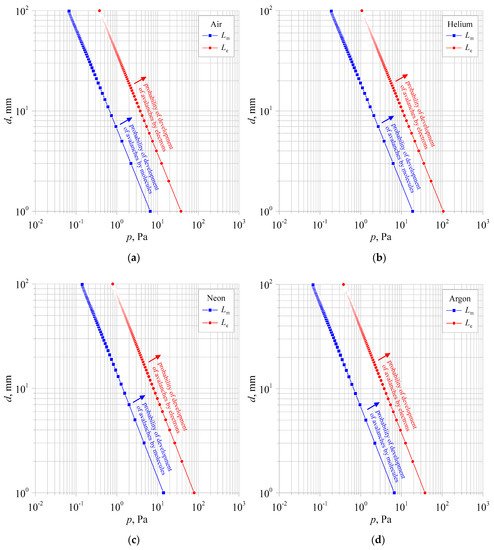
However, it is crucial to determine the pressure value at which the mean free path is equal to the contact gap value set in the study. Figure 2a–d show the calculated values of the mean free paths of molecules Lm and electrons Le, which are equal to the values of the contact gaps d at the selected pressure value p. The calculations were performed based on the following relationships:

Figure 2. Characteristics to determine the value of pressure p at which the mean free paths of molecules Lm and electrons Le are equal to the contact gap d in the environment of selected gases: (a) air, (b) helium, (c) neon, (d) argon.
At values below the pressure p values read from the curves for a given contact gap d equal to the mean free path Lm and Le, the probability of avalanches developing and initiating a breakdown in a vacuum environment with residual gases in the form of air, helium, argon or neon decreases until it becomes impossible. In this situation, each particle and each electron will travel the contact gap without colliding.
This paper presents the results of electrical strength tests at varying residual gas pressures for two contact gaps d = 1 mm and d = 2 mm, for which the limiting pressure was calculated, below which the development of avalanches initiating the breakdown is impossible. These values are summarized in Table 1.
Table 1. Summary of pressure values at which the mean free paths of electrons and molecules equal the contact gap tested.
| Residual Gas Type | d = 1 mm | d = 2 mm | ||
|---|---|---|---|---|
| p(d=Lm) | p(d=Le) | p(d=Lm) | p(d=Le) | |
| Air | 6.66 × 100 Pa | 3.77 × 101 Pa | 3.33 × 100 Pa | 1.88 × 101 Pa |
| Helium | 1.88 × 101 Pa | 1.07 × 10² Pa | 9.41 × 100 Pa | 5.33 × 101 Pa |
| Argon | 6.69 × 100 Pa | 3.79 × 101 Pa | 3.35 × 100 Pa | 1.89 × 101 Pa |
| Neon | 1.40 × 101 Pa | 7.93 × 101 Pa | 7.01 × 100 Pa | 3.97 × 101 Pa |
The change in the mechanisms of initiation and development of discharges in the studied gases occur at the highest values of pressure in the case of helium, while in the case of argon they occur at the lowest. This is also due, as in the case of mean free paths, to the geometric dimensions of the molecules of the selected gas.
In a vacuum environment, where collisions between electrons do not occur, it is possible to calculate the kinetic energy of an electron that has traveled without collisions between electrodes to which a voltage of U has been applied [15]:
From the above relationship, the velocity of the electron in the free state can be determined:
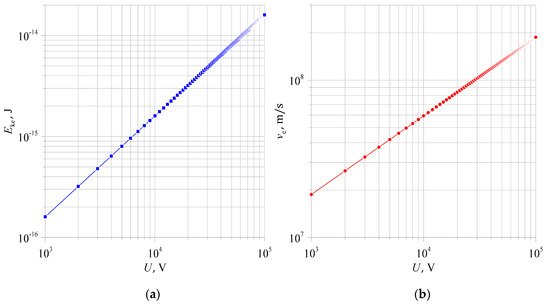
On the basis of Equations (5) and (6), the dependence of the kinetic energy of the electron and its velocity as a function of the voltage applied to the electrodes was plotted. The obtained characteristics are shown in Figure 3 and Figure 4.

Figure 3. The dependence of: (a) electron kinetic energy Eke and (b) electron velocity 𝜐e as a function of voltage U applied to the electrodes.
The values of the electron kinetic energy Eke and its velocity 𝜐e were calculated for a voltage range U in the range 103 ÷ 105 kV. The higher the supply voltage, the higher the velocity and kinetic energy of the electron will be. For example, when a voltage of 20 kV is applied to the test system, in a vacuum insulating system, where the electron will travel through a contact gap d without collisions, it will acquire a kinetic energy equal to Eke = 3.20 × 10⁻¹⁵ J and a velocity equal to 𝜐e = 8.39 × 10⁷ m/s.
When the pressure values are below those summarized in Table 1, the initiation and development of the discharge between the electrodes are made possible by physical phenomena other than those responsible for the breakdown above the summarized values. Over the years, scholars working on the subject of discharges in vacuum media have developed many hypotheses of the mechanism of initiation and development of discharges in systems of this type.
3. Initiation of an Electrical Discharge in a Vacuum at AC Voltage
When considering the processes of breakdown initiation in vacuum insulating systems at AC voltage, two variants of the conducted measurements should be considered [17].
In the first case, the rate of voltage buildup is of such a high value that field desorption of gases from the electrodes takes place, and thus conditions will occur in the system that initiate a breakdown by the desorption mechanism. In this situation, the discharge develops in dilute gases from the field desorption process from the surface of the electrodes. This discharge results in a further desorption process and melting and evaporation of the electrode material. The end result is the occurrence of breakdowns, as a result of which the electrodes suffer mechanical damage through the generation of micro-arrows with values greater than 1 µm. The micro-roughness of such dimensions emits electron beams, so that breakdown initiation occurs via field emission [18,19,20].
In the second case, the voltage buildup rate is characterized by such a small value that the pumping system is able to remove the desorbed gases from the interstitial space. Consequently, the development of a discharge in these residual gases will not be possible due to their insufficient quantity. Over time, as a result of field desorption and electron and ion bombardment, the electrode surfaces will be stripped of most of the adsorbed gases. At this stage, there are micro-discharges in the system [21], which will decrease with the gradual cleaning of the electrodes. In such a case, due to the very small values of the micro-caustics present on the electrode surfaces, the field emission electron current is practically unmeasurable. The situation changes when the system voltage is raised further, because the field emission electron current suddenly appears in the system, which exceeds the sensitivity of the measuring system. When the voltage is lowered and then increased, this current also decreases and then increases gradually in a measurable manner.
When comparing electrical breakdown initiation at DC voltage and AC voltage, it is important to note the transfer of microparticles between the electrodes to which the voltage is applied. In the case of DC voltage, the microparticles mainly come from the anode area, so the direction of electrode material transfer occurs from the anode to the cathode. This shows that the temperature of the anode area bombarded by electrons emitted from the cathode is much higher than the temperature of the tips of the electron-emitting microparticles. The electrostatic forces in this case act equally on each electrode.
In the case of AC voltage with frequencies of 50 Hz and 60 Hz, the breakdown voltage reaches higher values compared to DC voltage [22]. In the case of AC voltage, where the voltage varies cyclically, material transfer occurs in both directions from one electrode to the other. Thus, the electrode surfaces undergo more distortion than in the case of DC voltage. With this type of insulating system, there is an additional factor associated with mechanical stress by the periodically varying electrostatic force. This stress, which is equal to the electrostatic pressure, is determined by the formula [15]:
Thus, this force is a pulse cycle with a frequency equal to twice the frequency of the voltage supplying the system. This causes fatigue in the material, so that the mechanical strength is reduced to a value called the long-term fatigue strength. The highest electric field strength, and thus mechanical stress occurs near the tips of the microblades located on the electrode surfaces. The cyclic heating and cooling of the micro-cutting edge reduces the mechanical strength of its material, and in some cases, it drops well below the long-term fatigue strength. Despite this, some microblades continue to emit electrons in a stable manner, and thus their mechanical strength is higher than that reported in the material tables. This paradox can be explained by the fact that the effective field of an electron beam-emitting microblade can range from about 10−17 to 10−15 m2 (about 100 to about 10,000 metal atoms arranged side by side). Since the concentration of defects in metals is low, there is a high probability that the microblade-tip material does not have a defect. These types of microblades are stable electron emitters, unlike micro blades that have defects. These microblades can be detached by electrostatic forces and become charged microparticles moving toward an electrode of opposite polarity.
On the basis of research conducted over the last few decades, a model for the initiation of a breakdown at AC mains frequency has emerged, which states that with slow voltage build-up, the electrode surfaces are freed from most of the adsorbed gases. Nevertheless, due to the continuous removal of desorbed gases by the pumping system, the development of a discharge is not possible. In addition to the occurrence of gas desorption from the electrodes, a periodically varying electrostatic force acts on the electrode surfaces, causing mechanical fatigue of the stressed material accompanied by thermal fatigue. Over time, fatigue scrap occurs, which when detached from the electrode, becomes a charged microparticle moving in an accelerated motion towards the opposite electrode. If the microparticle acquires sufficient kinetic energy, it will strike the electrode and produce a crater on its surface. The significant height and sharp edges of the produced crater are good electron emitters, so that the field emission electron current increases in the system. In the meantime, more craters may form on the electrode and thus cause a further increase in current. When the amplitude of this current exceeds a certain value, the limiting temperature in the anode region is also exceeded and the discharge develops according to the anode mechanism [23,24,25].
After analyzing the presented breakdown initiation mechanism, it can be concluded that the increase in the electrical strength of the vacuum insulating system at AC voltage is possible by reducing the field emission electron current in the system. This can be done by preventing the formation of micro-sharpeners on the electrode surfaces, using thin coatings to suppress the field emission of electrons from the electrode surfaces, and performing conditioning processes [26,27,28].
This entry is adapted from the peer-reviewed paper 10.3390/en15031154
This entry is offline, you can click here to edit this entry!
