Your browser does not fully support modern features. Please upgrade for a smoother experience.
Please note this is an old version of this entry, which may differ significantly from the current revision.
Subjects:
Oncology
Multiplex imaging techniques and digital image analysis are powerful tools that could overcome some issues concerning tumour-microenvironment studies. This novel approach to biomarker assessment offers a better understanding of the complicated interactions between tumour cells and their environment. Multiplex labelling enables the detection of multiple markers simultaneously and the exploration of their spatial organisation.
- immune profiling
- multiplex
- image analysis
- PD-L1
1. Introduction
The mIHC/IF techniques can be divided into (i) chromogenic-based, (ii) fluorescence-based, (iii) metal-based, and (iv) DNA-barcoding-based methods [27]. The principles of each method are described graphically in Figure 1 below.
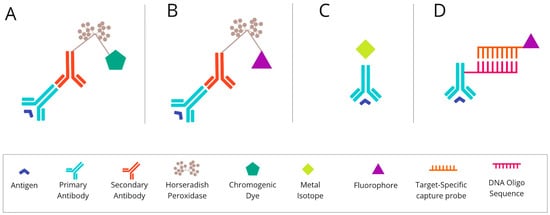
Figure 1. The basic mechanism of each of the mIHC/IF techniques. (A) Chromogenic-based: antigen-specific primary antibody is bound to a secondary antibody, conjugated with HRP enzymes labelled with chromogen. (B) Fluorescence-based: antigen-specific primary antibody is attached to a secondary antibody conjugated with HRP enzymes. Detection is achieved using the fluorophore-labelled HRP substrate, tyramide. (C) Metal-based: a primary antibody bound to the target antigen is labelled with an isotopically pure metal-chelator tag. (D) DNA-barcoding-based: a primary antibody bound to the target antigen is labelled with a unique DNA oligonucleotide tag. Subsequently, a complementary strand of DNA coupled to a specific fluorophore is attached. Abbreviations: mIHC/IF—multiplex immunohistochemistry/immunofluorescence; HRP—horseradish peroxidase; IHC—immunohistochemistry.
2. Chromogenic-Based mIHC Is Widely Based on Immunohistochemical (Standard Single-Antibody Chromogenic Immunohistochemistry) Technologies
One of the most common diagnostic methods is the standard IHC. The IHC technique detects cell proteins using specific antibodies as a result of the antigen–antibody reaction. The necessary steps to perform IHC staining are as follows. Fixed tissue samples are embedded in paraffin, or rarely, frozen when there is no other possibility. The biopsies are thinly sliced (3–5 µm), placed on glass slides, and dried. Subsequently, the antigen discovery procedure is performed to improve protein identification by the antibody. The general purposes of epitope retrieval are the denaturation of proteins, the removal of methylene bridges, and the minimisation of chemical forces, which may interfere with the antigen measured. However, the methods of epitope recovery rely mainly on delivering energy to the tissue in the process of heating in a buffer, commonly based on citrate, or on high- or low-pH liquid. The next stage is to prevent non-specific staining by carrying out two blocking steps based on either horseradish peroxidase (HRP) or serum-free protein [28,29].
Once the blocking step has occurred, the sample is incubated with the proper antibody. The antibody should be at the correct concentration in order to retain the specificity of the staining without any background interference. Then, the tissue material is incubated with the secondary antibody to visualise the binding to the primary antibody. These systems are most often based on anti-mouse or anti-rabbit polymers, which are conjugated by HRP enzymes. The detection system in chromogenic tests relies on the colour reaction of the enzyme-labelled complex with the chromogen. For these assays, the chromogen is 3,3′-diaminobenzidine, the oxidation of which causes the formation of a brown-coloured product. Another widely used chromogen is 3-Amino-9-ethylcarbazole (AEC). It appears as a red colour on a tissue and becomes discoloured in organic solvents. The final steps concern the procedure of counterstaining, which can bring out other structures in the coverslip application [30,31]. An overview of chromogenic-based mIHC is presented in Figure 2.
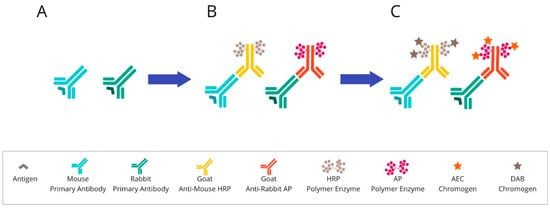
Figure 2. Overview of chromogenic-based mIHC: (A) After primary antibody incubation, (B) secondary antibodies labelled with polymer enzymes are conjugated. (C) The HRP or AP are reacted with an appropriate substrate bound to a chromogenic dye, such as DAB or AEC, leading to the precipitation of insoluble, coloured products. Abbreviations: HRP—horseradish peroxidase; AP—alkaline phosphatase; DAB—3,3′-diaminobenzidine; AEC—3-Amino-9-ethylcarbazole.
Furthermore, many new chromogens have recently been discovered. Due to their different colours, this discovery made it possible to perform multiplexing using chromogenic IHC. This technique is advantageous in cases where the markers are not located in the same place in the tissue. Interestingly, it is sometimes possible to use multiple chromogens to stain one site simultaneously. Chromogen’s overlapping and characteristic colour change enable the recognition of biomarker co-expression. The multiplex chromogenic IHC technique allows the marking of about 3–5 markers on a whole single section over 10–15 h [32,33].
Because multiplex chromogenic IHC is based on immunohistochemistry technology, it is easy to introduce and apply in tumour-microenvironment studies and in describing the PD-1/PD-L1 pathway.
Chromogenic-based mIHC was used for the determination of the clinicopathological significance of PD-1, LAG3, and TIM3 markers in stage II/III gastric cancer patients [34] and for the identification the phenotypes and spatial profiles of intratumoural PD-1+ helper T cells associated with the prognosis of head and neck squamous cell carcinoma (HNSCC) [35]. Some analytical validation attempts of automated multiplex chromogenic IHC for diagnostic and predictive purposes could potentially be made in the clinic for NSCLC patient care. Ilié et al. presented two validated multiplex chromogenic IHC assays, including TTF1, p40, PD-L1, CD8, ALK, ROS1, BRAF V600E, and TRK, which could be adopted in most laboratories [36].
Multiplexed immunohistochemical consecutive staining on a single slide (MICSSS) is performed on FFPE tissue samples, and it relies on multiple cycles of staining with various antibodies, scanning, and destaining of a chromogenic substrate. Each cycle of these methods begins with incubation in a pH-optimised buffer to reveal epitopes. Notably, the MICSSS staining protocol must include an organic solvent-soluble chromogen to become easily removable between cycles. The 3-Amino-9-ethylcarbazole (AEC) is, by far, the most popular MICSSS chromogen. At the end of each subsequent cycle, the epitope retrieval is repeated as soon as chemical destaining is performed. An additional crucial protocol stage includes the blocking of the previous primary antibody. According to the literature, glycine-sodium dodecyl sulphate (SDS), potassium permanganate (KMnO4), and Fab-blocking antibodies are being used for these purposes. The preferred method should be Fab-fragment blocking with antibodies directed against primary antibodies, but from a different species. This action prevents staining interference with previous immunostaining cycles [33,37,38].
Like a simple chromogenic-based mIHC technique, MICSS is broadly used in immuno-oncology research. MICSSS panels can include immune markers that stain different cell compartments. Contrary to other mIHC techniques, MICSSS has an effective system of destaining and blocking between cycles, so steric hindrance is not an issue for this method. For example, it allows for routine membranous staining for CD2, CD3, CD8, and PD-1 quadruple-positive T cells, or the cytoplasmic expression of HLA-DR, CD206, CD68, CD163 quadruple-positive histiocytes without obvious steric hindrance [38,39]. In fact, the method is still useful for tumour-microenvironment studies. A recent paper presented at the 2022 American Society of Clinical Oncology (ASCO) Annual Meeting has described MICSS analysis of the immune microenvironment of bile duct cancers in tumour samples before and after neoadjuvant chemotherapy [40].
3. Fluorescence-Based mIHC/IF Is a Method That Provides Simultaneous Detection of Multiple Fluorescently Tagged Proteins of Interest in FFPE Tissue Sections
The approaches to fluorescent multiplexing include: (i) direct immunofluorescence: multiple antigen-specific primary antibodies conjugating at distinct fluorophores are involved in this approach. The sensitivity for low-abundance targets is limited due to a lack of signal amplification. Only a subset of protein targets (with the highest cellular concentration) are reliably detected with subsequent imaging; (ii) indirect immunofluorescence: the antigen is detected by fluorescently labelled secondary antibodies specific to the host species in which each primary antibody was raised. The disadvantage of this approach is the limited number of available host species. Multiplexing techniques allow for the use only of a combination of primary antibodies from distinct animal species [41]; and (iii) deposition assays: enzyme-labelled antibodies and tyramide–fluorophore conjugates are involved in this approach [16].
An example of an mIHC/IF method involving tyramide–fluorophore conjugates is tyramide signal amplification (TSA). This approach first requires the application of a primary antibody specific to the protein of interest and a primary specific secondary antibody conjugated to HRP. Detection is achieved using the fluorophore-labelled HRP substrate, tyramide [42]. HRP converts tyramide into a highly reactive oxidised intermediate that binds covalently to tyrosine residues on or near the protein of interest. Because the primary/secondary antibody pair can be removed from the sample without disrupting the antigen-associated fluorescence signal, multiple rounds of staining can be performed [43]. Subsequent visualisation of the amplified signal is enabled by the direct imaging of fluorophores or the downstream application of individual fluorophores tagged to anti-DNP or anti-biotin particles [44].
An example of a system which reflects the principle of TSA (presented in Figure 3) is the Opal mIHC assay by Akoya Biosciences (Marlborough, MA, USA). In this method enzymatic amplification is obtained by binding the fluorescent dyes with tyramide molecules. The technique utilises conventional fixation of the primary antibody on the epitope of interest. Next, the secondary antibody binds to the primary one, followed by the HRP polymer enzyme deposition. The HRP converts tyramide into a highly reactive oxidised intermediate that adheres covalently to tyrosine residues present in the area of the protein of interest. This detection is possible due to the labelling of the tyramide via fluorophore. This run can be repeated at least 7–9 times. The TSA multiplex technique allows the staining of multiple biomarkers within a single paraffin slide at the same time. To perform another round of staining, used antibodies need to be stripped via specific microwave treatment. This approach decreases the tissue autofluorescence for each antibody cycle [45,46].
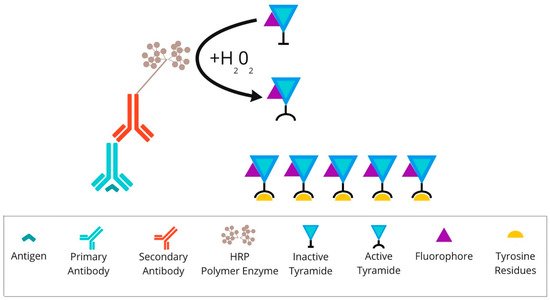
Figure 3. Overview of tyramide signal amplification technique: After primary antibody incubation, secondary antibody labelled with HRP polymer enzymes is conjugated. Detection is achieved using the fluorophore-labelled HRP substrate, tyramide. HRP converts tyramide into a highly reactive oxidised intermediate that binds covalently to tyrosine residues present on or near the protein of interest. Abbreviations: HRP—horseradish peroxidase.
Multiplex immunofluorescence, including the TSA method, enables the simultaneous detection of multiple markers on an individual tissue section. This method has gained importance as a method of immune profiling the tumour microenvironment or identifying targetable biomarkers, such as PD-L1, for studying the effect of immunotherapy. Recently, numerous diverse panels to analyse the tumour microenvironment for patterns of prognostic value have been created [47,48,49,50,51].
The protocol design depends on the research hypothesis, the cell population of interest, or the investigated therapy. The approach based on individual markers recognises a broad number of cell phenotypes, including rare cells, which may be helpful in tumour-microenvironment studies [24]. The TSA method is becoming an essential tool for characterising the tumour microenvironment of various cancers such as Hodgkin lymphoma [52], breast cancer [53], and NSCLC [54].
Parra et al. extensively review the basic requirements for performing TSA in FFPE cancer tissues to support translational oncology research. They stained approximately 4000 tumour samples for the immunoprofiling of labelled biomarkers in a single slide to explain cancer biology at the protein level and identify therapeutic targets and biomarkers [55].
4. Metal-Based mIHC/IF Are Methods That Utilise Antibodies Conjugated with Isotopically Pure Metal-Chelator Tags
A sample analysis is made using a mass cytometer, which distinguishes signals based on diverse atomic mass [56]. Examples of techniques grounded in the metal-based multiplexing methodology include imaging mass cytometry (IMC) and multiplexed ion-beam imaging (MIBI) [57].
Imaging mass cytometry (IMC) is a technology which combines laser ablation and mass cytometry by time-of-flight (CyTOF). It empowers target detection via metal-tag labelling. The analysis of up to 100 markers on a single tissue section is possible [58]. What is important is that the data on cellular morphology and tissue architecture are maintained [59]. The tissue sections are stained with antibodies of interest, and standard immunostaining procedures are applied. First, the antigen-retrieval buffer is added to expose the antigen epitope. After that, the sample is incubated with a mixture of antibodies conjuncted with metal tags. Subsequently, regions of interest (ROIs) are selected and recorded by a camera integrated with the Hyperion Tissue Imager, which is part of Hyperion Imaging System (Fluidigm Canada Inc., Markham, Ontario, Canada). A key step in the process is tissue slide-ablation using a laser pulse. The vaporisation of a sample provokes the release of particles, which are then transferred to the CyTOF detector by a stream of inert gas. The measured reporter signals are then profiled using the correspondent of a distinct laser spot. At the end, an image is generated based on these data [60]. The principles of the IMC method are presented in Figure 4.
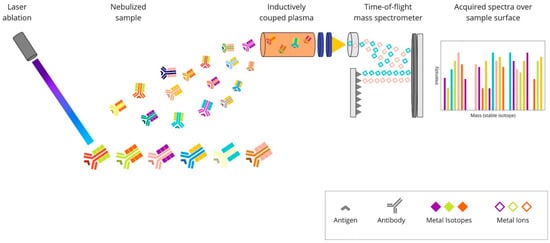
Figure 4. Overview of imaging mass cytometry technique: A mixture of antibodies is labelled with isotopically pure metal-chelator tags. Each antibody binds to a single protein target. Then, the sample is ablated using a laser beam. It generates the separation of particles, which are then carried by a helium/argon mixture stream into a time-of-flight mass spectrometer, where metal ions are separated based on mass. The measured reporter signals are then mapped using the coordinates of each laser spot, and finally, an image is generated based on these data.
Ijsselsteijn et al. created a panel of 40 markers, including PD-1 and PD-L1, for imaging mass cytometry of FFPE tissues, with a focus on cancer immunology [61]. IMC has found an application in determining the tumour microenvironment of patients with melanoma [62], oral squamous cell carcinoma [63], cutaneous squamous cell carcinoma [59], or classic Hodgkin lymphoma [64]. The technology used by Elaldi et al. allows the characterisation of the overall tumour organisation, not only that of immune cells. The panel contains markers of epithelial tumour cells, structural markers (blood and lymphatic vessels, nerve fibres, fibroblasts, and extracellular matrix proteins), and many markers for immune cells, including PD-1 and PD-L1 [59].
The multiplexed ion-beam imaging (MIBI) methodology utilises metal-chelator tags attached to antibodies as in the previously described IMC technique. The difference is in the sample analysis, which in the MIBI technique is based on time-of-flight secondary-ion mass spectrometry (ToF-SIMS). A tissue section is ablated using an oxygen primary-ion beam, which results in the release of metal isotopes from antibodies as secondary ions. Then, the liberated particles are transported to a time-of-flight mass spectrometer, which assigns them to distinct targets based on their atomic-mass detection. Each unique metal ion represents a protein. The created image is high-dimensional and shows the expression of numerous proteins. Due to its high sensitivity and imaging resolution, ToF-SIMS seems to be particularly suitable for tissue imaging [65]. The principles of this technique are presented in Figure 5.
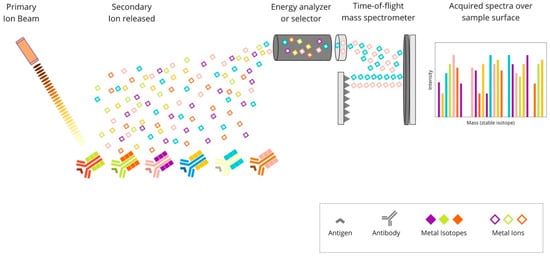
Figure 5. Overview of multiplexed ion-beam imaging technique: Mixture of antibodies are labelled with isotopically pure metal-chelator tags. Each antibody binds to a single protein target. Then, a thin layer of the sample surface is ablated using an oxygen-based primary ion beam. Metal isotopes are released from antibodies as secondary ions, which are then transported to a time-of-flight mass spectrometer. Each unique metal ion represents a protein.
The MIBI technique was successfully used for generating a proteomic profile of a triple-negative breast cancer (TNBC) microenvironment using a panel of 36 markers. Angelo’s group revealed variability in the composition of tumour-immune populations across 41 patients with TNBC. Subsequently, spatial analyses identified tumours that were either immune “mixed” or “compartmentalised” concerning PD-1, PD-L1, and IDO expression patterns. The researchers found a correlation between a quantifiable defined “compartmentalised” architecture and improved overall survival [66].
5. DNA Barcoding-Based mIHC/IF Are Techniques for Multiplexed Imaging Based on DNA Barcoding Using Oligonucleotide Detection Technologies
Antibodies for individual targets are conjugated with a unique, addressable barcode (DNA oligonucleotide) sequence for consecutive labelling and detection. These techniques include: COdetection by indEXing (CODEX) (Figure 6), Digital Spatial Profiling (DSP) (Figure 7), and InSituPlex (Figure 8).
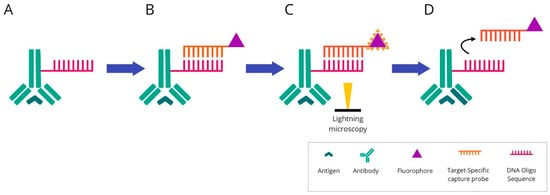
Figure 6. Overview of COdetection by indEXing technique: (A) Mixture of target antibodies conjugated with unique oligonucleotide barcodes are used simultaneously to stain a tissue section. (B) Then, fluorescently labelled complementary oligonucleotides are added. (C) The visualisation is conducted via light microscopy. The targets are detected and imaged in cycles of three targets in each cycle. (D) After imaging, the reporter oligonucleotides are stripped using a stripping buffer. The cycle is repeated until all antibodies within the panel have been revealed and visualised.
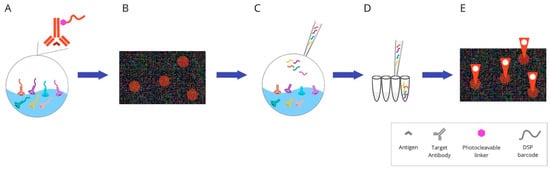
Figure 7. Overview of digital spatial-profiling technique: (A) Mixture of target antibodies conjugated with unique oligonucleotide barcodes through a UV photocleavable linker. (B) The oligonucleotide barcodes undergo quantitative analysis and are mapped back to tissue location to allow spatial profiling at the defined ROIs. (C) Sequential UV laser light exposure of each ROI results in the sample’s release of indexing oligonucleotide tags. (D) Then, a small pipette is robotically directed to the ROI and it samples all of the cleaved tags. (E) The counts are mapped back to tissue location, which produces a spatially resolved digital profile of analyte abundance within each ROI. Abbreviations: UV—ultraviolet; ROI—region of interest.
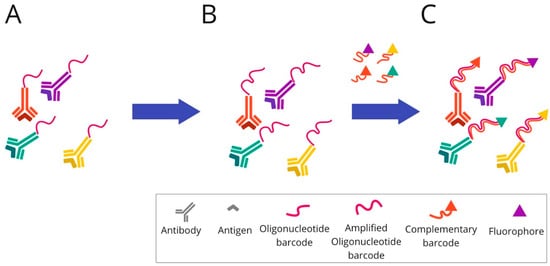
Figure 8. Overview of InSituPlex technique: (A) Mixture of target antibodies conjugated with unique oligonucleotide barcodes are used to stain a tissue section. (B) Then, the ratio of barcodes per antibody is increased on the tissue through a process that amplifies all targets simultaneously. (C) The fluorescently tagged probes complementary to each barcode are added to the sample to hybridise and label each target. Finally, the sections are ready for fluorescence imaging.
CO-detection by indEXing (CODEX) is a multiplex imaging approach based on DNA barcoding technology and is supported by fluorescent labelling. Contrary to previously described techniques, the primary antibodies are tagged with unique DNA oligonucleotide sequences instead of chromogenic dye, fluorophores, or pure metal chelator labels. In the CODEX method, a cocktail of antibodies is applied to a single-tissue section and imaged in the same instant. Subsequently, the markers are crosslinked to their cellular targets [67]. The procedure of immunostaining is generally performed in one step, and the tissue sections are marked with all the labelled antibodies simultaneously. Up to 60 markers could be visualised and quantified by the CODEX method. This number is limited by recognised DNA barcodes that do not exhibit cross-reactivity with other DNA sequences present in the sample. Visualisation of the antibody attached to the tissue section is possible by adding fluorophores. However, the fluorescent molecule is not linked directly to the antibody–oligonucleotide tag. First, a distinct PCR-based elongation of each DNA oligonucleotide is carried through, followed by complementary DNA strand attachment. A fluorophore is assigned to a complementary oligonucleotide sequence. The analysis is made in cycles. During each imaging cycle, three fluorescently labelled barcodes can be hybridised and give their fluorescent signals. The image is captured, and rehybridisation of complementary DNA strands is conducted using prepared stripping buffer (i.e., H2 buffer mixed with dimethyl sulfoxide—DMSO). The detached sequences and their fluorophores are washed out and the imaging cycle is repeated. Multicycle analysis of 1 cm2 area of tissue section takes approximately 30 h at a 400 nm resolution. At the end of the process, the multiparameter image is reconstructed. The CODEX assay platform is commercialised, and the licence belongs to Akoya Biosciences (https://www.akoyabio.com, (accessed on 20 June 2022)). However, fluorescent-signal analysis could be performed by a widely accessible standard fluorescent microscope [67,68].
CODEX multiplexing has recently gained attention in phenotyping immunoregulatory proteins. Its potential in immuno-oncology research was demonstrated by Nolan’s group, who examined human tonsil tissue via a panel of 57 validated antibodies, also covering immune markers [68]. Medrano et al. utilised this technology to describe the spatial arrangement of effector cells and their associated tumour cell targets in relation to each other on sarcoma tissue samples. They evaluated 35 distinct immune markers [69]. The CODEX was also used to characterise melanoma cells’ molecular and spatial features. The study analysed the biopsies of patients receiving anti-PD-1 and CTLA-4 immunotherapies and focused on changes in cellular populations during treatment [70]. The Phillips et al. study provides a complex report covering all the steps (including design, development and optimisation) for the application of a 56-marker antibody panel to cutaneous T-cell lymphoma tissue samples. The whole process could easily be transformed to other neoplasms [71]. The importance of studying cellular composition while preserving spatial information is discussed in the Schürch et al. study, which deeply profiles the immune tumour microenvironment among a cohort of colorectal cancer patients [72].
Digital Spatial Profiling (DSP) is a complete commercial system based on the nCounter multiplexing solution, which was designed by NanoString Technologies (the GeoMx™ Digital Spatial Profiling system). It facilitates the high-multiplex spatial profiling of proteins and RNA, creating up to 100-plex and up to 20,000-plex panels, respectively [73]. The principle of the method relies on barcoding technology. Antibodies or RNA hybridisation probes are bound to unique oligonucleotide tags. This connection is made through an intermediary—an ultraviolet (UV) photocleavable (PC) linker—and can easily be lost by using the UV light beam. The possibility of removing the tag using light allows the sample to be reused. After constituting antibodies/RNA probe pairs with photocleavable oligonucleotides (PC-oligos), the tissue is scanned and a digital image is created. The produced image enables the definition of regions of interests (ROIs). Due to precise UV exposure, the oligonucleotide barcodes are liberated and undergo quantitative analysis, followed by mapping back to the tissue location. UV laser light projection is possible due to two digital micromirror devices (DMD), which focus the beam so that the ROI can be directly illuminated. The selected PC-oligo tags are cleaved; then, they are retrieved using a small pipette, sampling 1–2 μL of liquid above each ROI. Subsequently, the collected index barcodes are automatically transported to a multiwell plate and digitally calculated using the NanoString nCounter analysis system. Those digital counts are mapped back to the tissue region representing each ROI, which provides a spatially profiled image of proteins or transcript activity within a distinct tissue sample [74,75,76].
Conventional diagnostic tools are characterised by either limited plex (e.g., IHC) or a lack of spatial resolution (e.g., bulk analysis of nucleic acids) and do not fully depict intratumour heterogeneity. DSP development exceeds these limits and allows for the identification of multiple informative biomarkers and their orientation in a spatial context. The method enables the profiling of up to 800 proteins or mRNA using optical-barcode readout. The hardware limit of spatial resolution is approximately 1 μm2, so it is possible to illuminate single T cells (10 μm), which represent the smallest detection target commonly found in immuno-oncology research. Moreover, the system can be automatically configured to multiple modes, such as tumour only; tumour microenvironment only; unique cell types and rare cell features (including PD-L1 expression on macrophages, PD-L1 expression on tumour cells, etc.); spatial gradient around cell features; simple hand-selected geometric areas; or a combination of the above methods [76].
Due to the valuable information obtained using this method, DSP was rapidly adopted in immuno-oncology and tumour-microenvironment research areas. Some examples include immune biomarker evaluation in a cohort of NSCLC [77] or HNSCC tumours from patients receiving immune-checkpoint inhibitor therapy, including PD-1 inhibitors [78]. The DSP technique also turned out to be a helpful tool for immuno-oncology studies in melanoma and allows for the identification of biomarkers that predict responses to immunotherapy [79,80].
It also helps to understand the complex changes in the tumour microenvironment during immunotherapy treatment. The two investigative groups used DSP to characterise the melanoma microenvironment before and during neoadjuvant treatment with an immune-checkpoint inhibitor. Two cohorts were investigated: the first received the PD-1 inhibitor (nivolumab) alone, and in the second, nivolumab was accompanied by ipilimumab, a CTLA-4 inhibitor [81,82].
Recently, more and more research has also been appearing on breast cancer. Some researchers analysed the spatial resolution of tumours or their stromata to identify distinct diversity in immune activation markers [83,84]. The GeoMx Breast Cancer Consortium (GBCC) presented the prospects of the DSP solution in the context of breast cancer microenvironmental investigation. The authors found an application for it in clinical cancer research, whereby it could be adopted to other tumour types characterised by high heterogeneity [85]. The DSP method has also shown its potential in basic biology studies, providing a perspective for future adaptation in the diagnostics of immune markers, including the PD-L1 protein. Gupta et al. used the DSP method in their study to objectively quantified PD-L1 expression in a standardised cell line using an Index tissue microarray [86].
InSituPlex technology is also based on DNA barcoding technology. The antibodies for each target are associated with a unique DNA barcode, as in previously described barcoding-based methods. The detection of targets is supported by labelling using fluorescent dye. To spectrally separate the targets during imaging, diverse fluorophores are used.
In the first step, the tissue section is stained using a mixture of primary antibodies conjugated to unique DNA barcodes. Subsequently, the ratio of barcodes per antibody is increased through an amplification technique. The whole process of lengthening the DNA sequence takes place simultaneously for all targets. Next, the complementary probes to each elongated barcode are attached and hybridised. For labelling, all of them are fluorescently marked. Finally, the tissue sections tagged in this way are ready for fluorescence imaging.
InSituPlex is becoming more and more available for immuno-oncology studies. Recently, a commercialised multiplex immunostaining kit (UltiMapper I/O PD-L1) dedicated to this field was developed [87]. InSituPlex seems to be a promising technique for immuno-oncology research. An example of its application in this setting is a study evaluating the phenotype subtypes of immune cells or cell densities among samples of different tumour types such as melanoma, and lung, breast, and colon cancer [88]. In another study InSituPlex was used for the spatial profiling of distinct subpopulations of tumour cells, lymphocytes, and macrophages [89].
The advantages and disadvantages of multiplex imaging technologies described above are summarised in Table 1.
Table 1. Summary of the advantages and disadvantages of multiplex imaging technologies based on [27,44,59,61,68,76,90,91,92,93,94,95,96,97,98,99,100,101,102].
| Method | Advantages | Disadvantages |
|---|---|---|
| mIHC | Low cost and automation of staining. The simplicity of usage and interpretation. Established guidelines and protocols. Standard light microscope for interpretation. |
Co-expression studies require careful selection of the chromogen pairs, and due to the limited amount of tissue on one slide, only a restricted number of chromogens can be used. Semiquantitative method, unable to assess marker intensity. |
| MICSSS | It is a simple and relatively affordable technique, similar to standard chromogenic immunohistochemistry. Ability to preview the entire slide for each marker. Each marker is individually stained, excluding staining or signal interferences. Standard light microscope for interpretation. |
Time-consuming method due to slow throughput. It allows the marking of up to 10 biomarkers on a single slide for 10 days (6 h per cycle). Possibility of mechanical tissue damage and formation of artefacts during the coverslip removal procedures. Difficulties with coregistration of images on the the whole slide due to their large number and complicated software service. |
| TSA | It allows spatial-arrangement analysis of multiple targets within a single tissue section. Any primary antibody validated for IHC, regardless of host species, can be used for each target of interest. The autofluorescence can be rectified by a multispectral microscope. Purified fluorophores are commercially accessible. When compared to chromogenic-based methods, multiplex immunofluorescence has a larger linear dynamic range, which makes it easier to study the marker intensity. Costs are comparable to standard chromogenic-based methods. |
There is an elevated risk of human-error occurrence, while manual staging is difficult. However, the use of autostainers could help to overcome the problem. There is a risk of “fluorophore bleed-through” or “umbrella effect” due to excessive tyramide deposition. Spectral overlap is a problem when the above seven probes are analysed. |
| IMC | Absence of tissue background signal. Highly quantitative method due to the absence of matrix effects. No need for serial slides to raise the target number or cyclic rounds of labelling–stripping–acquisition of the same tissue section. Up to 40 markers on an individual tissue section at a single-cell level can be analysed. The information on tissue architecture and cellular morphology is preserved. Markers can be analysed in parallel for a single section of tissue with low channel crosstalk. |
When compared to fluorescence imaging methods, the subcellular resolution is diminished. Laser-ablated tissue is not reusable for subsequent applications. More expensive than techniques based on fluorophore-conjugated antibodies. Advanced analysis tools are required. Increasing the processing speed is limited in this method. The main limitation is the risk of cross-contamination between laser-ablation spots. The analysed slide is not imaged. Because of the time required to perform ablation, ROI size is limited. Lower sensitivity than fluorescence imaging techniques as it lacks signal amplification or possibility to raise exposure time. |
| MIBI | Absence of tissue background signal. Quantitative information can be obtained from the types of cells and their distribution within the tissue. Markers can be analysed in parallel for a single section of tissue with low channel crosstalk. Image resolution, as well as depth of sample acquisition, can be adjusted. Has the capability of reaching sensitivity as low as parts-per-billion with a dynamic range of 10^5, and preserves very high resolution. It is capable of analysing up to 100 markers on a unique tissue section |
More expensive than techniques based on fluorophore-conjugated antibodies. The entire tissue slide is not a digital image; it is only the ROI. |
| CODEX | Can simultaneously reveal up to 60 markers in an individual tissue section. Lack of cross-reactivity (oligonucleotide–oligonucleotide, tissue or cellular DNA). It provides information about biomarkers’ relative number and expression at a spatial level. Relatively cost-effective and quick method. |
It lacks a signal-amplification system. Baseline autofluorescence of tissues present. Unified staining protocol demands that each antibody be individually conjugated and validated. The antibodies used in the CODEX system are expensive. |
| DSP | Simultaneous measurement of all markers. Possibility to create up to an 800-plex assay. However, when applying the NGS readout mode, the multiplexing is unlimited. Repeated cycles of high-plex profiling or subsequent DNA sequencing on the same tissue section are available. No autofluorescence is present. |
No single-cell expression data. Profiling every cell in a tissue slice at single-cell resolution is costly and tedious. It cannot create an image. |
| InSituPlex | More reproducible than other multiplexing techniques. Lower complexity of the laboratory test, fewer component reagents to prepare, fewer retrieval steps required, automated staining run, and no need for complex prevalidation when compared to multiplex-fluorescence techniques. An assay protocol can be easily implemented in laboratories with the standard fluorescent microscope, because it is compatible with standard IHC workflows and automation instrumentation. It preserves the integrity of the tissue sample. |
A small number of publications are available. |
This entry is adapted from the peer-reviewed paper 10.3390/cancers14153833
This entry is offline, you can click here to edit this entry!