Ogaja (Acanthopanax sessiliflorus fruit) has an important role in decreasing blood pressure. However, its biochemical change characteristic has not been clarified completely at the metabolic level. Therefore, in this study, a combination method of nuclear magnetic resonance (NMR) spectroscopy-based metabonomics and multivariate statistical analyses was employed to explore the metabolic changes of serum samples from spontaneously hypertensive rats treated with Ogaja extracts.
- Ogaja
- Acanthopanax sessiliflorus
- hypertension
- metabonomics
- spontaneously hypertensive rat
1. Introduction
Ogaja is the fruit of Acanthopanax sessiliflorus in the Araliaceae family and is widely distributed in Northeast Asian countries [5]. Ogaja is listed as an edible material in the Korean Food Code, and the evidence for safe consumption has already been reported [6]. Ogaja, as an edible fruit, was traditionally used as an ingredient in wine or tea in Eastern Asia. In addition, Ogaja is known to have antiplatelet aggregation activity [7], anti-inflammatory activity [8], and antitumor activity [9].
Our previous studies showed that the ethanolic extracts of Ogaja have an effect on hypertension via vasorelaxation, resulting in decreased blood pressure. Positive results from research on its antihypertensive activity indicate that it could complement existing antihypertensive drugs without side effects [10]. Spontaneously hypertensive rats (SHRs) are a genetic hypertensive model in which 100% hypertension occurs naturally through strict brother-to-sister mating [11]. Blood pressure of SHR significantly increases to 190−200 mmHg after they reach an age of 12 weeks. The cause of hypertension is complicated in SHRs, and they are considered a similar model to human essential hypertension [12].
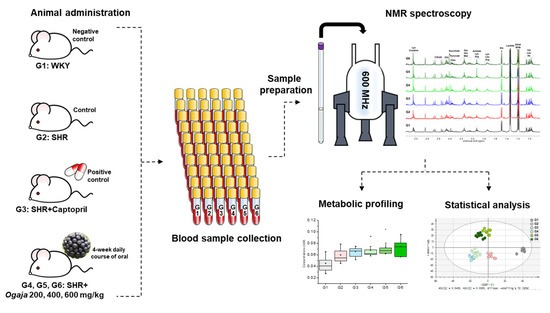
In this study, metabolic profiling and metabolic changes in serums of SHRs and Ogaja treated SHRs were analyzed by NMR spectroscopy. Figure 1 shows the overall experimental scheme. Both antihypertensive efficacy and biochemical changes characteristic of Ogaja were explored in our experiment. The results of this paper provide further evidence to understand the potential biomarker for the antihypertensive effect of Ogaja extracts.

Figure 1. Overall experimental scheme of nuclear magnetic resonance (NMR)-based metabonomics for antihypertensive effects of Acanthopanax sessiliflorus fruits (Ogaja) on spontaneously hypertensive rats (SHRs).
2. Antihypertensive Effects of Acanthopanax Sessiliflorus Fruits (Ogaja)
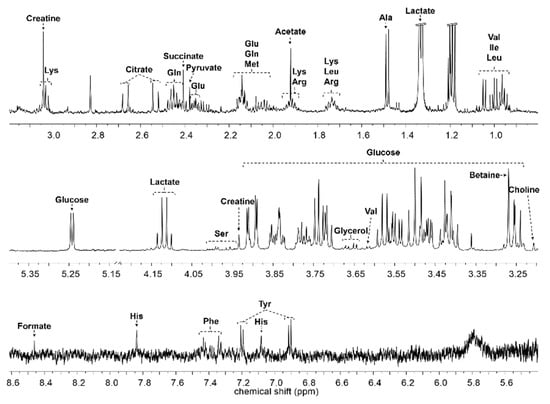
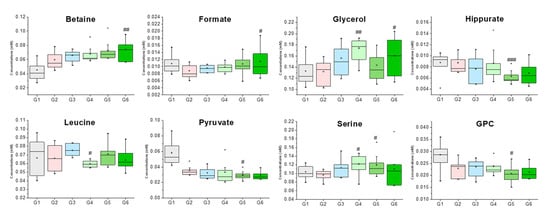
Serum samples were analyzed using nuclear magnetic resonance (NMR)-based metabonomics to study the antihypertensive effects of Acanthopanax sessiliflorus fruits (Ogaja) on rats. Wistar–Kyoto rats (WKYs) were negative control group (G1), G2 were spontaneously hypertensive rats (SHRs) as a control group, and SHRs were treated with captopril (G3), Ogaja 200 mg/kg (G4), Ogaja 400 mg/kg (G5), and Ogaja 600 mg/kg (G6). A representative 1H-NMR spectrum of rat serum with annotations of major metabolites is shown in Figure 2. A total of 32 metabolites were identified and quantified in rat serum using Chenomx 600 MHz metabolite database (Chenomx Inc., Edmonton, AB, Canada) and 2D NMR data (Figure S1). Their chemical shifts for identification and concentration data are shown in Table 1. Quantified metabolites were statistically analyzed. Univariate statistical analyses were conducted to determine significantly altered metabolites. Using a t-test, the metabolites of G1 exhibited significant differences with other groups (data not shown). However, this result indicates that the WKY is not a suitable control representing the normal blood pressure group in a metabonomics study. It is controversial to use WKY for the control of normal blood pressure group because WKYs are not born under a strict brother-to-sister mating system; therefore, there are genetic differences between WKY and SHR. In this result, the differences of G1 were not significant from a metabolic point of view. Therefore, significant differences with G2 were meaningful in this study. p-values that mean statistically significance were calculated for G2, and bar graphs of metabolites whose p-values were less than 0.05 are shown in Figure 3.

Figure 2. Representative 1H nuclear magnetic resonance (NMR) spectrum of rat serum. The major metabolites are annotated on the spectrum.

Figure 3. Box plots of metabolites that had groups that were significantly different when compared to G2 (Group 2). ###/##/# indicate significant differences at the p < 0.001, p < 0.01, p < 0.05 levels compared to the G2, respectively.
Table 1. Identified and quantified metabolites in serum sample from 1H-NMR spectra. Values are means (mM) ± standard deviations of concentrations.
| Compound | Chemical Shifts (Multiplicities) (ppm) | G1 (mM) | G2 (mM) | G3 (mM) | G4 (mM) | G5 (mM) | G6 (mM) |
|---|---|---|---|---|---|---|---|
| 2-Oxoglutarate | 2.43 (t), 3.00 (t) | 0.014 ± 0.003 | 0.018 ± 0.002 | 0.019 ± 0.005 | 0.020 ± 0.003 | 0.018 ± 0.002 | 0.019 ± 0.004 |
| Acetate | 1.91 (s) | 0.042 ± 0.019 | 0.032 ± 0.010 | 0.038 ± 0.011 | 0.035 ± 0.009 | 0.038 ± 0.009 | 0.035 ± 0.007 |
| Alanine | 1.47 (d), 3.77 (q) | 0.193 ± 0.027 | 0.175 ± 0.028 | 0.169 ± 0.020 | 0.176 ± 0.024 | 0.180 ± 0.024 | 0.154 ± 0.022 |
| Arginine | 1.64–1.72 (m), 1.88–1.92 (m), 3.23 (t) | 0.078 ± 0.017 | 0.062 ± 0.025 | 0.062 ± 0.019 | 0.063 ± 0.020 | 0.077 ± 0.025 | 0.068 ± 0.036 |
| Asparagine | 2.85 (dd), 2.93 (dd) | 0.023 ± 0.007 | 0.028 ± 0.011 | 0.027 ± 0.005 | 0.031 ± 0.008 | 0.030 ± 0.006 | 0.030 ± 0.009 |
| Betaine | 3.25 (s), 3.89 (s) | 0.045 ± 0.012 | 0.060 ± 0.012 | 0.066 ± 0.008 | 0.068 ± 0.011 | 0.073 ± 0.014 | 0.074 ± 0.014 ## |
| Choline | 3.19 (s), 3.50 (dd), 4.05 (ddd) | 0.010 ± 0.001 | 0.017 ± 0.002 | 0.018 ± 0.002 | 0.019 ± 0.002 | 0.018 ± 0.002 | 0.017 ± 0.002 |
| Citrate | 2.52 (d), 2.65 (d) | 0.102 ± 0.015 | 0.111 ± 0.012 | 0.115 ± 0.012 | 0.116 ± 0.007 | 0.114 ± 0.016 | 0.113 ± 0.024 |
| Creatine | 3.02 (s), 3.92 (s) | 0.050 ± 0.007 | 0.077 ± 0.011 | 0.075 ± 0.016 | 0.068 ± 0.017 | 0.075 ± 0.012 | 0.067 ± 0.012 |
| Creatinine | 3.03 (s), 4.05 (s) | 0.007 ± 0.002 | 0.006 ± 0.000 | 0.006 ± 0.002 | 0.008 ± 0.002 | 0.006 ± 0.002 | 0.006 ± 0.001 |
| Formate | 8.44 (s) | 0.011 ± 0.002 | 0.009 ± 0.002 | 0.010 ± 0.001 | 0.010 ± 0.001 | 0.011 ± 0.003 | 0.011 ± 0.004 # |
| Glucose | 3.24 (m), 3.40–3.49 (m), 3.53 (dd), 3.70–3.89 (m), 4.64 (d), 5.23 (d) | 3.050 ± 0.223 | 2.758 ± 0.358 | 2.583 ± 0.404 | 2.525 ± 0.398 | 2.748 ± 0.205 | 2.717 ± 0.343 |
| Glutamate | 2.05−2.12 (m), 2.32−2.35 (m) | 0.069 ± 0.010 | 0.119 ± 0.028 | 0.118 ± 0.016 | 0.124 ± 0.010 | 0.130 ± 0.016 | 0.123 ± 0.020 |
| Glutamine | 2.11−2.14 (m), 2.42−2.46 (m), 3.76 (t) | 0.199 ± 0.014 | 0.230 ± 0.025 | 0.257 ± 0.028 | 0.243 ± 0.018 | 0.241 ± 0.042 | 0.229 ± 0.021 |
| Glycerol | 3.55 (dd), 3.64 (dd), 3.77 (m) | 0.133 ± 0.024 | 0.132 ± 0.022 | 0.156 ± 0.026 | 0.174 ± 0.020 ## | 0.143 ± 0.026 | 0.160 ± 0.034 # |
| Glycine | 3.55 (s) | 0.133 ± 0.013 | 0.127 ± 0.016 | 0.136 ± 0.010 | 0.130 ± 0.010 | 0.132 ± 0.015 | 0.123 ± 0.012 |
| GPC | 3.22 (s), 3.61 (m), 3.87 (m), 4.32 (m) | 0.009 ± 0.002 | 0.009 ± 0.002 | 0.008 ± 0.002 | 0.009 ± 0.003 | 0.006 ± 0.001 # | 0.007 ± 0.002 |
| Hippurate | 7.54 (t), 7.63 (t), 7.82 (d) | 0.026 ± 0.008 | 0.030 ± 0.006 | 0.028 ± 0.004 | 0.030 ± 0.003 | 0.032 ± 0.008 ### | 0.027 ± 0.006 |
| Histidine | 3.13 (dd), 3.98 (dd), 7.06 (s), 7.81 (s) | 0.005 ± 0.001 | 0.005 ± 0.002 | 0.006 ± 0.002 | 0.005 ± 0.001 | 0.005 ± 0.001 | 0.005 ± 0.001 |
| Isobutyrate | 1.06 (d), 2.38 (m) | 0.041 ± 0.012 | 0.047 ± 0.007 | 0.046 ± 0.003 | 0.047 ± 0.005 | 0.046 ± 0.006 | 0.042 ± 0.006 |
| Isoleucine | 0.93 (t), 1.00 (d), 1.25 (m), 1.46 (m), 1.97 (m), 3.66 (d) | 1.489 ± 0.185 | 1.694 ± 0.285 | 1.791 ± 0.385 | 1.811 ± 0.358 | 1.582 ± 0.218 | 1.726 ± 0.363 |
| Lacate | 1.32 (d), 4.10 (q) | 0.064 ± 0.020 | 0.067 ± 0.013 | 0.073 ± 0.009 | 0.058 ± 0.005 | 0.071 ± 0.012 | 0.060 ± 0.017 |
| Leucine | 0.95 (t), 1.67–1.74 (m), 3.73 (m) | 0.127 ± 0.013 | 0.119 ± 0.029 | 0.110 ± 0.012 | 0.122 ± 0.017 # | 0.126 ± 0.020 | 0.105 ± 0.017 |
| Lysine | 1.44–1.51 (m), 1.72 (m), 1.88 (m), 1.92 (m), 3.02 (t), 3.76 (t) | 0.021 ± 0.002 | 0.024 ± 0.004 | 0.024 ± 0.002 | 0.024 ± 0.002 | 0.024 ± 0.002 | 0.022 ± 0.003 |
| Methionine | 2.11 (m), 2.63 (t), 3.85 (dd) | 0.020 ± 0.003 | 0.020 ± 0.004 | 0.022 ± 0.002 | 0.022 ± 0.001 | 0.023 ± 0.003 | 0.022 ± 0.004 |
| Phenylalanine | 7.42 (m), 7.37 (t), 7.32 (dd) | 0.058 ± 0.015 | 0.035 ± 0.006 | 0.032 ± 0.007 | 0.033 ± 0.013 | 0.030 ± 0.005 | 0.029 ± 0.005 |
| Pyruvate | 2.36 (s) | 0.104 ± 0.016 | 0.097 ± 0.011 | 0.113 ± 0.020 | 0.122 ± 0.023 | 0.120 ± 0.026 # | 0.110 ± 0.041 |
| Serine | 3.84 (dd), 3.94 (dd), 3.98 (dd) | 0.008 ± 0.003 | 0.015 ± 0.006 | 0.017 ± 0.010 | 0.018 ± 0.012 # | 0.018 ± 0.005 # | 0.027 ± 0.018 |
| Succinate | 2.39 (s) | 0.031 ± 0.005 | 0.033 ± 0.005 | 0.031 ± 0.006 | 0.034 ± 0.007 | 0.038 ± 0.012 | 0.031 ± 0.008 |
| Tyrosine | 3.05 (dd), 3.19 (dd), 3.93 (dd), 6.89 (m), 7.18 (m) | 0.076 ± 0.023 | 0.083 ± 0.013 | 0.080 ± 0.008 | 0.084 ± 0.007 | 0.084 ± 0.015 | 0.075 ± 0.010 |
| Valine | 0.98 (d), 1.03 (d), 2.26 (m), 3.60 (d) | 0.025 ± 0.006 | 0.031 ± 0.008 | 0.029 ± 0.014 | 0.036 ± 0.012 | 0.027 ± 0.009 | 0.034 ± 0.013 |
| myo-Inositol | 3.27 (t), 3.52 (dd), 3.62 (t), 4.06 (t) | 0.029 ± 0.006 | 0.023 ± 0.003 | 0.024 ± 0.004 | 0.024 ± 0.003 | 0.021 ± 0.004 | 0.021 ± 0.003 |
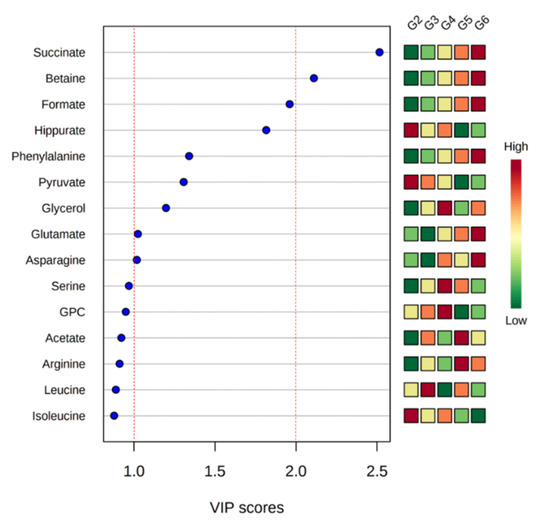
# Significantly different to G2 with p-value < 0.05; ## significantly different to G2 with p-value < 0.01, ### significantly different to G2 with p-value < 0.0.Variable importance in projection (VIP) scores of quantified metabolites were calculated to identify meaningful metabolites that showed differences well (Figure 4). All groups except G1 were analyzed to obtain VIP values of metabolites. G1 had a different pattern from other groups, which can affect the VIP scores. A VIP score over 1.0 is typically considered an important metabolite in contributing to the difference [13]. In this result, asparagine, glutamate, glycerol, pyruvate, phenylalanine, hippurate, and formate exhibited VIP scores over 1.0, and betaine and succinate had VIP scores over 2.0.

Figure 4. The top 15 metabolites ranked by variable importance in projection (VIP) scores from a comparison of all groups except G1.
NMR spectra of rat serum samples were analyzed by multivariate statistical analyses to visualize the clustering among groups (Figure 5). Principal component analysis (PCA) was conducted to check the unsupervised distribution of samples (Figure S2). The score plot of PCA showed an unusual cluster independent of the group on the left side. Therefore, these samples were excluded, and eight samples per group were used for the next analyses. Orthogonal partial least square discriminant analysis (OPLS-DA) was additionally performed (Figure 4). OPLS-DA is useful for separating two groups [14]; however, it was used to more effectively check the distribution of the groups in this study. Therefore, in these results, R2 and Q2 values (goodness of fit and predictive ability of the model, respectively) were low [15]. In the comparison of all groups (Figure 5A), G1 showed a different pattern to the other groups. This result indicates that WKY and SHR have different patterns of metabolic composition. G3 and G4 were clustered and G5 and G6 were clustered. This means that the effects of captopril 100 mg/kg and Ogaja 200 mg/kg on metabolome were similar, and that the effects of Ogaja 400 mg/kg and Ogaja 600 mg/kg on metabolome were similar. Validation plot of the OPLS-DA model was obtained using permutation tests to assess the risk of model over fitting. The permutation test with 100 iterations resulted in Y-intercepts of R2 and Q2 with values of 0.492 and −0.175, respectively. These data indicated that the model was valid and no over fitting was observed (Figure 5B).

Figure 5. Multivariate statistical analyses of NMR spectra. (A) Orthogonal partial least square discriminant analysis (OPLS-DA) score plot of all group comparison (R2X = 0.333, R2Y = 0.581, Q2 = 0.175) (B) Validation plot of the OPLS-DA model obtained from 100 permutation tests (R2Y-intercept = 0.492, Q2Y-intercept = −0.175).
Reference
- Lee, S.; Kim, B.K.; Cho, S.H.; Shin, K.H. Phytochemical constituents from the fruits of Acanthopanax sessiliflorus. Arch. Pharm. Res. 2002, 25, 280. [Google Scholar] [CrossRef] [PubMed]
- Ministry of Food and Drug Safety (KR). Food Public Code; Ministry of Food and Drug Safety: Cheongju, Korea, 2018.
- Yang, C.; An, Q.; Xiong, Z.; Song, Y.; Yu, K.; Li, F. Triterpenes from Acanthopanax sessiliflorus fruits and their antiplatelet aggregation activities. Planta Med. 2009, 75, 656–659. [Google Scholar] [CrossRef] [PubMed]
- Lee, D.Y.; Seo, K.H.; Jeong, R.H.; Lee, S.M.; Kim, G.S.; Noh, H.J.; Kim, S.Y.; Kim, G.W.; Kim, J.Y.; Baek, N.I. Anti-inflammatory lignans from the fruits of Acanthopanax sessiliflorus. Molecules 2013, 18, 41–49. [Google Scholar] [CrossRef] [PubMed]
- Lee, S.H.; Lee, Y.S.; Jung, S.H.; Ji, J.; Shin, K.H.; Kim, B.K.; Kang, S.S. Antitumor and immunostimulating activities of Acanthopanax sessiliflorus fruits. Nat. Prod. Sci. 2003, 9, 112–116. [Google Scholar]
- Jung, I.H.; Kim, S.E.; Lee, Y.G.; Kim, D.H.; Kim, H.; Kim, G.S.; Baek, N.I.; Lee, D.Y. Antihypertensive effect of ethanolic extract from Acanthopanax sessiliflorus fruits and quality control of active compounds. Oxid. Med. Cell. Longev. 2018. [Google Scholar] [CrossRef] [PubMed]
- Trippodo, N.C.; Frohlich, E.D. Similarities of genetic (spontaneous) hypertension. Man and rat. Circ. Res. 1981, 48, 309–319. [Google Scholar] [CrossRef]
- Akira, K.; Masu, S.; Imachi, M.; Mitome, H.; Hashimoto, M.; Hashimoto, T. 1H NMR-based metabonomic analysis of urine from young spontaneously hypertensive rats. J. Pharm. Biomed. 2008, 46, 550–556. [Google Scholar] [CrossRef]
- Kim, J.K.; Choi, S.R.; Lee, J.; Park, S.Y.; Song, S.Y.; Na, J.; Kim, S.W.; Kim, S.J.; Nou, I.S.; Lee, Y.H.; et al. Metabolic differentiation of diamondback moth (Plutella xylostella (L.)) resistance in cabbage (Brassica oleracea L. ssp. capitata). J. Agric. Food Chem. 2013, 61, 11222–11230. [Google Scholar] [CrossRef]
- Wiklund, S.; Johansson, E.; Sjöström, L.; Mellerowicz, E.J.; Edlund, U.; Shockcor, J.P.; Gottfries, J.; Moritz, T.; Trygg, J. Visualization of GC/TOF-MS-based metabolomics data for identification of biochemically interesting compounds using OPLS class models. Anal. Chem. 2008, 80, 115–122. [Google Scholar] [CrossRef]
- Triba, M.N.; Le Moyec, L.; Amathieu, R.; Goossens, C.; Bouchemal, N.; Nahon, P.; Rutledge, D.N.; Savarin, P. PLS/OPLS models in metabolomics: The impact of permutation of dataset rows on the K-fold cross-validation quality parameters. Mol. Biosyst. 2015, 11, 13–19. [Google Scholar] [CrossRef]
This entry is adapted from the peer-reviewed paper 10.3390/metabo10100404
