Your browser does not fully support modern features. Please upgrade for a smoother experience.
Please note this is an old version of this entry, which may differ significantly from the current revision.
Subjects:
Computer Science, Information Systems
An accelerometer sensor (AS) and a gyroscope sensor (GS) are commonly used in mobile phones. These sensors are especially functional for measuring three-dimensional object orientation or stationing, as well as changes in the ambient environment, as they have the ability to supply raw data with great clarity and accuracy. Automatic wireless monitoring of motor vehicles saves many lives by preventing collisions, notifying drivers as well as ambulatory and emergency services when accidents take place. With GPS, apps for testing cars, ships, and trains have been built to help avoid or monitor problems.
- vehicle recognition
- CNN
- signal processing
- sensor
1. Introduction
Handheld mobile devices have been an indispensable part of the global market since 1979 [1], and in recent years, have been expanding from phones to include watches and wristbands [2]. Consumers can now access location-based services (LBS) and mobile social networks (MSNs) through a mobile smart device that can track their location using cell towers, wireless fidelity (Wi-Fi), global positioning system (GPS), Bluetooth, and radio frequency identification (RFID), among other technologies.
When applied to vehicle recognition, activity recognition technology can collect and assess a plethora of vehicular, driver, transit, and environmental data, from identifying any small bump in the road, to increasing the accuracy of vehicle recognition, and a range of driver and driving conditions. This information can be harnessed from the smart device, and wirelessly processed to wide-scale databases for the mining of market intelligence, in addition to direct customer support. Potholes may be identified even before they became major problems, when an Apple watch sends wireless movement data. Slick or unsafe driving conditions could be communicated in real time, after vehicles have passed over a specific point in the road. Gadgets can submit alerts to consumers or communicate with intelligent transportation systems, and the number of fatal accidents may decrease.
As a distinctly non-visual, low-cost, and mobile branch of vehicle recognition research, the smart sensor vehicle recognition system has the potential of contributing to the integration of intelligent transportation systems with human activity recognition, such that a person’s travel activities may be tracked in and out of their vehicle, and subsequently has the potential to contribute to and integrate with all other mobile-based activity systems. Expanding on the findings from Pias et al. [4], this paper contributes to vehicle recognition research based in smart sensors.
2. Vehicle Recognition via Smart Sensors
Smart sensors, rather than just using cameras, take in numerous different kinds of sensing data, for which Figure 3 depicts some common examples. Often information from sensors are interpreted for further meaning by analyzing the raw sensor data through machine learning, deep learning, or neural network analysis. Numerous studies have used long-short term memory (LSTM) classification for smart sensor recognition for modes of transportation, such as in Ref. [5], which analyzed GPS, cell phones, and Wi-Fi receptors for determining whether subjects were still, walking, running, biking, driving a car, taking a bus, train, or subway. These authors observed between 88–94% accuracy on classifying each vehicular mode of transportation, with GPS proving to be their most valuable input. While Ref. [5] obtained an accuracy of 88–94% with the use of an LSTM classifier and three sensors, our study required only two sensors—the accelerometer and gyroscope—and attained a higher accuracy of 98%.
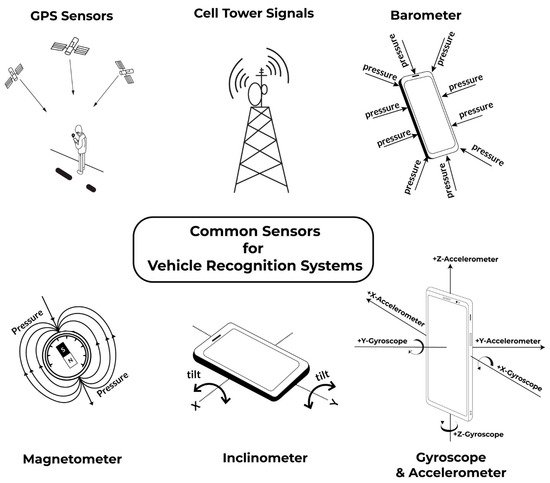
Figure 3. Common sensors for vehicle recognition.
With deep convolutional bidirectional-LSTM, which is a method combining convolutional and bidirectional LSTM layers, Ref. [6] predicted whether users were traveling by car, bus, train, subway, walking, running, biking, or remaining stationary by analyzing the raw data of smartphone sensors. Accelerometer data, gyroscope data, magnetometer data, linear acceleration, gravity data, orientation (quaternions), and ambient pressure were utilized to achieve an F1 score of 0.96, but found that train and subway data were more difficult to distinguish, a problem that they were able to mitigate through the inclusion of GPS location data. Ref. [7] utilized LSTM to analyze Wi-Fi, GPS, LTE, and CDMA receivers from smartphones for identifying whether people were either not moving, walking, running, riding a bike, driving in a car, on a bus, on a train, or taking a subway. Four-fold shuffling was used to test the pipeline on the validation set with random shuffling, arriving at a best shuffle F1 score of 84.07%. Both Refs. [6,7] required a greater number of sensors, and also obtained lower accuracy than our 98% accuracy with only two cost-effective smart device sensors.
Ref. [8] used smartphone sensor data, including from accelerometer, gyroscope, barometer, and magnetometer sensors, to recognize whether users were still, walking, running, biking, or in a car, on a train, or on the subway. Combining residual and LSTM recurrent networks, their MSRLSTM model boasted accuracies of over 98% and recognition precisions greater than 95%. While this study boasts the same 98% accuracy that we attained, Ref. [8] added additional sensors, namely barometer and magnetometer sensors, which were not needed in our study to obtain the same level of accuracy.
A long short-term memory (LSTM) classifier analyzed raw data from smartphone accelerators, gyroscopes, magnetometers, and barometers to recognize transportation modes. Ref. [9] achieved 96.9% classification with only low-power-consumption sensors among 58 volunteers with android smartphones. While Ref. [9] attained a high accuracy of 96.9%, this was both slightly lower than our 98% accuracy and, more importantly, required four, as opposed to our two, sensors to arrive at these results.
Among numerous other studies that have used random forest (RF) classification for recognizing vehicles and travel modes, Ref. [10] used GPS, speed, and accelerometer sensors from six students to classify modes of travel, resulting in walking and biking accuracies of more than 90% with a univariate movelet approach, which segmented the accelerometer time series data into movelets and clustered segments of the same mode. RF sorting of the three modes of motorized transportation were classified, and proved to be the best with a 92% accuracy.
The smartphone GPS and accelerometer data of 50 participants were analyzed in such a way that incorporated a multinomial logit model into a RF framework. Ref. [11] significantly improved not only overall prediction accuracy, but also classification of less-represented modes of transportation. In another study using RF classification, 722 samples were collected for identifying vehicle classes of cars, buses, trams, and trains, from which GPS and accelerometer smartphone data were analyzed. Ref. [12] achieved a mobility detection accuracy of 87 % when using 10-fold cross validation on both a RF and an IBk algorithm. While all three studies [10,11,12] used a GPS sensor with a RF classifier, the higher accuracy in Ref. [10] can be explained by adding both speed and accelerometer sensors. However, even with their obtained 92%, it still realized a lower accuracy compared to our 98% using only accelerometer and gyroscope data.
To determine the transportation mode of users, including standing still, walking, running, bicycle, motorcycle, car, bus, metro, train, or high speed rail, researchers collected gyroscope, accelerometer, and magnetometer sensor data in Ref. [13]. RF analysis yielded 83.8% accuracy, while applying a healing algorithm improved the accuracy to 93%. Here, introducing magnetometer data increased accuracy to 93%, but this was still lower than our model’s 98% accuracy.
Using Google’s AutoML Tables service to preprocess and evaluate the Sussex–Huawei location transportation (SHL) dataset, Ref. [14] created 975 features by hand in order to achieve reasonable prediction quality. Smartphone GPS location data, GPS reception, Wi-Fi reception, and GSM cell tower scans were analyzed to determine whether the mode of transportation was standing still, walking, running, biking, driving a car, riding a bus, taking a train, or a subway. Incorporating the K-nearest neighbor classifier (KNN), RF, the extra trees classifier (ET), and the XGBoost classifier (XGB), Ref. [15] also took data from various radio sensors to interpret people standing still, walking, running, biking, driving a car, taking a bus, on a train, or subway. Their RF model presented their best results, with 93.4 % accuracy.
With Wi-Fi, Bluetooth, and GPS sensor data, Ref. [16] used RF, multinomial logistic regression (LR), and a support vector machine (SVM) to analyze daily transportation modes of four subjects, categorized as either self-powered (i.e., walk or bike), taking a bus, driving, taking a train, or riding the subway. With Wi-Fi and Bluetooth demonstrating a significant impact on model performance, and notably excluding accelerometer data, their model achieved an overall classification accuracy of 89% and a precision of 87%. In Refs. [14,15,16], the best accuracy obtained was 93.4%, which was lower than our results, while also using more sensors than ours to detect mode of transportation.
A transportation classification system demonstrated the capacity of GPS and accelerometer details from smart gadgets to identify the modes of user outdoor transportation. The system proved an accuracy rate of 96.31% when used on a dataset collected from 18 smartphone clients [3]. This study used the same number of mobile device sensors as our study, approaching but not quite reaching our 98% accuracy. In another study, road vehicle wheelbase and axle counts were acquired with piezo and magnetic sensors, leading to a near-instantaneous vehicle classification success rate of over 90% [17], an accuracy that was significantly lower than ours, while also using sensors that are also not as commonly available within handheld mobile devices.
Using rotation vector sensors, accelerometers, uncalibrated gyroscopes, linear acceleration, orientation, speed, game rotation vector, sound, and gyroscopes, Ref. [18] recorded activity data when subjects were standing still, walking, driving in a car, riding a bus, and taking a train. With an ensemble method of machine learning algorithms, KNNs, and random subspace, all bundled into stacked learning, they ultimately used a neural network architecture to successfully determine the transportation mode with an impressive 90% accuracy, though still decidedly lower than our 98% obtained with only an accelerometer and a gyroscope.
IoT sensors were shown to be effective for vehicle detection in Ref. [19]. Using infrared sensors, radar sensors, wireless magnetometers, and video image processors, researchers detected on-road vehicles with a 92.36% accuracy and 0% false alarms.
To distinguish between 38 users’ modes of travel, including being stationary, walking, motorized private transport (car or motorcycle), or public transportation (tram, bus, or train), Ref. [20] obtained over 30,000 observations from 30 different brands of mobile phones. Using GPS sensor, accelerometers, and GIS user contextual data, the authors achieved a mean accuracy of 96%.
Using accelerometer, magnetometer, and gyroscope smartphone sensors, Ref. [21] analyzed eight transportation modes, achieving 93.8% accuracy with an ensemble of machine and deep learning methods, as well as 97.2% accuracy when applying a Hidden Markov model (HMM). Evaluating accelerometer, gyroscope, and GPS sensor data with an ensemble method incorporating naive Bayes, Bayesian networks, kNN, logistic regression, J48, decision tables, and random tree models, Ref. [22] effectively detected walking, running, cycling, and traveling by bus or car with an exceptional accuracy of 99.5% and a precision of 99.6%, surpassing our own 98%, though still using a somewhat less cost effective three smart device sensors, as opposed to our two. Nonetheless, this is a very impressive model, demonstrating similarities to our own, which is limited to only sensors available in smart devices.
To distinguish between transportation on a bus, train, car, or subway, as well as walking and running, Ref. [23] analyzed smartphone data from accelerometer, gyroscope, magnetometer, and gravity sensors in their real-time trajectory segmentation method. Incorporating TSMs (transition state matrices) to detect the transport mode change point, they determined both vehicle identification and mode change points, with an overall accuracy of 98.52%, slightly higher than our own study’s results. Nevertheless, this marginal increase in accuracy required four sensors, rather than our more cost-effective two.
Ref. [24] successfully categorized a compact car, a truck, and a Hum V, as vehicles of varying weights, via a Fisher linear discriminate vector (FLDV)-based algorithm. While this study initially used seismic sensors (at less than 100 Hz) to detect acoustic sampling, their 99% accuracy was reported for an integrated license plate recognition system that used image processing from video cameras, rather than solely using sensors for their detection.
Accelerometer, gyroscope, and magnetometer sensor data from the android smartphones of 8 participants between the ages of 20 and 45 were collected over 79 h for training a vehicular activity detector and classifier [25]. Their multi-tier architecture, which included a segment-based approach called “healing,” detected travel mode among stationary, walking, car, bus, tram, train, metro, and ferry at 95% effectiveness. Our model achieved slightly higher accuracy for mode of transportation classification, and used a more cost-effective two, rather than three sensors.
With only smartphone accelerometers, Ref. [26] successfully generated a dataset for recognizing modes of travel for walking, cycling, taking a train, a bus, and taxi. This was achieved through the vibrations within the raw data, although their dataset study did not use machine learning to achieve a comparable experimental outcome.
Ref. [27] used a micro-electro-mechanical system (MEMS) of magnetic sensors with SVM to distinguish between heavy-tracked vehicles, light-tracked vehicles, and light-wheeled vehicles. With each vehicle passing by the sensor at a uniform speed, they achieved recognition rates of more than 92% for heavy-tracked vehicles and light-tracked vehicles, and 89.5% for light-wheeled vehicles. This study, using sensors located outside of the vehicle and not from common mobile devices as in ours, still obtained a lower accuracy than our 98%.
In 2021, Li et al. collected only GPS and Wi-Fi data from people standing still, walking, running, biking, driving a car, riding a bus, or taking a train or subway [28]. Using convolutional and recurrent neural networks, features were extracted, and long-term temporal information was captured. Results showed that GPS consistently outperformed Wi-Fi, and subway activity was best recognized via location data. However, accuracy ranged only between a relatively low 34–48%.
By fusing geomagnetic sensors and frequency modulation radio data, Ref. [29] scored a vehicle detection accuracy of 95.4% on high-chassis vehicles, or buses, passing by the sensors at high and low speeds of 10 km/h and 60 km/h.
Accelerometer, gyroscope, and magnetometer sensors were used for interpreting driving activities, including stopping (S), going straight (G), turning left (L), or turning right (R), while either walking, biking, motorbiking, driving a car, or riding a bus [30]. Authors achieved an accuracy of 98.33% in detecting vehicle modes, and an average accuracy of 98.95% for identifying driving events. In another study using accelerator, gyroscope, magnetometer, and barometer sensors, Ref. [31] distinguished between bus, car, metro, and train transportation modes. The authors’ CNN algorithm had the highest accuracy of transportation mode recognition when based on a Keras framework, yielding an accuracy of 94.2%. While the results of Refs. [29,31] had lower accuracy than ours, Ref. [30] was more comparable to the success of our model. However, this slightly higher accuracy required additional magnetometer data [30] to our more cost-effective accelerometer and gyroscope model.
To identify between users remaining stationary, walking, running, cycling, driving a car, riding a bus, taking a train, or riding the subway, Ref. [32] analyzed GPS, Wi-Fi, and cellular data with three different tree-based models. Their model had a relatively high accuracy for bicycle data with an F1 score of 0.82, but alternatively, a low F1 score of 0.25 for running. In another study using an ADXL345 accelerometer sensor to read vibrations on railroad tracks, Ref. [33] were able to detect the arrival of trains at an average accuracy of 83%, a significant improvement over similar previous studies. Impressively, Ref. [33] obtained its results with only accelerometer data, but it did so only by identifying train movement along railroads, and at a markedly lower accuracy than our 98%.
Fusing data from the accelerometers and gyroscopes of mobile phones and smart watches, Ref. [34] utilized a better-than-the-best fusion (BB-Fus) algorithm to distinguish between meeting-walking activity combinations and meeting-motorized transportation activities. With an SVM classifier, their unique model’s overall classification performance hit 98.32%. Raw data from mobile accelerometer and gyroscope sensors for 20 users with sampling rate of 50 Hz were analyzed by CNN [35]. When categorizing bus, car, subway, and train travel modes, they achieved an accuracy of 91%. Refs. [34,35] notably used the same exact combination of sensors as used in our study. While Ref. [35] obtained a noticeably lower accuracy, Ref. [34] obtained an almost equivalent result to ours. Our study, however, ensured that obtained accuracy was consistent across different traffic and weather conditions, although their introduction of a BB-Fus algorithm did provide slightly better performance than our model by 0.32%.
Ref. [36] examined GPS location, GPS reception, Wi-Fi reception, and GSM cell tower scans from smartphone sensors to perform transition-points-based segmentation. They divided types of transportation into two groups based on speed, and subsequently applied a high performance optimized XGBoost classifier, ultimately obtaining an 88% accuracy.
GPS, Wi-Fi, accelerometer, and cell-ID information were used to identify departure and arrival times, origins, destinations, modes, and travel purposes of around 800 respondents. Ref. [37] correctly classified over 80% of trips, and this increased up to 95% for distances greater than 20 km. One problem that comes with the use of cell-ID information in [37] is that it leads to privacy intrusion, as the data are acquired from, for example, call records of the user.
A combination of smartphone sensors, including GPS reception, GPS location, Wi-Fi, and GSM tower scans data were analyzed with a combination of convolutional subnets to extract local features, as well as a transformer subnet that captures long-term dependencies. Ref. [38] distinguished between users standing still, walking, running, cycling, driving a car, or riding a bus, subway, or train to yield a best F1-score of 0.8779. The use of GPS sensors in [36,37,38] provides less specific displacement sensitivity than the gyroscope and accelerometer used in our study, a difference that can at least partly explain our higher accuracy of 98%.
Inertial and pressure sensors, accelerometer, gyroscope, magnetometer, linear acceleration, gravity, orientation, and ambient pressure data were recorded from smartphones by Ref. [39] when determining which of the eight transportation modes (still, walk, run, bike, car, bus, train, and subway) a user had used to travel. The performance of the respondents had a wide range, from 53.2% to 93.9%, although 16 out of 19 respondents had over 90% accuracy. This study’s best accuracy of nearly 94% was still lower than our 98%, and used seven more sensors than our model.
The novel Spiderwalk vibration sensor worn inside the subject’s shoes, under the feet, was used to collect data over one month from six subjects. Transmitted wirelessly through Bluetooth connections to their smartphones, Ref. [40] demonstrated a high detection accuracy of 93.8% for determining the kind of vehicle a subject was traveling in, or if the participant were walking or sitting, and on what kind of surface. While the Spiderwalk method obtained a good accuracy of 93.8%, it required a specialized sensor in people’s shoes that is not readily and passively available via people’s existing smartphones, as our model does.
Ref. [41] classified walking, cycling, e-bicycle riding, riding a bus, and driving a car via smartphone GPS, accelerometer, GSM, and Wi-Fi sensors. Overall, their accuracy exceeded 93% for both the training and test datasets, with precision and recall exceeding 80% for each mode of travel. GPS location, GPS reception, Wi-Fi reception, and GSM cell tower scans were analyzed via a LightGBM (LGB) classifier to classify eight different transportation modes. With an F1 Score of 0.665, Ref. [42] found that smartphones on trains, buses, and subways were more distinct with their model than in other modes of transportation that rely on user movement. For both [41,42], four sensors were used to obtain markedly lower accuracy than ours, which required only two sensors to recognize and classify modes of transportation at 98% accuracy.
To recognize cars, minibuses, buses, and trucks, as well as the direction of a passing vehicle, Ref. [43] worked with wireless magnetic sensors to detect and distinguish between the metallic parts of those vehicles. When identifying vehicles passing, their paper had a general accuracy rate of 94%. The classification of vehicles had accuracy of up to 100% in trucks, although they experienced a reduced accuracy of 92% when distinguishing between minibuses and buses. While this study did obtain 100% accuracy in trucks, our model’s 98% accuracy was applicable to more modes of transportation. Furthermore, the wireless magnetic sensors were not handheld smart device sensors, capable of also passively integrating with other aspects of human activity detection, as can be obtained through accelerometers and gyroscopes.
Classifying cars, vans, buses, and trucks on a two-lane road, Ref. [44] used magnetometer sensors, identifying a RM3100 as the best performing sensor, due to its high sensitivity and low noise. Ref. [45] tested axle-detecting sensors for vehicle recognition. They found that mounted free-of-axle detector (FAD) sensors often failed to identify vehicle axles, if there was either bridge vibration, multiple vehicle presence, or a deviation of vehicles transversely in their lane. They instead proposed a wavelet-based approach, with Shannon entropy and a correlation factor, to improve axle detection.
Prior research has also found that significant losses in cost effectiveness are incurred by smartphones using a greater number of sensors, and that an effective way of saving energy in smartphones is to turn off those sensors that are not being used [46,47,48]. For example, Ref. [47] found that an idle smartphone lasted 51.27 h, while a smartphone with an accelerometer lasted 31.51 h, a significant reduction. A smartphone with a gyroscope running lasted just 28.15 h; and a smartphone with a magnetometer running lasted 34.45 h. The GPS was the most energy consumptive, lasting only 17.42 h.
The energy consumption of various smartphone sensors was assessed for percentage of consumption by Ref. [49], and they found that the accelerometer, when applied in outdoor motion, used roughly two-thirds as much energy consumption at 8% as the magnetometer with 12.5%. The GPS sensor was found to use a sizable 53%, and the inclinometer used 5.9%. For network interfaces, the same study [49] found that, when moving outdoors, Wi-Fi sensors used 32% of energy consumption, while cell tower sensors used 20%, and Bluetooth used 28%.
Another study [50] looked at the use of Wi-Fi and GPS, along with other major functions, and found that battery times when each sensor was active were relatively consistent across makes and models of smartphone. Stronger Wi-Fi signals also did consume more energy than weaker Wi-Fi signals. This study [50] also found that GPS sensors used a very sizable portion of battery life, being the costliest use, in terms of battery consumption. This study also looked at accelerometers, magnetometers, and gyroscopes, concluding that the magnetometer was the least energy efficient sensor among those three.
To summarize, a review of recent literature on mode of transportation recognition performed via smart sensors yields only a small number of articles that attempted a method which was as cost-effective as ours. Most notably [26,33,34,35], only Ref. [34] achieved the near-perfect accuracy that our results provided, and that article did not test for consistency across traffic or weather conditions as ours did. As listed in Table 1, other studies obtained incredible accuracy, but were either not as cost effective by using more sensors [21], or were not integrated with common handheld devices [9], had significantly lower accuracy [35], or were not as generalizable in its accuracy to multiple modes of transportation [43] as ours.
Table 1. Vehicle Recognition Sensor Types and Definitions with Relevant Studies.
| Sensor | Technical Function | Articles Using Sensor for Vehicle Recognition |
|---|---|---|
| Used only accelerometer and/or gyroscope | Equal or more cost-effective than our study, utilizing just accelerometers and/or gyroscopes | Pias et al., 2020 [4]; Suharjono et al., 2019 [33]; Kaewunruen et al., 2021 [26]; Fang et al., 2016 [35]; Sengül et al., 2021 [34] |
| Accelerometer | Measures linear acceleration, directional movement, and three-dimensional object orientation or stationing, as well as changes in the ambient environment | Xia et al., 2014 [3]; Alotaibi, 2020 [18]; Badii et al., 2021 [20]; Gjoreski et al., 2021 [21]; Erdelic et al., 2022 [23]; Guvensan et al. 2017 [25], Iskanderov and Guvensan, 2020 [13]; Jeyakumar et al., 2018 [6]; Kaewunruen et al., 2021 [26]; Martin et al., 2017 [10]; Şengül et al., 2021 [34]; Shafique and Hato, 2020 [11]; Tregel et al., 2018 [12]; Wang et al., 2018 [40]; Wang et al., 2021 [8]; Xiao et al., 2019 [41]; Lu et al., 2018 [30]; Suharjono et al., 2019 [33]; Thomas et al., 2018 [37]; Qin et al., 2018 [31] |
| Gyroscope | Measures vibrations in any direction | Alotaibi, 2020 [18]; Gjoreski et al., 2021 [21]; Balli and Sağbaş, 2017 [22]; Erdelic et al., 2022 [23]; Guvensan et al. 2017 [25]; Iskanderov and Guvensan, 2020 [13]; Jeyakumar et al., 2018 [6]; Şengül et al., 2021 [34]; Wang et al., 2018 [40]; Wang et al., 2021 [8]; Qin et al., 2018 [31]; Lu et al., 2018 [30] |
| GPS | Contains user geographic location and timestamp | Xia et al., 2014 [3]; Badii et al., 2021 [20]; Balabka and Shkliarenko., 2021 [14]; Bjerre-Nielsen et al., 2020 [16]; Dogan et al., 2021 [5]; Iabanzhi et al., 2021 [7]; Li et al., 2021 [28]; Martin et al., 2017 [10]; Ren 2021 [32]; Tregel et al., 2018 [12]; Tian et al., 2021 [38], Thomas et al., 2018 [37]; Xiao et al., 2019 [41]; Zhu et al., 2021 [42]; Shafique and Hato, 2020 [11] |
| Magnetometer | Measures and processes magnetic signals as a result of changes in the ambient magnetic field | González et al., 2020 [17]; Gjoreski et al., 2021 [21]; Balli and Sağbaş, 2017 [22]; Erdelic et al., 2022 [23]; Guvensan et al. 2017 [13]; Iskanderov and Guvensan, 2020 [13]; Jeyakumar et al., 2018 [6]; Lou et al., 2018 [29]; Wang et al., 2018 [40]; Wang et al., 2021 [8]; Lu et al., 2018 [30]; Lan et al., 2010 [27]; Qin et al., 2018 [31], |
| Wi-Fi sensor | Contains the user’s identification and wireless fidelity signal strength | Bjerre-Nielsen et al., 2020 [16]; Dogan et al., 2021 [5]; Iabanzhi et al., 2021 [7]; Li et al., 2021 [28]; Tian et al., 2021 [38]; Thomas et al., 2018 [37]; Ren 2021 [32]; Xiao et al., 2019 [41], Zhu et al., 2021 [42]. |
| Gravity sensors | Measures gravitational force | Erdelic et al., 2022 [23], Jeyakumar et al., 2018 [6] |
| Barometer | Measures ambient and inertial pressure. | Wang et al., 2018 [40]; Qin et al., 2018 [31] |
| Bluetooth sensor | Contains user identification, timestamp, and signal strength | Bjerre-Nielsen et al., 2020 [16] |
This entry is adapted from the peer-reviewed paper 10.3390/s22124397
This entry is offline, you can click here to edit this entry!