Current Methodologies for Visualizing ATP in Living Cells: History
Please note this is an old version of this entry, which may differ significantly from the current revision.
Subjects: Cell Biology

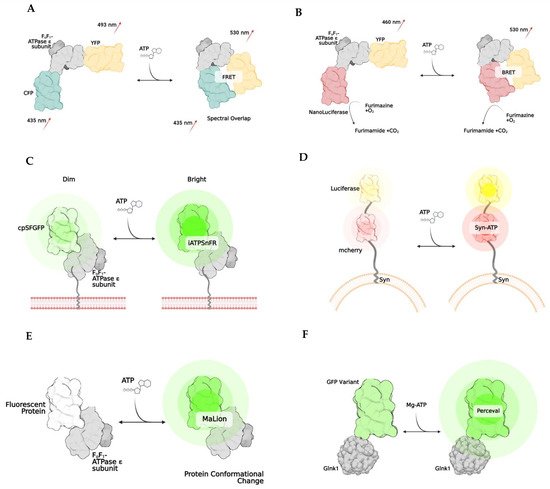
Measuring total ATP levels within cellular compartmental pools in real-time presents a newer and more innovative approach to qualitatively analyzing ATP. Although this method is not precisely quantitative, it can be helpful in determining changes in ATP concentrations in one region of a cell compared to another in a variety of disease states. The overall goal of these assays and imaging methodologies are to evaluate and visualize dynamic ATP trends, such as usage and depletion, between cells and their sub-compartments. However, semi-quantitative evaluation of the relative ATP signal is feasible. The currently developed technologies that utilize this approach to ATP quantification are mainly genetically encoded biosensors. In conjunction with a fluorescent or bioluminescent protein, most of these biosensors harness the folding capabilities of the ϵ subunit of the bacterial ATP synthase subunit. The bacterial ATP synthase protein comprises a β-barrel domain located at the N terminus and an α-helical domain with two α-helices located at the C terminus. Upon ATP binding, the two α-helices interact and refine their conformational structure of the ϵ subunit, leading to fluorescent/bioluminescent illumination, indicating that ATP is present. Overall, this subunit adopts two different conformations: open (ATP-free) or closed (ATP-bound). The uses and applicability of this technology are limitless. 

  • ATP
  • ATP dynamics
  • cellular bioenergetics
  • energy metabolism
  • mitochondria

1. Förster Resonance Energy Transfer (FRET)

Named after Theodore Förster, Förster resonance energy transfer is a method of imaging in which energy transfers between two fluorophores [1][2][3]. This energy transfer only occurs if the two fluorophores are less than 10 nm apart and if the donor’s emission spectrum overlaps with the excitation of the acceptor fluorophore protein (Figure 1A). FRET is used to develop biosensors, as it can emit a specific fluorescence when bound to the molecule that initiates a conformational change. Specifically, biosensors have been developed to allow imaging when ATP is bound to the bacterial ATP synthase subunit [2][3][4][5][6]. The most common FRET ATP biosensor is ATEAM (Adenosine 5′-Triphosphate indicator based on ϵ subunit for Analytical Measurements), which comprises the ϵ subunit of bacterial ATP synthase wedged between a cyan and yellow donor and acceptor pair [2]. These fluorescent proteins are positioned at the N and C terminals, respectively. The binding of ATP triggers the conformation change that decreases the proximity between fluorophores, resulting in a higher spectral emission and illuminating as a new color. This method allows for the visualization and monitoring of intracellular ATP. FRET has been successfully applied in HELA cells [7], and human skin fibroblasts [8] and utilized to show the difference in ATP between cellular compartments [8]. More recently, ATP dynamics have been indicated in vivo by generating an engineered novel mouse line that expresses the FRET-based ATP biosensor in all tissues using a two-photon microscope [9].
Figure 1. Examples of genetically encoded biosensors. Förster resonance energy transfer, or FRET, (A) works by changing emission spectra after the binding of a substance (A). The result is due to the two fluorophores being brought closer together (<10 nm). Bioluminescent resonance energy transfer, BRET, works similarly to FRET, except NanoLuciferase becomes active once the substrate of interest is bound, resulting in a change of emission. (B) iATPSnFR is a unique biosensor, in which the ATPase subunit has a membrane-bound region, which allows it to be anchored to a cell’s surface. (C) Syn-ATP was designed to target synaptic nerve endings, as the synaptophysin protein anchors the biosensor to a synaptic vesicle membrane. Once ATP is bound, the mCherry and Luciferase enzymes provide a fluorescent/luminescent ratio for analysis. (D) MaLions are intensiometric biosensors, fluorescing brighter as more ATP is bound. These are unique as multiple biosenors have been designed in this family to target specific cellular organelles, making the ATP levels visible across multiple compartments. (E) Lastly, perceval is a ratiometic indicator that indicates its ATP level based on the ratio of ADP to ATP (F).
The major concern when utilizing a FRET biosensor is that they are sensitive to pH [8]. The sensitivity of the donor/acceptor pair can lead to instability of the biosensor, leading to false interpretations of ATP levels. This should be considered especially in instances where acidic cellular compartments, such as lysosomes, are the main cellular component of interest. Other than common issues related to fluorescent imaging, such as autofluorescence and photobleaching, another shortcoming of the FRET biosensor is its relatively low signal-to-noise ratio due to detector noise and optical noise. These issues pose challenges in interpreting results from cell compartments with low ATP contents.

2. Bioluminescence and BRET

Bioluminescence is another biosensor technique that exploits the emitted light released from the enzymatic reaction. Whenever luciferase is in the presence of O2, ATP, and Mg2+, an oxidation reaction will occur that stimulates the release of photons. The emission spectra can vary depending on the type of luciferase used. However, it typically comprises spectra between 546 nm and 618 nm [10]. This technology harnesses the biology of bioluminescence to indicate the amount or concentration of ATP in plasma, tissue, or mitochondria. With targeting sequences added to the proteins, these indicators could localize to specific cellular compartments, such as the mitochondria or endoplasmic reticulum. Numerous variations of bioluminescent techniques have been developed, some for more specific applications. One group developed a luciferase-enzymatic reaction system called Syn-ATP (Figure 1D) composed of synaptophysin, a synaptic vesicular protein, fused to mCherry and luciferase [11]. mCherry provides a method to determine the luminescence/fluorescence ratio. As more ATP is consumed, the bioluminescence becomes more intense.
BRET, or bioluminescence resonance energy transfer, is similar to FRET but is instead based on the energy transfer between a bioluminescent molecule and a fluorophore. When the bioluminescent protein and fluorophore are close, less than 10 nm apart, the luciferase enzymatic reaction excites the fluorophore, and spectra are emitted [12][13]. One of the first indicators using this method was developed utilizing the ATP binding domain of the ϵ subunit of bacterial ATP synthase that is wedged between a yellow fluorescent protein called Venus (emission 528 nm) and NanoLuciferase (Figure 1B). A unique advantage to NanoLuciferase is that it does not require ATP as a cofactor to function—it simply binds to ATP, inducing a conformational change in the biosensor. After ATP binding, NanoLuciferase converts furimazine to furimamide. This particular subset of luciferase removes the potential for inaccurate interpretations of ATP levels in the cell due to inadvertent consumption. Another similar method was developed in which the luciferase enzyme is split into two portions, and ATP binding thus rejoins the subunits, leading to a BRET reaction [14].
As some forms of luciferase require ATP as a cofactor to function, it is important to discern which derivative of luciferase would best suit an experiment, as this could lead to misinterpretation of ATP amounts within the cell. One of the significant issues associated with bioluminescent-utilizing biosensors is that some luciferases also have an affinity for ADP. The lack of specificity to only ATP leaves room for error in determining the amount of ATP produced [15]. Furthermore, certain drugs and other cellular metabolites can impact luciferase enzymatic activity, resulting in potentially unreliable and inconsistent results [16]. Lastly, as the enzyme activity of luciferase is oxygen-dependent, this method cannot be utilized in hypoxic conditions [16][17].

3. Single, Ratiometric, and Intensiometric Biosensors

Another method in developing biosensors is to utilize a single fluorophore instead of two. Many biosensors are developed based on ratiometric and intensiometric properties, indicating that they either exhibit a single fluorescent signal or lead to an increase in fluorescence emission at their corresponding wavelengths. The difference in fluorescence intensity can then be analyzed to determine ATP content in cells and subcellular compartments qualitatively. In these cases, the increase in fluorescence only occurs when a particular molecule, such as ATP, is bound, thus changing the conformation. Small changes in the circularly permutated fluorophore occur at the N and C terminal of the protein which induce a change in conformation, altering the emission properties of the fluorophore [18].
One particular biosensor, QUEEN, is a genetically encoded, ratiometric fluorescent ATP indicator that has been utilized to determine the global ATP levels within bacteria and yeast [19]. QUEEN, or Quantitative Evaluator of cellular ENergy, is composed of a single, circularly permutated enhanced GFP wedged between two α-helices of the ϵ subunit of bacterial ATPase (Bacillus subtilis). When ATP is bound, the biosensor slightly changes its confirmation, and a shift of the 400/494 nm ratio is seen proportional to the amount of ATP present in the cell. Another ATP biosensor with a single fluorophore is iATPSnFR (Figure 1C), an intensity-based ATP-sensing fluorescent reporter which monitors extracellular and cytosolic ATP [20]. This indicator has the same components as in QUEEN. However, unlike QUEEN, iATPSnFR is more sensitive to pH, which poses potential problems and limitations for its use in specific cell compartments with large fluctuations in pH.
There have been advances in the utilization and optimization of ATP biosensors to target specific compartments of the cell. One particular group designed a family of biosensors called MaLions (Figure 1E), or Monitoring aTP Level intensiometric turn-on indicators [21]. These biosensors consist of the ϵ subunit of bacterial ATP synthase, with red, green, and blue fluorophores. These were adapted to target and follow the cytosolic, mitochondrial, and nuclear ATP levels, respectively. This family of biosensors is beneficial, as their organelle-specificity to ATP allows for evaluating ATP dynamics and flux between compartments. Additionally, this family is intensiometric, meaning that the higher the fluorescent intensity, the higher the ATP concentration. This group of biosensors also has a low sensitivity to pH. MaLions provide an exciting and innovative future for evaluating ATP in vitro and in vivo.
Perceval (Figure 1F) is a family of ratiometric biosensors using the ADP/ATP ratio to quantify ATP in living cells [22]. Perceval’s fluorescence response is related to the ratio of ATP to ADP levels [23]. Although the absolute individual amounts of ATP, ADP, and AMP might vary widely within the cells, the ratios of [ATP]/[ADP] and [ATP]/[AMP] might be considered a more reliable indicator of metabolic activity between compartments and from cell to cell [24][25]. This biosensor family is composed of a bacterial regulatory protein, GlnK1, linked to a circularly permuted Venus fluorescent protein. The structure of GlnK1 is similar to the ϵ subunit of bacterial ATP synthase. It undergoes a conformational change whenever ATP is bound, resulting in a change of the Venus protein’s excitation/emission of the 490/405 nm ratio. However, ADP does not induce a conformational change [22][23][24][26].
Compared to other ATP indicators, genetically encoded biosensors provide a unique approach to real-time imaging. They allow for the discovery and determination of living and single-cell spatiotemporal ATP dynamic evaluation, providing a long-term approach to evaluating specific pathologies in cell culture. Moreover, biosensors with circularly permuted fluorophores allow for detecting small changes in specific compartments of a single living cell. Perhaps even more so, this technology is relatively affordable, and experiments can be conducted with standard microscopy technologies. Genetically encoded biosensors provide broad usability in various biological fields of research. The ease of use, affordability, and lack of needing super high-tech microscopy provides a more accessible way to conduct better and more innovative research. With various types of ATP biosensors for use in living cells and in vivo experiments, it is essential to determine the one that would best suit a particular study (Table 1). Although a significant amount of work has been carried out to develop and optimize these methods, their applicability has not been utilized to their full potential to answer important biological questions.
Table 1. Comparison of unique features seen with genetically encoded ATP biosensors.
Genetically Encoded ATP Biosensors
Biosensor Technique Mechanism Advantage Disadvantage
ATEAM [2] FRET Adenosine 5′-triphosphate indication based on ϵ subunit for analytical measurement; ATP binding causes an increase in Forster resonance energy transfer between a CFP and YFP and results in a higher wavelength release; comprised of bacterial ϵ subunit of bacterial ATP synthase with cyan and yellow donor/acceptor pairs at N and C terminals, respectively Qualitative/quantitative;
spatiotemporal resolution
Sensitive to acidic pH, thus limiting which cellular subcomponent cell can use; can undergo glycosylation in ER and Golgi which inhibits its ability to bind to ATP
GO-ATEAM [4] FRET Similar to ATEAM but CFP and YFP are replaced by green (GFP) and orange (mKOk) fluorescent pair, respectively
BTEAM [13] BRET Composed of e subunit of bacterial ATP synthase flanked by Venus at the N terminal and Nanoluciferase at the C terminal; emitted light is produced by Nanoluciferase because oxidation of luciferin cases emission of photons; capacity of luciferin to emit light is directly correlated to amount of ATP available Qualitative/quantitative; spatiotemporal resolution; no need for laser, as light emission come from enzymatic reaction after administration of luciferase substrate; avoid generation of autofluorescent and phototoxicity; very sensitive; simplicity of assay; can add localization signals to target cell subcompartments Luciferin limitation due to inhibition of reaction from other drugs; limits potential with some drug development; enzymatic and substrate concentration limitations; transfection efficiency limitations; optimization required for maximal detection; some luciferases produce ATP from pools of ADP
ARSeNL [27] BRET ATP detection via ratiometric mScarlet-NanoLuc sensor, similar to BTEAM
QUEEN [28] Ratiometric Quantitative evaluator of cellular energy; cpFP is inserted between two a helices of ϵ subunit of ATP synthase with linkers similar results to bioluminescence luciferase assays Modest pH sensitivity
iATPSnFR [20] Intensiometric Intensity-based ATP-sensing fluorescent reporter consists of circularly superfolder GFP between 2 alpha helices of ϵ subunit of bacterial ATP synthase; when ATP binds, rapid increase in fluorescence occurs spatiotemporal resolution Modest pH sensitivity
Syn-ATP [11] Bioluminescence Luciferin-reaction based; synaptophysin targets synaptic vesicle proteins and mCherry helps to determine total amount of luciferase using a luminescence/fluorescent ratio Qualitative/quantitative; only used for synaptic vesicles No spatiotemporal resolution; some luciferases produce ATP from pools of ADP
MaLion [21] Intensiometric multiple constructs created to target subcellular compartments (cytosol, mitochondria, nucleus); consists of a fused ϵ subunit of bacterial ATP synthase to red, blue, or green Qualitative/quantitative; spatiotemporal resolution; has organelle-targeted specific ATP estimations; the higher the ATP, the brighter the fluorescence; low pH sensitivity Potential phototoxicity due to fluorescence emission in living cells; transfection efficiency in hard to transfect cells
Perceval [24] Ratiometric Based on estimation of ADP/ATP; composed of GlnK1 (a bacterial regulatory protein) linked to Venus; GlnK1 undergoes a conformational change when bound to ATP Qualitative/quantitative; spatiotemporal resolution; no conformational change when bound to ADP Some pH sensitivity

This entry is adapted from the peer-reviewed paper 10.3390/cells11121920

References

  1. Padilla-Parra, S.; Tramier, M. FRET microscopy in the living cell: Different approaches, strengths and weaknesses. BioEssays 2012, 34, 369–376.
  2. Yoshida, T.; Alfaqaan, S.; Sasaoka, N.; Imamura, H. Application of FRET-Based Biosensor “ATeam” for Visualization of ATP Levels in the Mitochondrial Matrix of Living Mammalian Cells. Methods Mol. Biol. 2017, 1567, 231–243.
  3. Vishnu, N.; Jadoon Khan, M.; Karsten, F.; Groschner, L.N.; Waldeck-Weiermair, M.; Rost, R.; Hallstrom, S.; Imamura, H.; Graier, W.F.; Malli, R. ATP increases within the lumen of the endoplasmic reticulum upon intracellular Ca2+ release. Mol. Biol. Cell 2014, 25, 368–379.
  4. Imamura, H.; Huynh Nhat, K.P.; Togawa, H.; Saito, K.; Iino, R.; Kato-Yamada, Y.; Nagai, T.; Noji, H. Visualization of ATP levels inside single living cells with fluorescence resonance energy transfer-based genetically encoded indicators. Proc. Natl. Acad. Sci. USA 2009, 106, 15651–15656.
  5. Zadran, S.; Standley, S.; Wong, K.; Otiniano, E.; Amighi, A.; Baudry, M. Fluorescence resonance energy transfer (FRET)-based biosensors: Visualizing cellular dynamics and bioenergetics. Appl. Microbiol. Biotechnol. 2012, 96, 895–902.
  6. Bilan, D.S.; Matlashov, M.E.; Gorokhovatsky, A.Y.; Schultz, C.; Enikolopov, G.; Belousov, V.V. Genetically encoded fluorescent indicator for imaging NAD+/NADH ratio changes in different cellular compartments. Biochim. Biophys. Acta (BBA)-Gen. Subj. 2014, 1840, 951–957.
  7. Depaoli, M.R.; Karsten, F.; Madreiter-Sokolowski, C.T.; Klec, C.; Gottschalk, B.; Bischof, H.; Eroglu, E.; Waldeck-Weiermair, M.; Simmen, T.; Graier, W.F.; et al. Real-Time Imaging of Mitochondrial ATP Dynamics Reveals the Metabolic Setting of Single Cells. Cell Rep. 2018, 25, 501–512.e3.
  8. Liemburg-Apers, D.C.; Imamura, H.; Forkink, M.; Nooteboom, M.; Swarts, H.G.; Brock, R.; Smeitink, J.A.M.; Willems, P.H.G.M.; Koopman, W.J.H. Quantitative Glucose and ATP Sensing in Mammalian Cells. Pharm. Res. 2011, 28, 2745–2757.
  9. Yamamoto, S.; Yamamoto, M.; Nakamura, J.; Mii, A.; Yamamoto, S.; Takahashi, M.; Kaneko, K.; Uchino, E.; Sato, Y.; Fukuma, S.; et al. Spatiotemporal ATP Dynamics during AKI Predict Renal Prognosis. J. Am. Soc. Nephrol. 2020, 31, 2855–2869.
  10. Inouye, S. Firefly luciferase: An adenylate-forming enzyme for multicatalytic functions. Cell. Mol. Life Sci. 2010, 67, 387–404.
  11. Rangaraju, V.; Calloway, N.; Ryan, T.A. Activity-Driven Local ATP Synthesis Is Required for Synaptic Function. Cell 2014, 156, 825–835.
  12. Brown, N.E.; Blumer, J.B.; Hepler, J.R. Bioluminescence Resonance Energy Transfer to Detect Protein-Protein Interactions in Live Cells. In Methods in Molecular Biology; Springer: New York, NY, USA, 2015; pp. 457–465.
  13. Yoshida, T.; Kakizuka, A.; Imamura, H. BTeam, a Novel BRET-based Biosensor for the Accurate Quantification of ATP Concentration within Living Cells. Sci. Rep. 2016, 6, 39618.
  14. Azad, T.; Janse Van Rensburg, H.J.; Morgan, J.; Rezaei, R.; Crupi, M.J.F.; Chen, R.; Ghahremani, M.; Jamalkhah, M.; Forbes, N.; Ilkow, C.; et al. Luciferase-Based Biosensors in the Era of the COVID-19 Pandemic. ACS Nanosci. Au 2021, 1, 15–37.
  15. Min, K.-L.; Steghens, J.-P. ADP is produced by firefly luciferase but its synthesis is independent of the light emitting properties. Biochimie 2001, 83, 523–528.
  16. Lemasters, J.J.; Hackenbrock, C.R. Firefly luciferase assay for ATP production by mitochondria. In Bioluminescence and Chemiluminescence; Elsevier: Amsterdam, The Netherlands, 1978; pp. 36–50.
  17. Deluca, M.; Mcelroy, W.D. Kinetics of the firefly luciferase catalyzed reactions. Biochemistry 1974, 13, 921–925.
  18. Kostyuk, A.I.; Demidovich, A.D.; Kotova, D.A.; Belousov, V.V.; Bilan, D.S. Circularly Permuted Fluorescent Protein-Based Indicators: History, Principles, and Classification. Int. J. Mol. Sci. 2019, 20, 4200.
  19. Yaginuma, H.; Kawai, S.; Tabata, K.V.; Tomiyama, K.; Kakizuka, A.; Komatsuzaki, T.; Noji, H.; Imamura, H. Diversity in ATP concentrations in a single bacterial cell population revealed by quantitative single-cell imaging. Sci. Rep. 2015, 4, 6522.
  20. Lobas, M.A.; Tao, R.; Nagai, J.; Kronschläger, M.T.; Borden, P.M.; Marvin, J.S.; Looger, L.L.; Khakh, B.S. A genetically encoded single-wavelength sensor for imaging cytosolic and cell surface ATP. Nat. Commun. 2019, 10, 711.
  21. Arai, S.; Kriszt, R.; Harada, K.; Looi, L.-S.; Matsuda, S.; Wongso, D.; Suo, S.; Ishiura, S.; Tseng, Y.-H.; Raghunath, M.; et al. RGB-Color Intensiometric Indicators to Visualize Spatiotemporal Dynamics of ATP in Single Cells. Angew. Chem. Int. Ed. 2018, 57, 10873–10878.
  22. Nguyen, P.T.M.; Ishiwata-Kimata, Y.; Kimata, Y. Monitoring ADP/ATP ratio in yeast cells using the fluorescent-protein reporter PercevalHR. Biosci. Biotechnol. Biochem. 2019, 83, 824–828.
  23. Tantama, M.; Martínez-François, J.R.; Mongeon, R.; Yellen, G. Imaging energy status in live cells with a fluorescent biosensor of the intracellular ATP-to-ADP ratio. Nat. Commun. 2013, 4, 2550.
  24. Berg, J.; Hung, Y.P.; Yellen, G. A genetically encoded fluorescent reporter of ATP:ADP ratio. Nat. Methods 2009, 6, 161–166.
  25. Atkinson, D.E. Energy charge of the adenylate pool as a regulatory parameter. Interaction with feedback modifiers. Biochemistry 1968, 7, 4030–4034.
  26. Tarasov, A.I.; Rutter, G.A. Use of Genetically Encoded Sensors to Monitor Cytosolic ATP/ADP Ratio in Living Cells. In Methods in Enzymology; Elsevier: Amsterdam, The Netherlands, 2014; pp. 289–311.
  27. Min, S.-H.; French, A.R.; Trull, K.J.; Tat, K.; Varney, S.A.; Tantama, M. Ratiometric BRET Measurements of ATP with a Genetically-Encoded Luminescent Sensor. Sensors 2019, 19, 3502.
  28. Yaginuma, H.; Okada, Y. Live cell imaging of metabolic heterogeneity by quantitative fluorescent ATP indicator protein, QUEEN-37C. bioRxiv 2021.
More
This entry is offline, you can click here to edit this entry!
Video Production Service