A continuously rising number of literature sources claiming the similarities of 3D cell culturing to in vivo data shows the self-depicting importance of mimicking the three-dimensional microenvironment for cell culture. The MatriGrid®s, tools and techniques for the construction of a family of polycarbonate substrate scaffolds. These scaffolds are suitable not only for cell culturing but also for the manipulation and evolution of embroid bodies, for mimicking stem cell niches, or for control of the behavior of tissue slices. Some of these scaffold-based approaches use polymeric scaffolds for shaping the evolving oligocellular agglomerates. Scaffold-based approaches allow us not only to define the shape of the agglomerates but also to control biophysical and mechanical properties such as stiffness, shear stress, and nutritious flow if integrated into lab-on-a-chip devices or bioreactors.
- scaffolds for 3D cell culture
- hepatocyte culture
- scaffold manufacturing
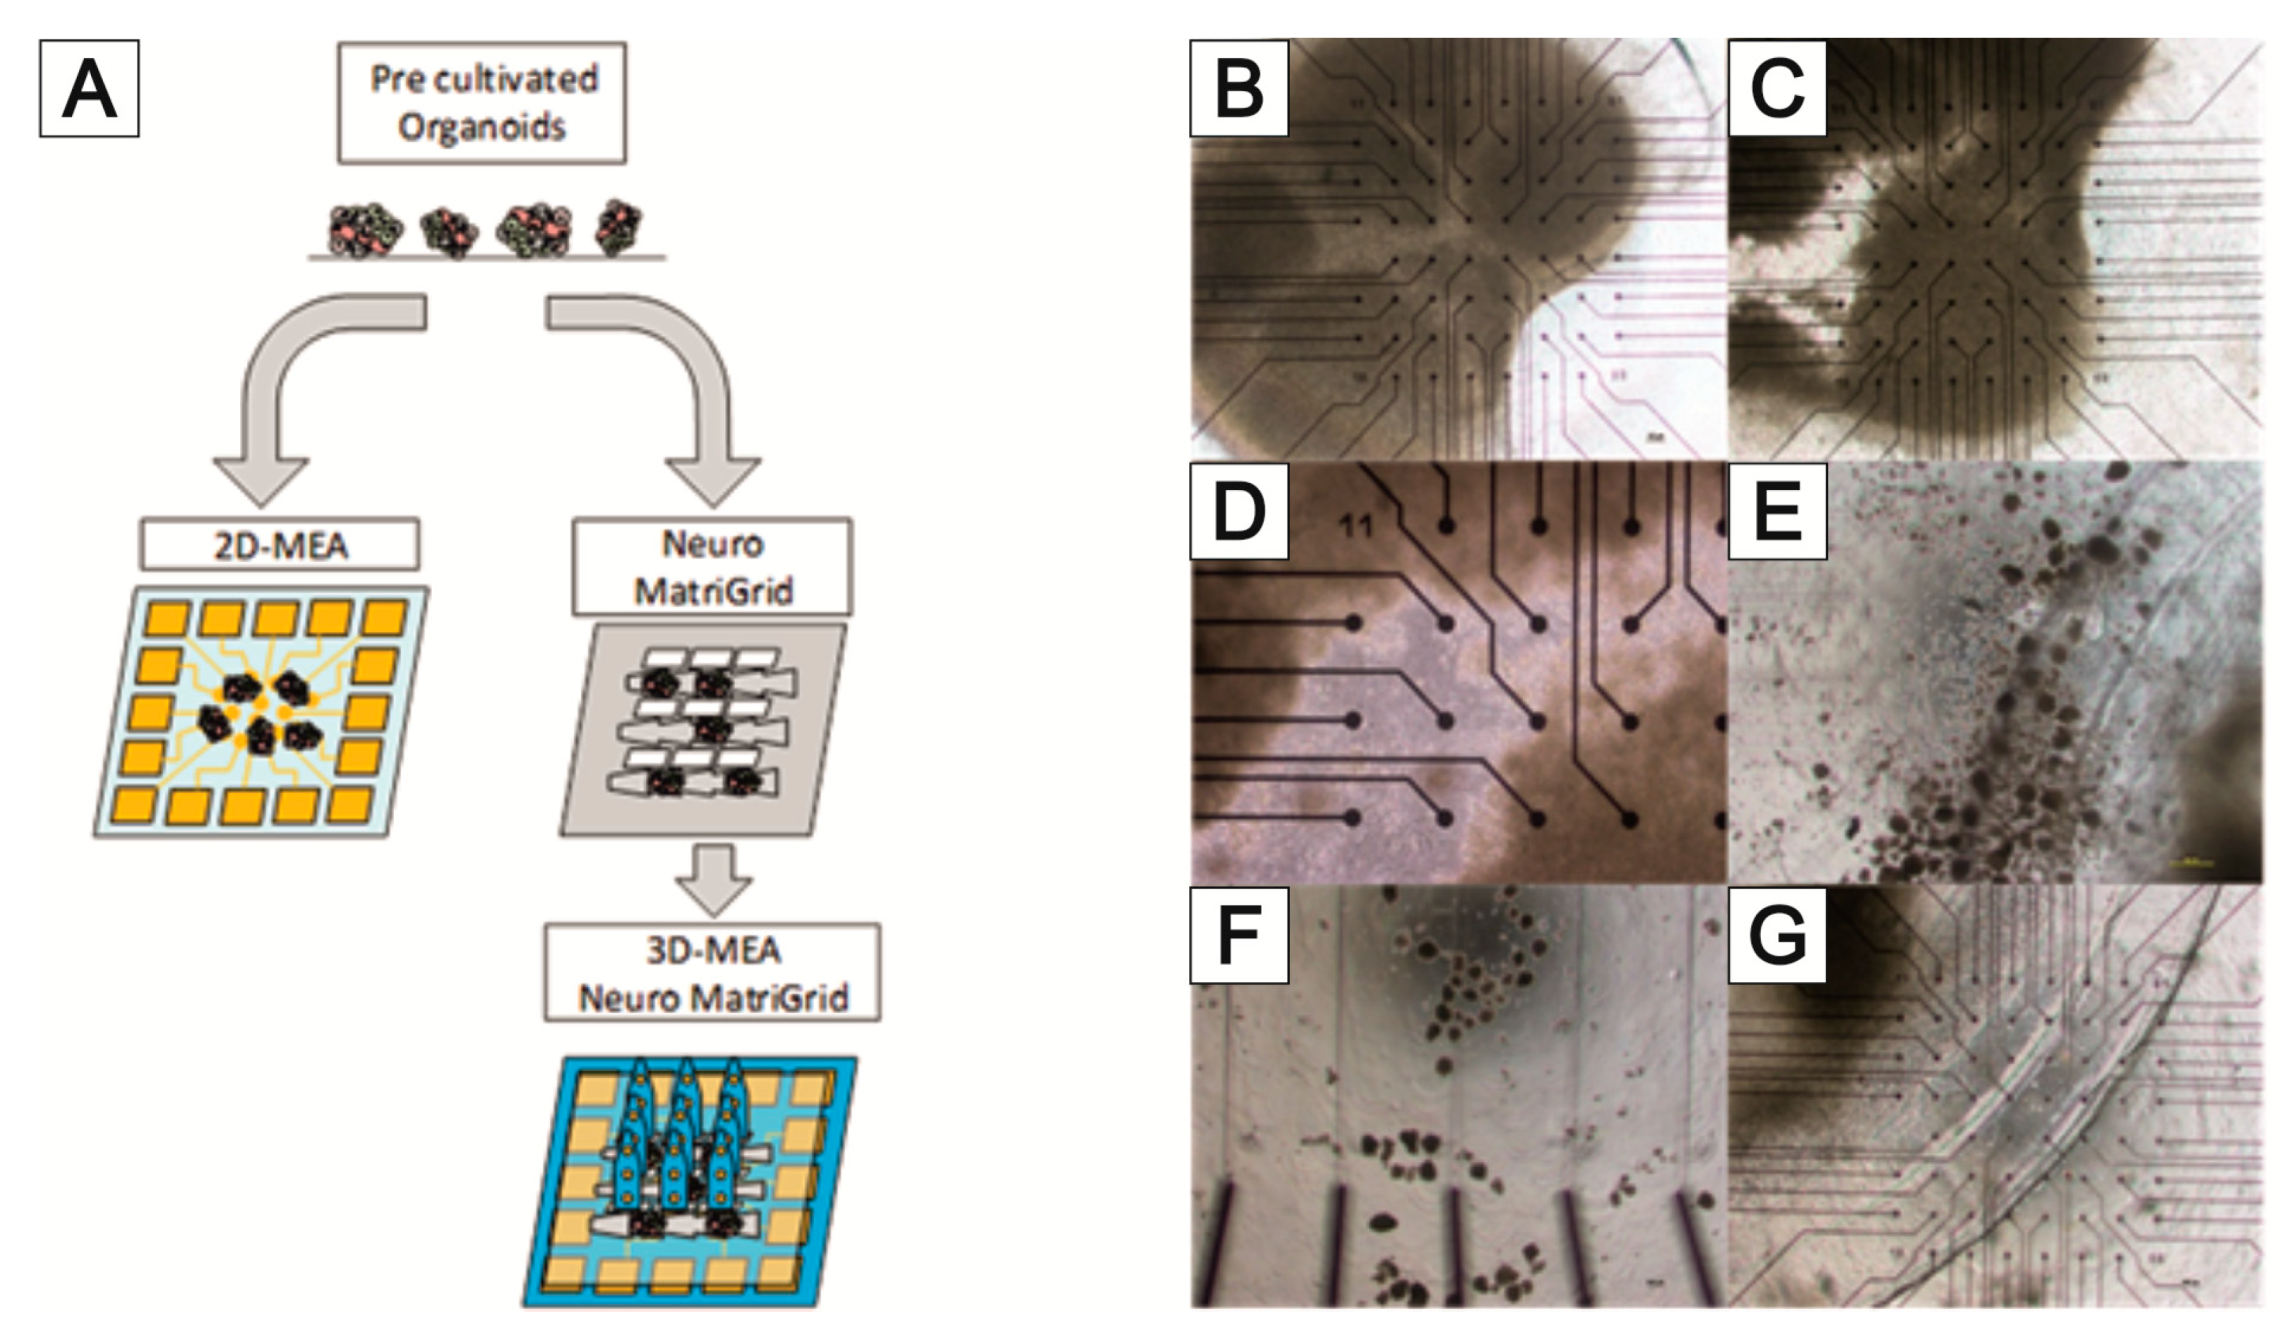
- MEA
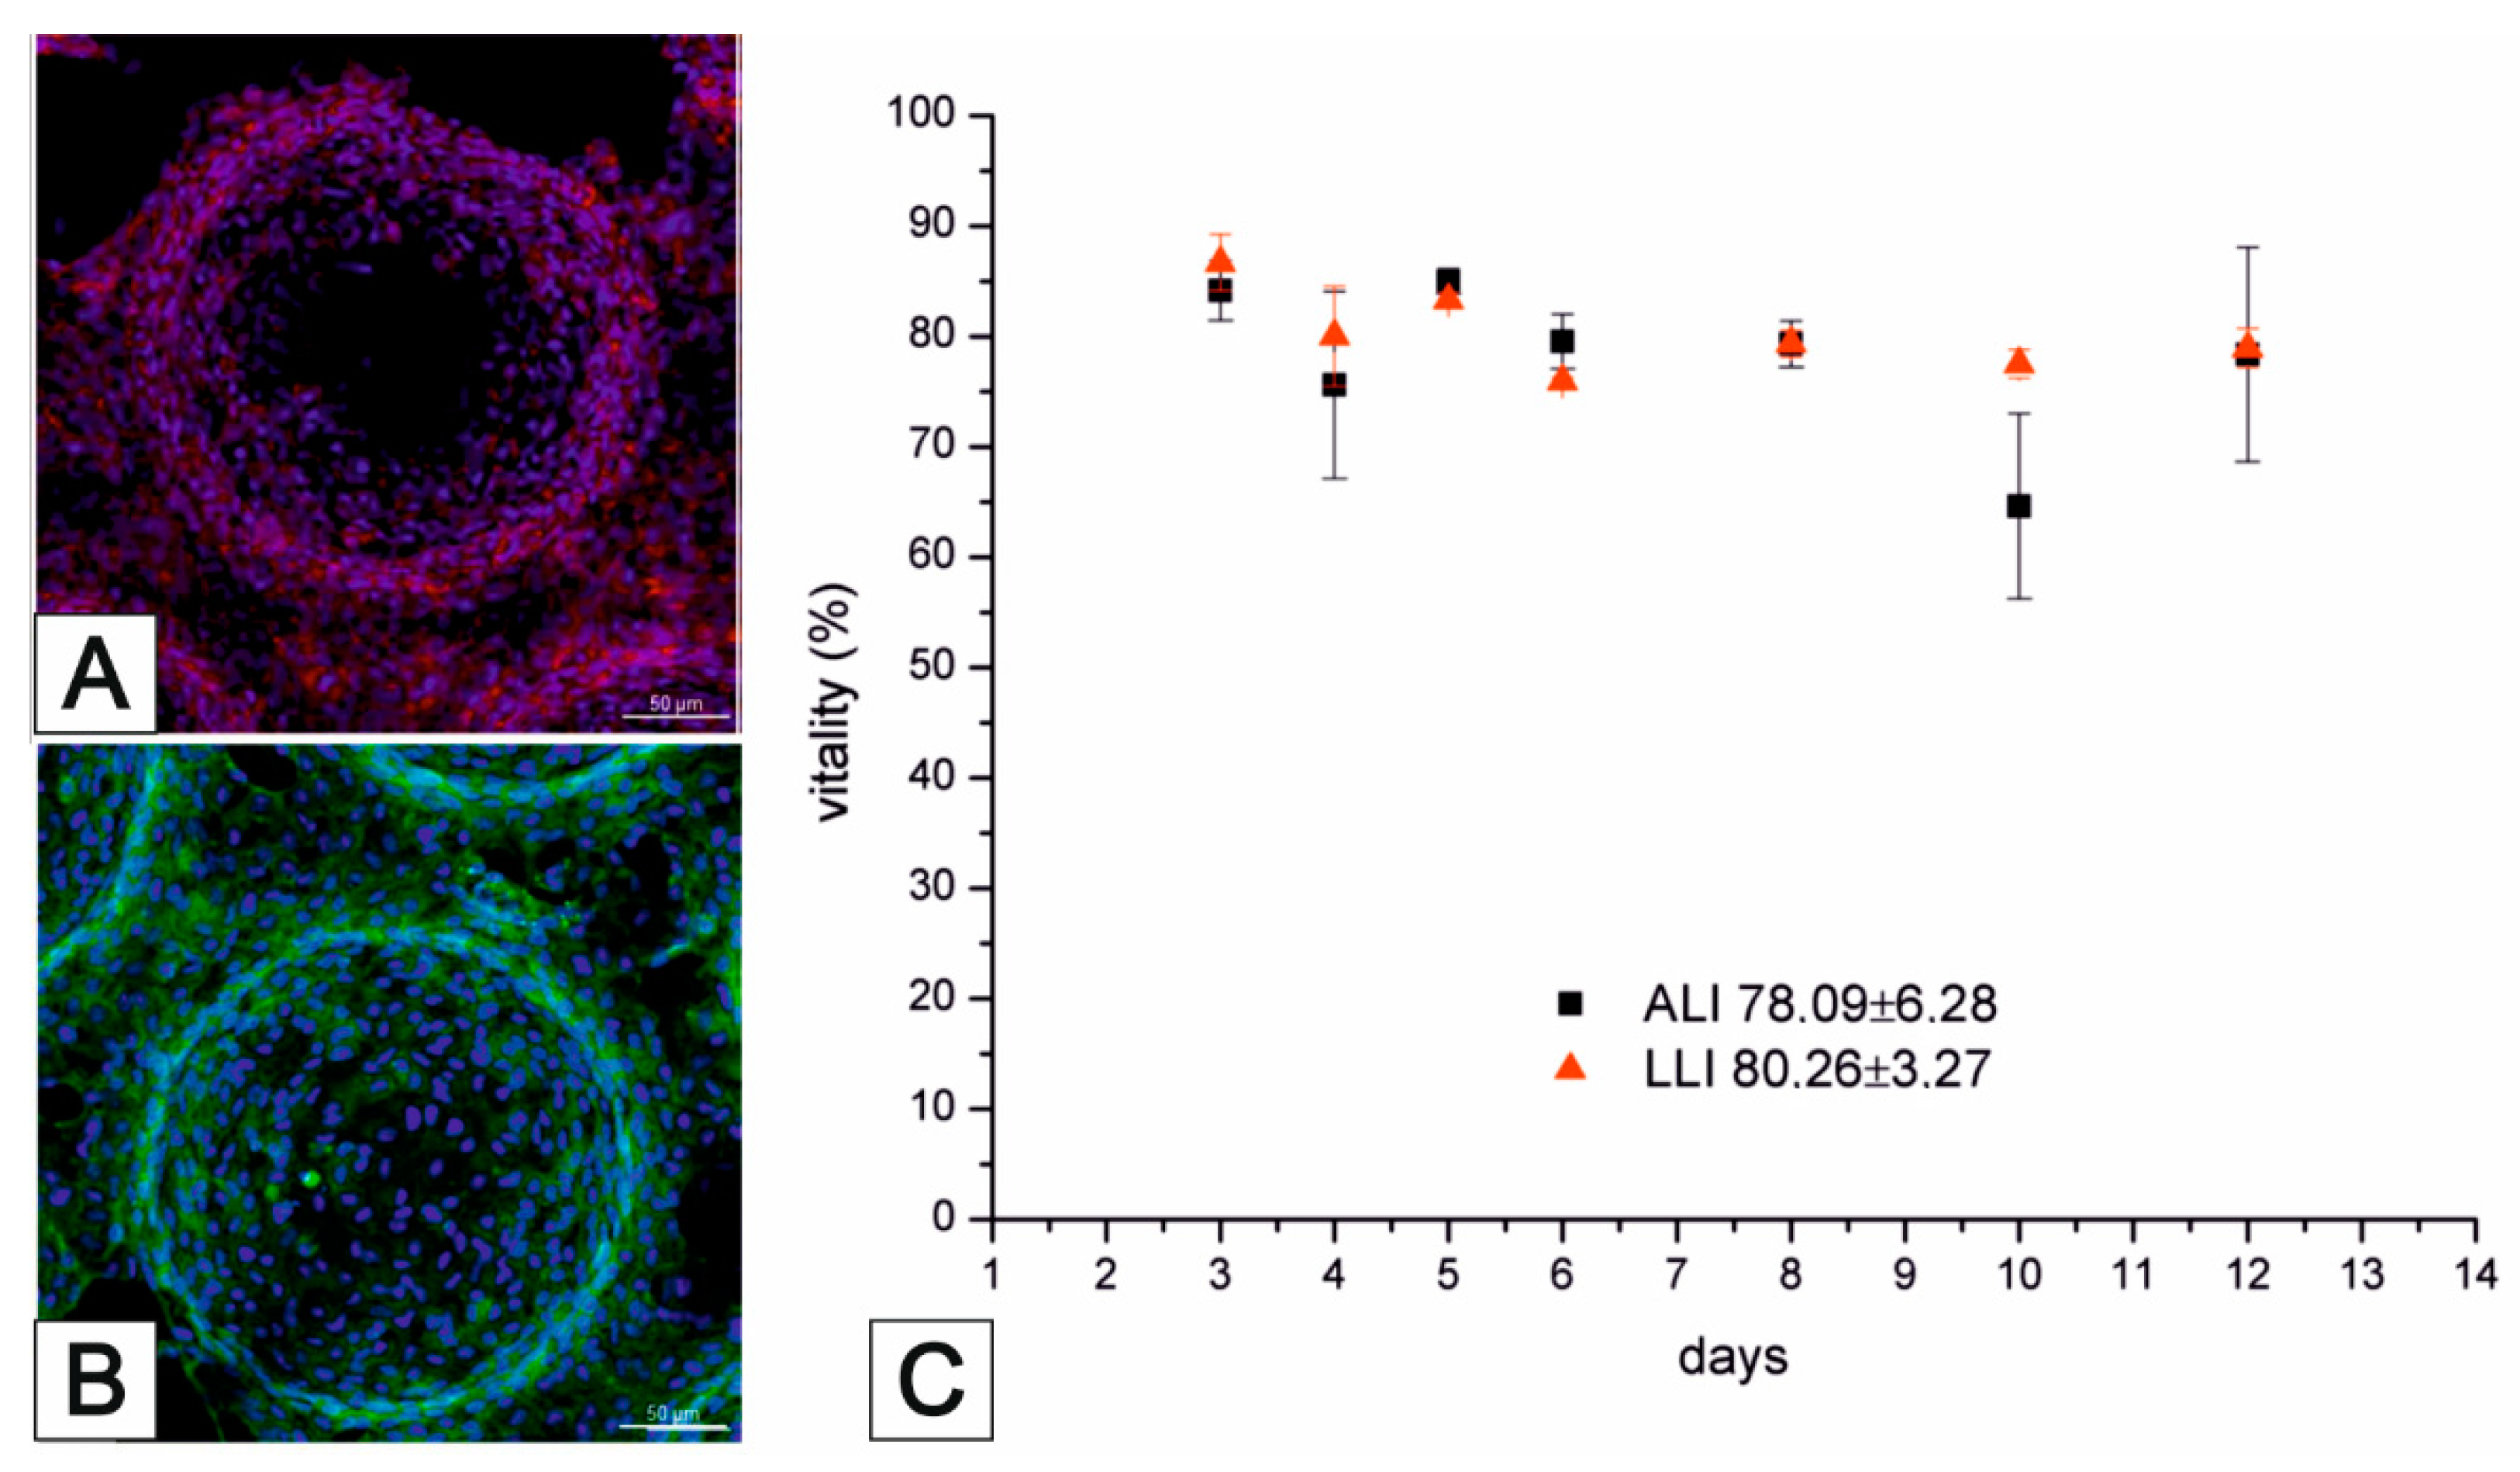
- A549 culture
- EAhy.926 culture
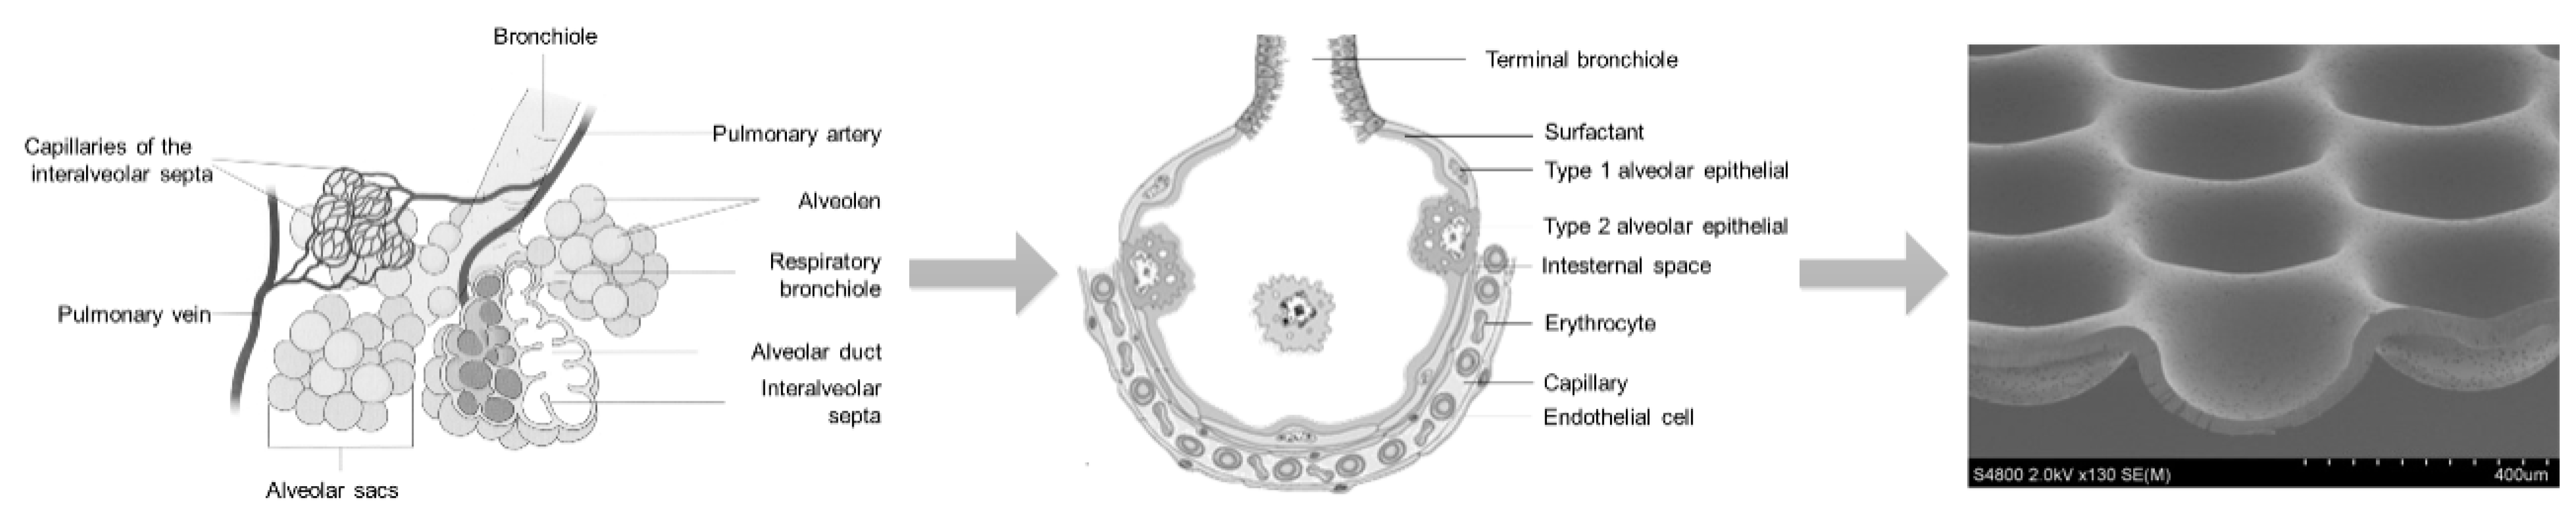
- Lung scaffold
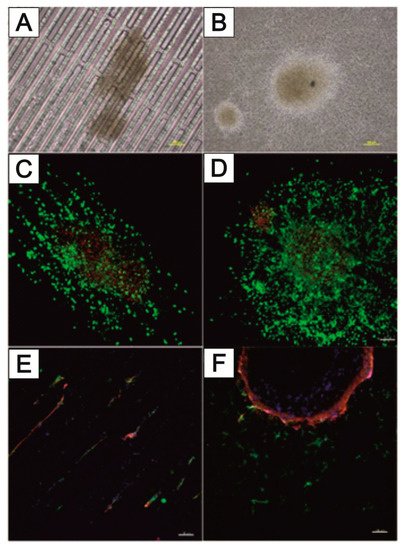
- neurosphere
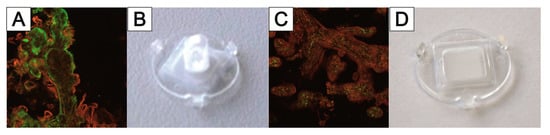
- placenta explants
1. The MatriGrid®-Family—Overview
2. Micro Thermoforming and Functionalization of MatriGrid®s
2.1. Micro Thermoforming


2.2. Microcontact Printing and Chemical Functionalization

3. The MatriGrid®-Family
3.1. 3D Hepato MatriGrid®

3.2. Lung MatriGrid®—An Example of Directed Oligocellular Coculture

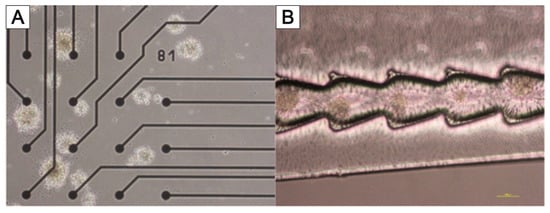
3.3. NeuroGrid®—Scaffolds for the Manipulation and Directed Growth of Neurons and Cerebral Organoids


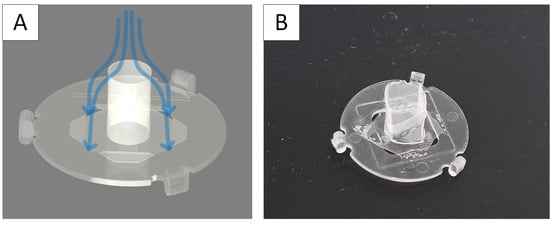
3.4. TissGrid®
This entry is adapted from the peer-reviewed paper 10.3390/bioengineering9050220
References
- Joseph, J.; Sundar, R.; John, A.; Abraham, A. Phytochemical Incorporated Drug Delivery Scaffolds for Tissue Regeneration. Regen. Eng. Transl. Med. 2018, 4, 167–176.
- Bialkowska, K.; Komorowski, P.; Bryszewska, M.; Milowska, K. Spheroids as a Type of Three-Dimensional Cell Cultures-Examples of Methods of Preparation and the Most Important Application. Int. J. Mol. Sci. 2020, 21, 6225.
- Breslin, S.; O’Driscoll, L. Three-dimensional cell culture: The missing link in drug discovery. Drug Discov. Today 2013, 18, 240–249.
- Lancaster, M.A.; Knoblich, J.A. Generation of cerebral organoids from human pluripotent stem cells. Nat. Protoc. 2014, 9, 2329–2340.
- Langer, R.; Tirrell, D.A. Designing materials for biology and medicine. Nature 2004, 428, 487–492.
- Chitcholtan, K.; Asselin, E.; Parent, S.; Sykes, P.H.; Evans, J.J. Differences in growth properties of endometrial cancer in three dimensional (3D) culture and 2D cell monolayer. Exp. Cell Res. 2013, 319, 75–87.
- Bier, W.; Dertinger, H.; Knedlitschek, G.; Schaller, T.; Schubert, K.; Weibezahn, K.F. Substrat Für Zellkulturen und Kultur Von Zellen Oder Zellaggregaten. Patent DE000004132379A1, 8 April 1993.
- Doering, M.; Eigen, M.; Guenther, R.; Henco, K.; Koehler, M.; Schober, A.; Schweinhorst, A.; Thuerk, M. Probentraeger und Seine Verwendung. Patent WO001995001559A3, 1995.
- Giselbrecht, S.; Gietzelt, T.; Gottwald, E.; Trautmann, C.; Truckenmuller, R.; Weibezahn, K.F.; Welle, A. 3D tissue culture substrates produced by microthermoforming of pre-processed polymer films. Biomed. Microdevices 2006, 8, 191–199.
- Schober, A.; Fernekorn, U.; Singh, S.; Schlingloff, G.; Gebinoga, M.; Hampl, J.; Williamson, A. Mimicking the biological world: Methods for the 3D structuring of artificial cellular environments. Eng. Life Sci. 2013, 13, 352–367.
- Schober, A.; Hampl, J. Mikrostrukturierter Formkörper Mit Perforierten Teilen und Verfahren Zu Dessen Herstellung. Patent EP 2,403,630, 27 September 2009.
- Borowiec, J.; Hampl, J.; Gebinoga, M.; Elsarnagawy, T.; Elnakady, Y.A.; Fouad, H.; Almajhadi, F.; Fernekorn, U.; Weise, F.; Singh, S.; et al. Thermoforming techniques for manufacturing porous scaffolds for application in 3D cell cultivation. Mater. Sci. Eng. C Mater. Biol. Appl. 2015, 49, 509–516.
- Fernekorn, U.; Hampl, J.; Augspurger, C.; Hildmann, C.; Weise, F.; Klett, M.; Laffert, A.; Gebinoga, M.; Williamson, A.; Schober, A. In vitro cultivation of biopsy derived primary hepatocytes leads to a more metabolic genotype in perfused 3D scaffolds than static 3D cell culture. RSC Adv. 2013, 3, 16558–16568.
- Bingel, C.; Koeneke, E.; Ridinger, J.; Bittmann, A.; Sill, M.; Peterziel, H.; Wrobel, J.; Rettig, I.; Milde, T.; Fernekorn, U.; et al. Three-dimensional tumor cell growth stimulates autophagic flux and recapitulates chemotherapy resistance. Cell Death Dis. 2017, 8, e3013.
- Zeussel, L.; Hampl, J.; Weise, F.; Singh, S.; Schober, A. Bio-inspired 3D micro structuring of a liver lobule via direct laser writing: A comparative study with SU-8 and SUEX. J. Laser Appl. 2022, 34, 012007.
- Mai, P.; Fernekorn, U.; Hampl, J.; Schober, A.; Foth, H. Deutsche Gesellschaft für Experimentelle und Klinische Pharmakologie und Toxikologie e.V. Naunyn-Schmiedeberg’s Arch. Pharmacol. 2014, 387, 1–113.
- Schneider, D.; Schumann, B.; Glahn, F.; Krings, O.; Tomisch, L.; Thomas, S.; Bacanli, M.; Mai, P.; Schober, A.; Foth, H. Establishment of a lung cell Co-culture model for nanoparticle aerosol exposition. Naunyn-Schmiedeberg’s Arch. Pharmacol. 2020, 393, 56.
- Marx-Blümel, L.; Marx, C.; Weise, F.; Frey, J.; Perner, B.; Schlingloff, G.; Lindig, N.; Hampl, J.; Sonnemann, J.; Brauer, D.; et al. Biomimetic reconstruction of the hematopoietic stem cell niche for in vitro amplification of human hematopoietic stem cells. PLoS ONE 2020, 15, e0234638.
- Marx-Blümel, L.; Marx, C.; Sonnemann, J.; Weise, F.; Hampl, J.; Frey, J.; Rothenburger, L.; Cirri, E.; Rahnis, N.; Koch, P.; et al. Molecular characterization of hematopoietic stem cells after in vitro amplification on biomimetic 3D PDMS cell culture scaffolds. Sci. Rep. 2021, 11, 21163.
- Schober, A.; Hampl, J.; Weise, F.; Borowiec, J.; Fernekorn, U.; Gebinoga, M.; Singh, S.; Schlingloff, G.; Häfner, S.; Beck, J.; et al. Reproduction of a Stem Cell Niche of an Organism and Method for the Generation Thereof. U.S. Patent 10,780,613, 22 September 2020.
- Borowiec, J.W. Fabrication and characterization of microstructured scaffolds for complex 3D cell cultures. Ilmenau 2022.
- Schober, A.; Hampl, J.; Weise, F. Mikrostrukturierter Formkoerper mit perforierten Teilen und Verfahren zu dessen Herstellung. Patent WO2011035938A1, 31 March 2011.
- Worgull, M. Hot Embossing. In Micromanufacturing Engineering and Technology; William Andrew Publishing: Boston, MA, USA, 2009; pp. 68–89.
- Sekhon, G.S.; Kumar, S.; Kaur, C.; Verma, N.K.; Chakarvarti, S.K. Effect of thermal annealing on pore density, pore size and pore homogeneity of polycarbonate NTFs. Radiat. Meas. 2008, 43, 1357–1359.
- Martinez-Rivas, A.; González-Quijano, G.K.; Proa-Coronado, S.; Séverac, C.; Dague, E. Methods of Micropatterning and Manipulation of Cells for Biomedical Applications. Micromachines 2017, 8, 347.
- Waterkotte, B.; Bally, F.; Nikolov, P.; Waldbaur, A.; Rapp, B.; Truckenmüller, R.; Lahann, J.; Schmitz, K.; Giselbrecht, S. Biofunctional Micropatterning of Thermoformed 3D Substrates. Adv. Funct. Mater. 2014, 24, 442–450.
- Sun, Y.; Jallerat, Q.; Szymanski, J.M.; Feinberg, A.W. Conformal nanopatterning of extracellular matrix proteins onto topographically complex surfaces. Nat. Methods 2015, 12, 134–136.
- Moraes, C.; Kim, B.C.; Zhu, X.; Mills, K.L.; Dixon, A.R.; Thouless, M.D.; Takayama, S. Defined topologically-complex protein matrices to manipulate cell shape via three-dimensional fiber-like patterns. Lab Chip 2014, 14, 2191–2201.
- Borowiec, J.; Hampl, J.; Singh, S.; Haefner, S.; Friedel, K.; Mai, P.; Brauer, D.; Ruther, F.; Liverani, L.; Boccaccini, A.; et al. 3D Microcontact Printing for Combined Chemical and Topographical Patterning on Porous Cell Culture Membrane. ACS Appl. Mater. Interfaces 2018, 10, 22857–22865.
- Kaufmann, T.; Ravoo, B.J. Stamps, inks and substrates: Polymers in microcontact printing. Polym. Chem. 2010, 1, 371–387.
- Truckenmüller, R.; Giselbrecht, S.; Rivron, N.; Gottwald, E.; Saile, V.; Van den Berg, A.; Wessling, M.; Van Blitterswijk, C. Thermoforming of film-based biomedical microdevices. Adv. Mater. 2011, 23, 1311–1329.
- Tobola, J.; Gebinoga, M.; Hampl, J.; Elsarnagawy, T.; Elnakady, Y.A.; Fouad, H.; Almajhadi, F.; Fernekorn, U.; Weise, F.; Klett, M.; et al. 3D polylactide scaffolds and polylactic -polycarbonate composite scaffolds manufactured through thermoforming for application in advanced cell culture. BioNanoMaterials 2012, 13, 27–35.
- Lee, S.J.; San Choi, J.; Park, K.S.; Khang, G.; Lee, Y.M.; Lee, H.B. Response of MG63 osteoblast-like cells onto polycarbonate membrane surfaces with different micropore sizes. Biomaterials 2004, 25, 4699–4707.
- Singh, S.; Lei, Y.; Schober, A. Direct extraction of carbonyl from waste polycarbonate with amines under environmentally friendly conditions: Scope of waste polycarbonate as a carbonylating agent in organic synthesis. RSC Adv. 2015, 5, 3454–3460.
- Singh, S.; Friedel, K.; Himmerlich, M.; Lei, Y.; Schlingloff, G.; Schober, A. Spatiotemporal Photopatterning on Polycarbonate Surface through Visible Light Responsive Polymer Bound DASA Compounds. ACS Macro Lett. 2015, 4, 1273–1277.
- Singh, S.; Mai, P.; Borowiec, J.; Zhang, Y.; Lei, Y.; Schober, A. Donor-acceptor Stenhouse adduct-grafted polycarbonate surfaces: Selectivity of the reaction for secondary amine on surface. R. Soc. Open Sci. 2018, 5, 180207.
- Lee, H.; Chae, S.; Kim, J.Y.; Han, W.; Kim, J.; Choi, Y.; Cho, D.-W. Cell-printed 3D liver-on-a-chip possessing a liver microenvironment and biliary system. Biofabrication 2019, 11, 025001.
- Wang, Y.; Wang, H.; Deng, P.; Chen, W.; Guo, Y.; Tao, T.; Qin, J. In situ differentiation and generation of functional liver organoids from human iPSCs in a 3D perfusable chip system. Lab Chip 2018, 18, 3606–3616.
- Shah, U.-K.; Mallia, J.d.O.; Singh, N.; Chapman, K.E.; Doak, S.H.; Jenkins, G.J.S. A three-dimensional in vitro HepG2 cells liver spheroid model for genotoxicity studies. Mutat. Res. Genet. Toxicol. Environ. Mutagenesis 2018, 825, 51–58.
- Gomez-Lechon, M.J.; Tolosa, L.; Conde, I.; Donato, M.T. Competency of different cell models to predict human hepatotoxic drugs. Expert Opin. Drug Metab. Toxicol. 2014, 10, 1553–1568.
- Levy, G.; Bomze, D.; Heinz, S.; Ramachandran, S.D.; Noerenberg, A.; Cohen, M.; Shibolet, O.; Sklan, E.; Braspenning, J.; Nahmias, Y. Long-term culture and expansion of primary human hepatocytes. Nat. Biotechnol. 2015, 33, 1264–1271.
- Noerenberg, A.; Heinz, S.; Scheller, K.; Hewitt, N.; Braspenning, J.; Ott, M. Optimization of upcyte (R) human hepatocytes for the in vitro micronucleus assay. Mutat. Res. 2013, 758, 69–79.
- Tolosa, L.; Gomez-Lechon, M.J.; Lopez, S.; Guzman, C.; Castell, J.V.; Donato, M.T.; Jover, R. Human Upcyte Hepatocytes: Characterization of the Hepatic Phenotype and Evaluation for Acute and Long-Term Hepatotoxicity Routine Testing. Toxicol. Sci. 2016, 152, 214–229.
- Burkard, A.; Dähn, C.; Heinz, S.; Zutavern, A.; Sonntag-Buck, V.; Maltman, D.; Przyborski, S.; Hewitt, N.J.; Braspenning, J. Generation of proliferating human hepatocytes using Upcyte® technology: Characterisation and applications in induction and cytotoxicity assays. Xenobiotica 2012, 42, 939–956.
- Broeders, J.J.; Parmentier, C.; Truisi, G.L.; Josse, R.; Alexandre, E.; Savary, C.C.; Hewitt, P.G.; Mueller, S.O.; Guillouzo, A.; Richert, L.; et al. Biokinetics of chlorpromazine in primary rat and human hepatocytes and human HepaRG cells after repeated exposure. Toxicol. Vitr. 2015, 30, 52–61.
- Mueller, D.; Kramer, L.; Hoffmann, E.; Klein, S.; Noor, F. 3D organotypic HepaRG cultures as in vitro model for acute and repeated dose toxicity studies. Toxicol. Vitr. 2014, 28, 104–112.
- Alfaro-Moreno, E.; Nawrot, T.S.; Vanaudenaerde, B.M.; Hoylaerts, M.F.; Vanoirbeek, J.A.; Nemery, B.; Hoet, P.H. Co-cultures of multiple cell types mimic pulmonary cell communication in response to urban PM10. Eur. Respir. J. 2008, 32, 1184–1194.
- Hermanns, M.I.; Fuchs, S.; Bock, M.; Wenzel, K.; Mayer, E.; Kehe, K.; Bittinger, F.; Kirkpatrick, C.J. Primary human coculture model of alveolo-capillary unit to study mechanisms of injury to peripheral lung. Cell Tissue Res. 2009, 336, 91–105.
- Klein, S.G.; Serchi, T.; Hoffmann, L.; Blomeke, B.; Gutleb, A.C. An improved 3D tetraculture system mimicking the cellular organisation at the alveolar barrier to study the potential toxic effects of particles on the lung. Part. Fibre Toxicol. 2013, 10, 31.
- Rothen-Rutishauser, B.M.; Kiama, S.G.; Gehr, P. A three-dimensional cellular model of the human respiratory tract to study the interaction with particles. Am. J. Respir. Cell Mol. Biol. 2005, 32, 281–289.
- Khalid, M.A.U.; Kim, Y.S.; Ali, M.; Lee, B.G.; Cho, Y.-J.; Choi, K.H. A lung cancer-on-chip platform with integrated biosensors for physiological monitoring and toxicity assessment. Biochem. Eng. J. 2020, 155, 107469.
- Huh, D.; Matthews, B.D.; Mammoto, A.; Montoya-Zavala, M.; Hsin, H.Y.; Ingber, D.E. Reconstituting Organ-Level Lung Functions on a Chip. Science 2010, 328, 1662–1668.
- Huang, D.; Liu, T.; Liao, J.; Maharjan, S.; Xie, X.; Pérez, M.; Anaya, I.; Wang, S.; Tirado Mayer, A.; Kang, Z.; et al. Reversed-engineered human alveolar lung-on-a-chip model. Proc. Natl. Acad. Sci. USA 2021, 118, e2016146118.
- Stucki, A.O.; Stucki, J.D.; Hall, S.R.; Felder, M.; Mermoud, Y.; Schmid, R.A.; Geiser, T.; Guenat, O.T. A lung-on-a-chip array with an integrated bio-inspired respiration mechanism. Lab Chip 2015, 15, 1302–1310.
- Mermoud, Y.; Felder, M.; Stucki, J.D.; Stucki, A.O.; Guenat, O.T. Microimpedance tomography system to monitor cell activity and membrane movements in a breathing lung-on-chip. Sens. Actuators B Chem. 2018, 255, 3647–3653.
- Zamprogno, P.; Wuthrich, S.; Achenbach, S.; Thoma, G.; Stucki, J.D.; Hobi, N.; Schneider-Daum, N.; Lehr, C.M.; Huwer, H.; Geiser, T.; et al. Second-generation lung-on-a-chip with an array of stretchable alveoli made with a biological membrane. Commun. Biol. 2021, 4, 168.
- Hoppin, J.A.; Umbach, D.M.; London, S.J.; Lynch, C.F.; Alavanja, M.C.R.; Sandler, D.P. Pesticides and adult respiratory outcomes in the agricultural health study. Ann. N. Y. Acad. Sci. 2006, 1076, 343–354.
- Gehr, P.; Bachofen, M.; Weibel, E.R. Normal Human Lung-Ultrastructure and Morphometric Estimation of Diffusion Capacity. Resp. Physiol. 1978, 32, 121–140.
- Farrukh, A.; Zhao, S.F.; del Campo, A. Microenvironments Designed to Support Growth and Function of Neuronal Cells. Front. Mater. 2018, 5, 62.
- Li, N.; Folch, A. Integration of topographical and biochemical cues by axons during growth on microfabricated 3-D substrates. Exp. Cell Res. 2005, 311, 307–316.
- Simitzi, C.; Ranella, A.; Stratakis, E. Controlling the morphology and outgrowth of nerve and neuroglial cells: The effect of surface topography. Acta Biomater. 2017, 51, 21–52.
- Ristola, M.; Fedele, C.; Hagman, S.; Sukki, L.; Kapucu, F.E.; Mzezewa, R.; Hyvarinen, T.; Kallio, P.; Priimagi, A.; Narkilahti, S. Directional Growth of Human Neuronal Axons in a Microfluidic Device with Nanotopography on Azobenzene-Based Material. Adv. Mater. Interfaces 2021, 8, 2100048.
- Gladkov, A.; Pigareva, Y.; Kutyina, D.; Kolpakov, V.; Bukatin, A.; Mukhina, I.; Kazantsev, V.; Pimashkin, A. Design of Cultured Neuron Networks in vitro with Predefined Connectivity Using Asymmetric Microfluidic Channels. Sci. Rep. 2017, 7, 15625.
- Yoshida, S.; Kato-Negishi, M.; Takeuchi, S. Assembly and Connection of Micropatterned Single Neurons for Neuronal Network Formation. Micromachines 2018, 9, 235.
- Ming, Y.; Abedin, M.J.; Tatic-Lucic, S.; Berdichevsky, Y. Microdevice for directional axodendritic connectivity between micro 3D neuronal cultures. Microsyst. Nanoeng. 2021, 7, 67.
- Duc, P.; Vignes, M.; Hugon, G.; Sebban, A.; Carnac, G.; Malyshev, E.; Charlot, B.; Rage, F. Human neuromuscular junction on micro-structured microfluidic devices implemented with a custom micro electrode array (MEA). Lab Chip 2021, 21, 4223–4236.
- Lee, N.; Park, J.W.; Kim, H.J.; Yeon, J.H.; Kwon, J.; Ko, J.J.; Oh, S.H.; Kim, H.S.; Kim, A.; Han, B.S.; et al. Monitoring the differentiation and migration patterns of neural cells derived from human embryonic stem cells using a microfluidic culture system. Mol. Cells 2014, 37, 497–502.
- Hasan, M.F.; Ghiasvand, S.; Wang, H.; Miwa, J.M.; Berdichevsky, Y. Neural layer self-assembly in geometrically confined rat and human 3D cultures. Biofabrication 2019, 11, 045011.
- Roe, A.W. Columnar connectome: Toward a mathematics of brain function. Netw. Neurosci. 2019, 3, 779–791.
- Chavoshnejad, P.; Li, X.; Zhang, S.; Dai, W.; Vasung, L.; Liu, T.; Zhang, T.; Wang, X.; Razavi, M.J. Role of axonal fibers in the cortical folding patterns: A tale of variability and regularity. Brain Multiphysics 2021, 2, 100029.
- Tanaka, Y.; Yamato, M.; Okano, T.; Kitamori, T.; Sato, K. Evaluation of effects of shear stress on hepatocytes by a microchip-based system. Meas. Sci. Technol. 2006, 17, 3167–3170.
- Horikawa, A.; Okada, K.; Sato, K.; Sato, M. Morphological Changes in Osteoblastic Cells (MC3T3-E1) due to Fluid Shear Stress: Cellular Damage by Prolonged Application of Fluid Shear Stress. Tohoku J. Exp. Med. 2000, 191, 127–137.
- Kim, L.; Toh, Y.C.; Voldman, J.; Yu, H. A practical guide to microfluidic perfusion culture of adherent mammalian cells. Lab Chip 2007, 7, 681–694.
- Van Midwoud, P.M. An Alternative Approach Based on Microfluidics to Study Drug Metabolism and Toxicity Using Liver and Intestinal Tissue. Ph. D. Thesis, University of Groningen, Groningen, The Netherlands, 2010.
- van Midwoud, P.M.; Merema, M.T.; Verpoorte, E.; Groothuis, G.M.M. Microfluidics Enables Small-Scale Tissue-Based Drug Metabolism Studies with Scarce Human Tissue. J. Assoc. Lab. Autom. 2011, 16, 468–476.
- Pemathilaka, R.L.; Reynolds, D.E.; Hashemi, N.N. Drug transport across the human placenta: Review of placenta-on-a-chip and previous approaches. Interface Focus 2019, 9, 20190031.
- Yin, F.; Zhu, Y.; Zhang, M.; Yu, H.; Chen, W.; Qin, J. A 3D human placenta-on-a-chip model to probe nanoparticle exposure at the placental barrier. Toxicol. Vitr. 2019, 54, 105–113.
- Morley, L.C.; Beech, D.J.; Walker, J.J.; Simpson, N.A.B. Emerging concepts of shear stress in placental development and function. Mol. Hum. Reprod. 2019, 25, 329–339.
- Schober, A.; Weise, F.; Hampl, J. Cell Culture Carrier. Patent WO2019114997A1, 2019.