Your browser does not fully support modern features. Please upgrade for a smoother experience.
Please note this is an old version of this entry, which may differ significantly from the current revision.
Subjects:
Others
|
Infectious Diseases
Phage ImmunoPrecipitation Sequencing (PhIP-Seq) is a serological technology that is revolutionizing the manner in which we track antibody profiles. It is an antigen-specific antibody detection assay that is high throughput, highly sensitive, and mega-plexable (i.e., ability of plexing over a large number of different peptides).
- phage-immunoprecipitation sequencing
- PhIP-Seq
- phage
- antibody
Phage ImmunoPrecipitation Sequencing (PhIP-Seq) is an antigen-specific antibody detection assay that is high throughput, highly sensitive, and mega-plexable (i.e., ability of plexing over a large number of different peptides). Numerous PhIP-Seq libraries panning different types of proteins have been developed. Following the seminal study identifying autoantigens [9], PhIP-Seq has since been expanded to include infectious diseases, such as viruses (including numerous human viruses, arthropod-borne viruses, SARS-CoV-2, etc.) [19,20,21], and bacteria (mostly in the form of human microbiota) [22]. A schematic representation of the typical PhIP-Seq workflow is displayed in Figure 1 [23].
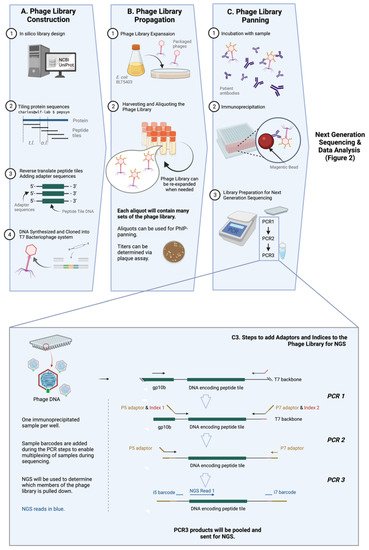
Figure 1. General workflow of PhIP-Seq. The PhIP-Seq methodology is composed of four key steps: (A) phage library construction, (B) phage library propagation, (C) phage library panning, and data analysis (displayed in Figure 2). (Inset) Addition of adapters and indices to immunoprecipitated phage sample using PCR (step C3 of Figure 1A is described in detail). Abbreviations: tile length (t.l.), overlap length (o.l.). Created with BioRender.com.
1. Phage Library Construction
Library design is rational [22] and does not require tissue, transcripts, directional cloning, or in-frame open reading frames (ORFs) determination. Almost any genetic sequence, regardless of its identity and whether it has been previously expressed or purified, can be cloned and tested via PhIP-Seq. This versatility allows for numerous known strains and infectious pathogens (viruses [24,25], and possibly parasites and fungi, etc.), as well as relatively new pathogens to be easily included in PhIP-Seq libraries when available. Libraries containing targets to novel pathogens, like SARS-CoV-2, can be made with relative ease, as seen in Shrock et al. [19] (Figure 1A).
One of the key improvements of PhIP-Seq is its use of an in-silico designed and custom-built library. Unlike traditional phage display, PhIP-Seq’s library is composed of sequences with defined lengths, overlaps, and a known annotation (e.g., 56 amino acid tiles with 28 amino acid overlap, as in the case for the VirScan—one of the earliest PhIP-Seq libraries) [20]. The tools (pepsyn, a Python-based tool that designs peptide libraries) and the shell codes required for the design of these customized libraries are readily available online [23]. Briefly, the set of codes converts the input amino acid sequences (in the fasta file format) to nucleic acid sequences that codes for the corresponding peptide set tile length and tile overlap. The sequences can then be synthesized using a microarray-based DNA synthesis platform, which may then be cloned into a commercially-available T7 phage display system.
2. Phage Library Propagation
The PhIP-Seq system utilizes the T7 bacteriophage, a lytic phage, as its powerhouse to express antigens for detection. T7 bacteriophage expresses copies of the target epitope or peptide on its surface, and the identity of this target epitope is reflected in its genomic sequence. PhIP-Seq is composed of ‘live’ phages, i.e., replication-competent phages [26]. Phages (Figure 1B) are expanded within a specified bacterial host grown on solid phase, and progeny phages in supernatant are collected. These progeny phages will carry the same genetic information and therefore, the same corresponding peptide tiles on their surface as the parental phages. Upon expansion, the phage library can be used for further expansion or for PhIP-Seq experiments.
3. Phage Immunoprecipitation
Immunoprecipitation of PhIP-Seq phages with antibodies is typically straightforward and not very different from traditional phage display. Patient or animal [27] sera or cerebrospinal fluid (CSF) (or theoretically, any biological fluid containing antibodies, such as saliva, urine, etc.) can be used to probe PhIP-Seq libraries. Biological samples are typically first measured by ELISA to ensure the presence of antigen-specific immunoglobulin. This is followed by the incubation of antibody-containing sample and the peptide-displaying phages, and then an immunoprecipitation step which typically involves protein A/G on magnetic beads. (Figure 1C) More detailed investigations into isotype- (i.e., IgG, IgA, IgM or IgE, etc.) or subclass (i.e., IgG1, IgG2, IgG3, IgG4 etc.)-specific humoral responses can also be conducted by pulling down using beads coated with the relevant anti-isotype or anti-subclass monoclonal antibody [28] or reagents. For example, in one published study, the authors used streptavidin-coupled magnetic beads with biotin-conjugated omalizumab to pull down and study IgE-specific responses [29].
Before the identity of immunoprecipitated phages can then be determined with high throughput sequencing, a few steps of pre-processing are required. This involves amplifying the peptide tile specific sequence of the phage genome by polymerase chain reaction (PCR), subsequently adding sample barcodes and eventually the next generation sequencing (NGS) adaptors, e.g., P5 and P7 (Figure 1C and the inset). Sample barcodes used to identify individual samples as PhIP-Seq runs are typically multiplexed given the read depths of modern NGS systems.
The high sensitivity provided by using molecular sequencing as the detection method, can lead to some assay background. To account for background signal, each run is typically supplemented with a number of negative controls (i.e., immunoprecipitation of phage library in the presence of PBS only) and library controls (i.e., where only the input library is sequenced). The former captures the background due to direct phage-bead interaction in the absence of antibodies or components from biological samples, while the latter captures the available breadth of the library. Additionally, technical duplicates can also be run for each sample and averaged to improve accuracy [24,30]. In other works, antibody binding to rare or uncommon viruses (such as Rabies and Ebola virus) are used as baseline controls for samples to account for sample-to-sample variations in sequencing depth [31]. Intra-subject comparison of time-course samples (i.e., samples taken from pre- and post-infection) can also be used to account for baseline background signal and can more clearly show the changes in the antibody repertoire brought upon by a specific infection or exposure event [32].
4. Data Analysis Overview
There is no unified pipeline or script for the analysis of PhIP-Seq data. However, several research groups are trying to establish computational pipelines and make it available online for general use (https://github.com/lasersonlab/phip-stat, accessed on 20 April 2022), (phippery, https://github.com/matsengrp/phippery and phip-flow, https://github.com/matsengrp/phip-flow, both accessed on 20 April 2022).
Figure 2 illustrates a typical pipeline of data analysis; here we demonstrate an example used by the pipeline, phip-stat (https://github.com/lasersonlab/phip-stat, accessed on 8 May 2022). High throughput sequencing data is demultiplexed to identify PhIP-Seq data specific to each sample and aligned to reference sequences generated from the original sequence files to deconvolute the peptide IDs. The number of reads for each specific peptide tile is then counted for each sample, which is followed by normalization with the read (either to a set number of reads per sample or using a mathematical model). Typically, normalized read counts will be reported and this can then be used for downstream analysis. Following normalization, some studies will apply additional statistical testing based on poison distribution (and use a p-value-based metric (−log10(p)) [20,25,33], or utilize a z-score metric to describe enrichment of peptide tiles [31,32,34]). The resulting metrics may then be used to analyze and visualize the phage immunoprecipitation results.
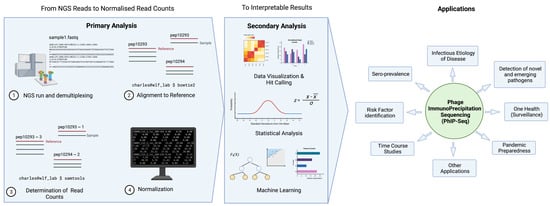
Figure 2. General data analysis pipeline and applications of PhIP-Seq. Created with BioRender.com.
There are two key steps involved in converting NGS reads to interpretable results. Primary analysis entails alignment of reads to reference sequences, assessment of read counts, and data normalization. Depending on the scientific question and application, data will undergo secondary analysis in the form of data visualization, statistical analysis, and machine learning, etc.
5. Determining the Hits
Calculating a z-score metric or a p-value metric may not be sufficiently informative as investigators are typically more interested in the actual significance of the result—i.e., if it indicates a prior exposure or otherwise.
A key problem with the use of high throughput serology is not having a “gold standard comparator”—many of the target proteins typically will not have commercial serological tests available. Without a standard comparator to allow us to “train” the platform, it will be challenging to determine which z-score, or p-value would correspond a “true hit” or a prior exposure. Thus, researchers frequently use statistical measures and controls to determine which peptides or viruses are considered positive for a PhIP-Seq run. Cut-offs are sometimes defined, for example, based on a reproducibility threshold based on the −log10(p-value) of technical duplicates, and an epitope is considered to be positive when this threshold is crossed [33]. Confidence to the scoring algorithm and cut-offs is typically bolstered with the measures of antibody response to common human infections (e.g., rhinovirus, or Epstein-Barr virus infections), cross-comparison against conventional serological assays, or provided for by an infection history (for example, clinically diagnosed infected patients). Statistical tests such as t-tests [24] and the Mann–Whitney test [21,25,33,35], amongst others, are also frequently used to compare data generated from PhIP-Seq.
6. Other Analysis Strategies (Machine Learning, AVARDA, Novel Pipelines)
More advanced statistical tools are sometimes used to analyze and interpret results from PhIP-Seq. In some studies, authors use gradient boosting algorithm xgboost [36] to determine important peptide tiles (or features) that distinguish one group of patients from another [19,22,33]. This specially works well for case-control studies with large well-defined study populations.
Another involves the use of epitope similarity across different peptide tiles. Monaco et al. attempted to improve the VirScan platform by accounting for possible cross-reactivity among peptide tiles by sequence alignment. This technique, named Antiviral Antibody Response Deconvolution Algorithm (AVARDA), is based on the premise that antibodies can cross-react with similar peptide tiles assigned to different viruses. Antibody cross-reactivity between viruses has not been accounted for in prior PhIP-Seq analysis strategies, and this valuable information is usually lost during analysis [37].
7. Programming Language and Skills Needed
Primary and secondary data analysis require basic knowledge of command line interface and access to a decent computing infrastructure [23]. Most data analysis can be conducted with Python or R scripts. Having a working knowledge on these programming languages, or having access to individuals who are experienced in data science or bioinformatics, will be of great utility to investigators utilizing PhIP-Seq as a serological tool.
This entry is adapted from the peer-reviewed paper 10.3390/pathogens11050568
This entry is offline, you can click here to edit this entry!