Your browser does not fully support modern features. Please upgrade for a smoother experience.
Please note this is an old version of this entry, which may differ significantly from the current revision.
Transportation is a spatial activity. The geographic Information System (GIS) is the process of capturing, managing, analyzing, and presenting spatial data. GIS techniques are essential to the study of various aspects of transportation. In this entry, the state of knowledge regarding atomized transportation modes is presented. Atomized transportation modes are defined as transportation modes which deal with low passenger numbers.
- GIS
- spatial analysis
- active transportation
- micromobility
- cars
1. Introduction
The spatial aspect of transportation is crucial, as mobility is governed by space. Transportation modes encompass a spectrum that ranges from atomization—transportation modes that deal with the smallest load unit (e.g., single or a few passengers)—to massification—transportation modes that deal with the largest load unit (e.g., carry large number of passengers) [1].
Recently, the ubiquity of GPS-enabled devices (e.g, GPS tracking systems, smart phones, and wearables) have advanced and diversified their applications by allowing high-resolution data to be acquired. This has introduced the Big Data era, where datasets are created in higher velocity, volume, and variety (3 Vs) [2]. Spatial data is no exception. The process of capturing, managing, analyzing, and presenting spatial data, known as a Geographic Information System (GIS), offers a powerful tool for the advancement of the transportation field.
This entry aims to introduce the established knowledge about essential concepts related to GIS (Section 2) and atomized transportation modes, namely active transportation in Section 3, micromobility in Section 4, and cars in Section 5. Finally, this work ends with concluding remarks in Section 6
2. GIS
Spatial data existed long before the proliferation of computers. For example, the notorious case of Dr John Snow, where he visually depicted the outbreak of cholera in London in 1859 and identified the source (water pump) of the outbreak, thus refuting the miasma theory by mapping the deaths [3]. His approach involved correlating death intensity with the proximity of the water pump. As presented in Figure 1, most cholera deaths clustered in proximity to the water pump. Another finding is that the brewery has no deaths, as it had its own water supply, and its workers were allowed to consume the beers.
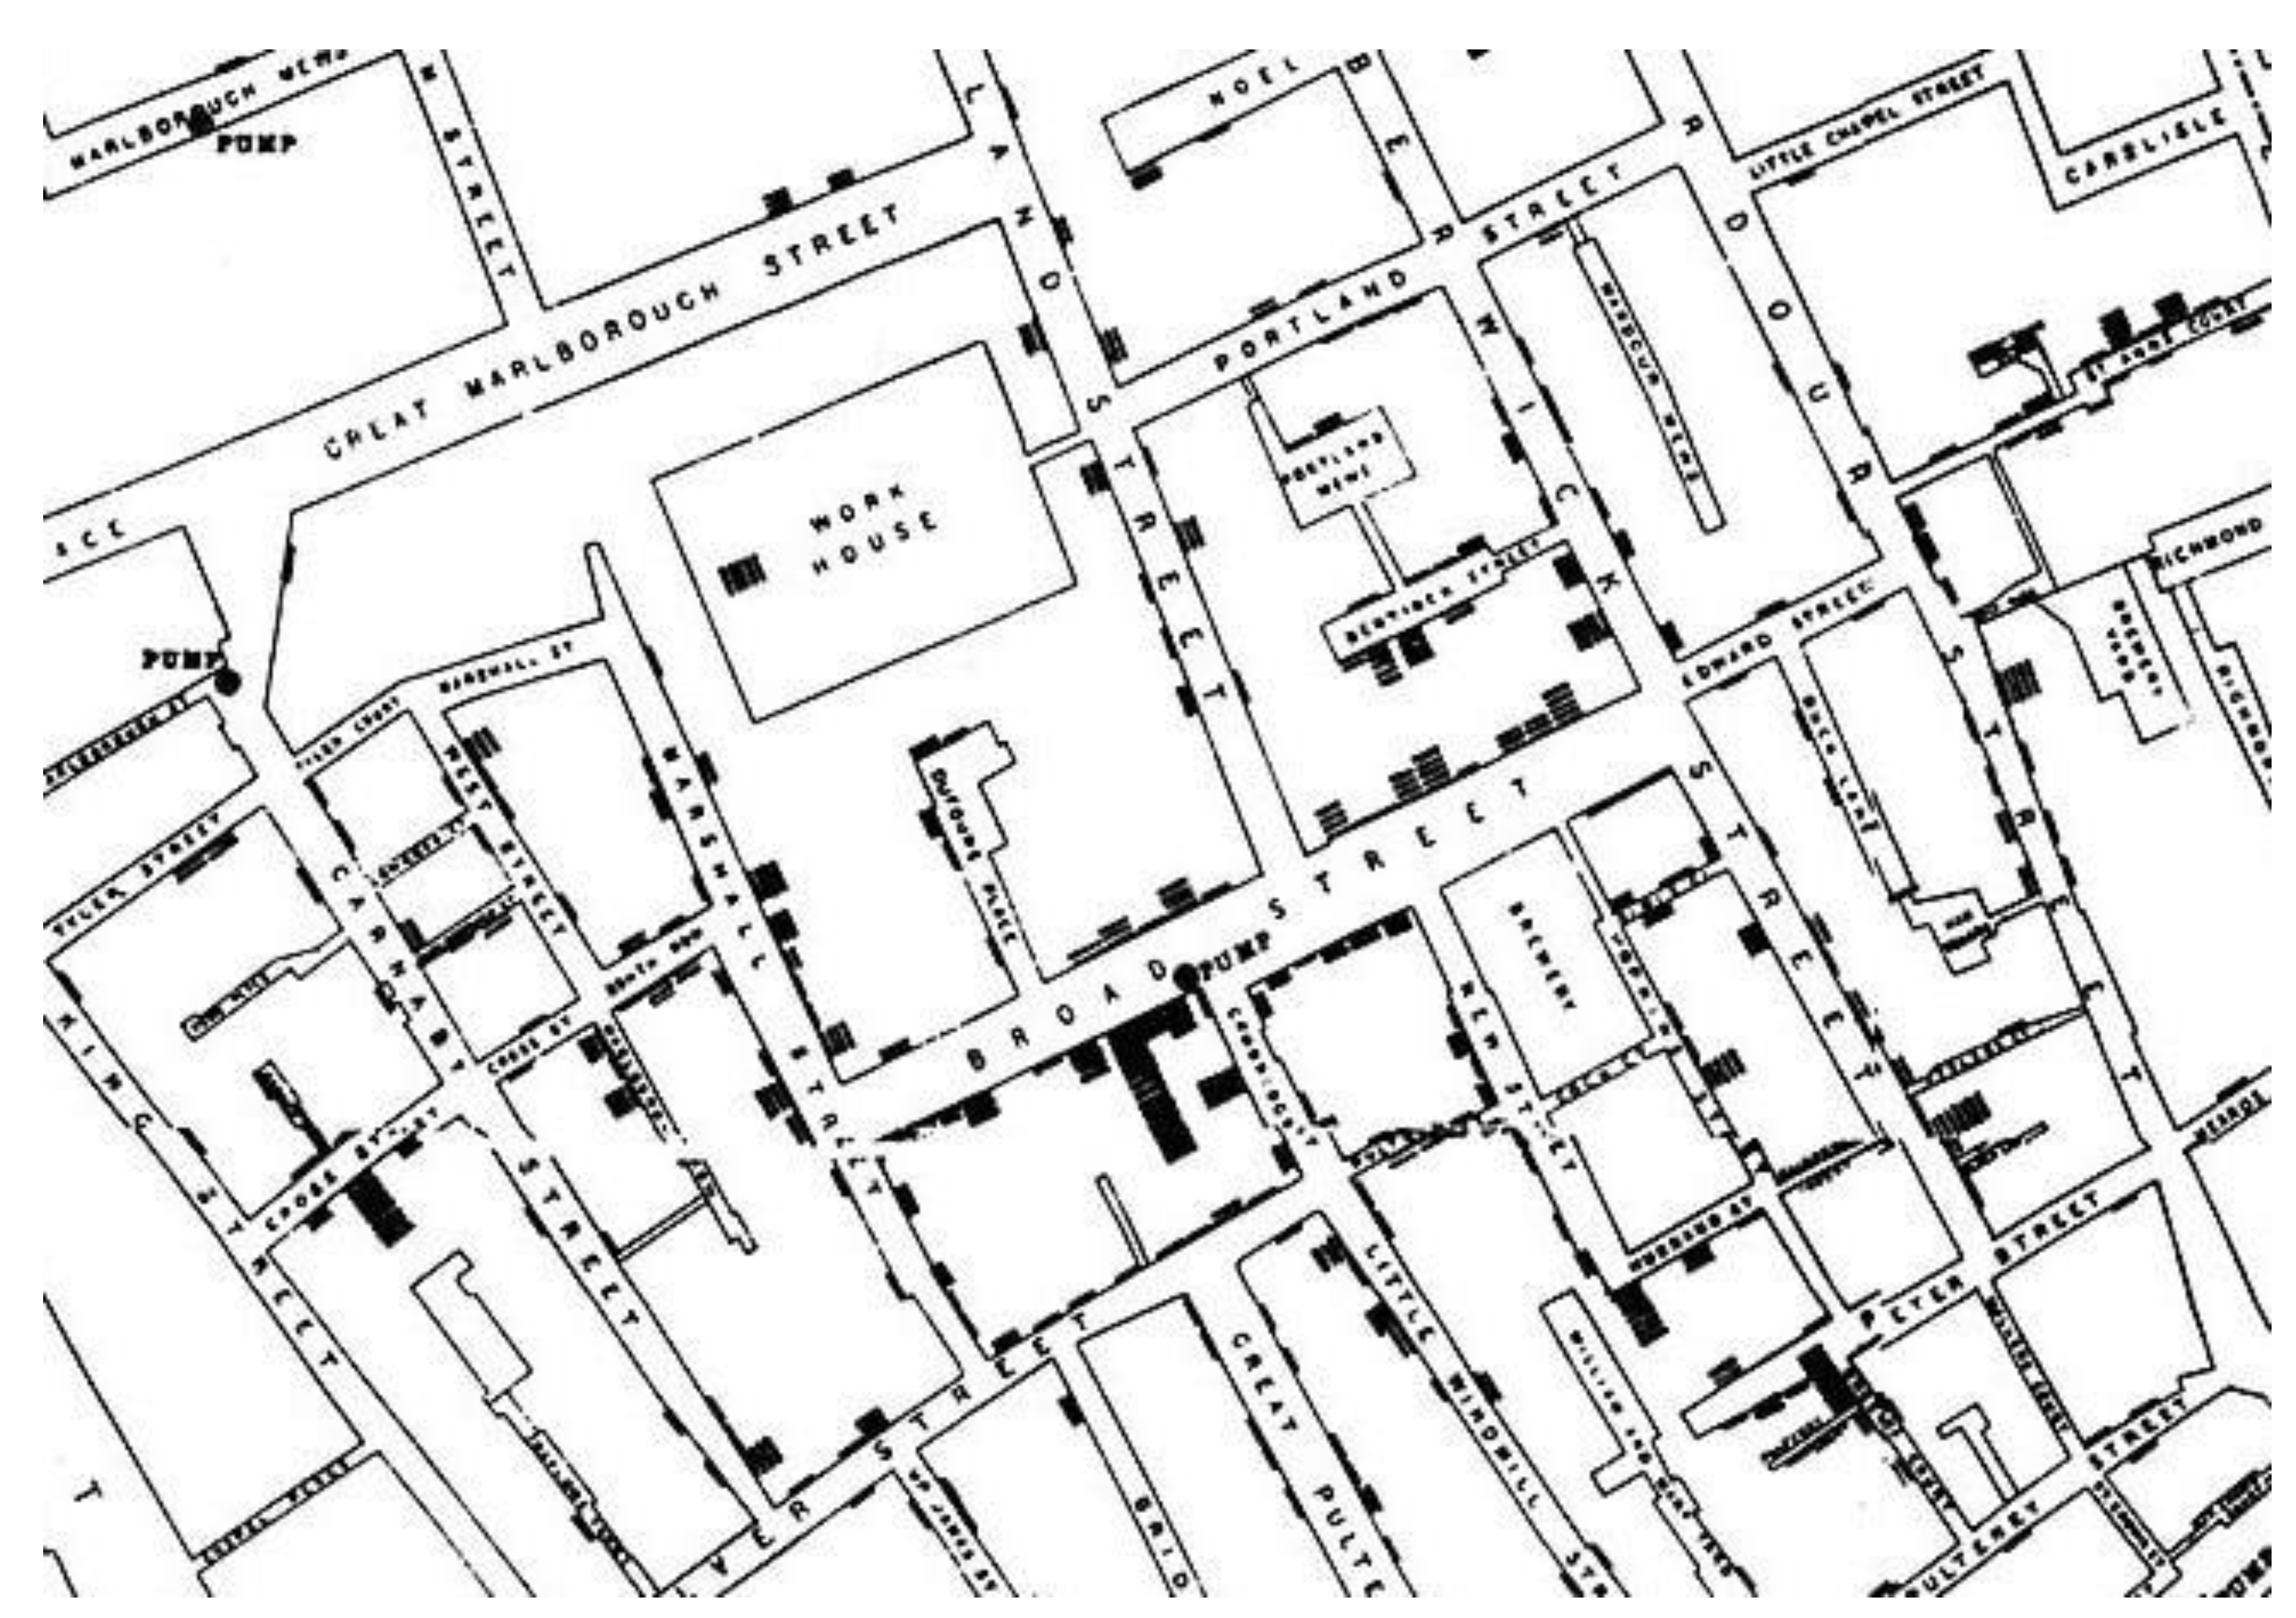
Figure 1. John Snow’s map of the cholera outbreak [4]. Black bars represent deaths. Black dot represents water pump.
Currently, using GIS environment software—both proprietary (e.g., ArcMap (https://www.esri.com/en-us/arcgis/products/arcgis-desktop/resources, accessed on 22 March 2022)) and open-sourced (e.g., QGIS) (https://www.qgis.org/en/site/, accessed on 22 March 2022), the users can include different layers of spatial datasets, which can be in either raster or vector format. Raster data are represented by cells; a common form of raster data includes digital elevation models, where each cell has a value that represents the terrain of the area. Vector data can take the shape one of the three geometries: (a) points (e.g., intersection, or accident location), (b) lines (e.g., streets), and (c) polygons (e.g., area). A GIS project can include one or many types of data. GIS has a presence in many disciplines, such as epidemiology, to establish an understanding between pathogenic factors and the environment [5], and criminology, to delineate criminal behavior spatial patterns [6], among other disciplines. Through GIS, researchers can carry out various analyses, and some of the common analyses related to transportation are as follows:
-
Heatmap: heatmaps map the concentration of a spatial phenomenon. For instance, a heatmap of car accidents [7];
-
Proximity analysis: this analysis determines the impact of a spatial feature. For instance, assessing the impact of green spaces on promoting cycling [8];
-
Spatial regression: this regression method refers to any regression technique that accounts for spatial dependency in the data. For instance, modeling cycling ridership at an intersection level by correcting for cycling ridership at a neighboring intersection [9];
-
Suitability analysis: this analysis assigns a numeric value for factors relative to their importance in order to find the optimal location for certain spatial features. For instance, finding optimal school locations to promote student walking and cycling [10];
-
Agent-based model: a type of model that evaluates the effect of certain environments on agents by simulating their actions. For instance, comparing between driving, cycling, and walking distance for simulated journeys in certain cities. Therefore, the agents are corresponding to the simulated trips, whereas the cities are the environments constrained by the street networks [11];
-
Spatial autocorrelation analysis: this analysis statistically assesses the spatial patterns of a certain variable. The returned value of this analysis ranges from 1 (postive spatial autocorrealtion) to −1 (negative spatial autocorrelation), where the value of 0 represents spatial randomness. As shown in Figure 2, spatial autocorrelation occurs when a given feature is neighbouring features with similar value; for example, a feature with high (or low) values are situted near other features with high (or low) values. As opposed to negative spatial autocorrealation, a given feature is neighbouring features with dissimilar values. For example, there is a tendency for cyclists to cycle in (or close by) areas where cycling is common due to many reasons, among which is the ‘safety-in-numbers’ theory. This theory states that, when the number of cyclists increases, drivers will pay more attention, and thus provide a safer environment [12];
-
Map matching: in order to reveal the path of vehicles/travelers, map matching techniques (e.g., Douglas and Peucker algorithms) are used to match the collected GPS points from vehicles/travelers to the corresponding street segments. For example, this technique is presented in Google Maps Platform (https://developers.google.com/maps/documentation/roads/snap, accessed on 22 March 2022) and is constantly being used in tracking apps;
-
Participatory mapping: involving the general public in spatial data collection through online platforms is known as participatory mapping. For example, the public can report bike safety issues using BikeMaps.org (http://BikeMaps.org, accessed on 22 March 2022) and walking or rolling safety issues using WalkRollMap.org (https://walkrollmap.org, accessed on 22 March 2022).
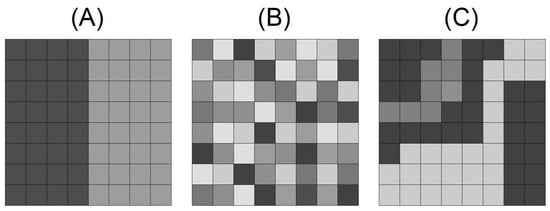
Figure 2. Representation of spatial patterns: (A) represents positive spatial autocorrelation; (B) represents spatial randomness; (C) represents negative spatial autocorrelation (Source [13]).
Trip data is the backbone of most GIS projects. Coupling trip data with other attributes such as trip duration, trip time, and demographic data allows for a better understanding of trends. The granularity of the data can take the form of the following data:
-
GPS trajectories: consecutive GPS points retrieved at a predefined time interval from the users, revealing their location. Map matching techniques are then preformed to convert these points to nearest streets. Certain smartphones apps (elaborated in Section 3) provide such data. This data are useful to estimate ridership at a street level, which is considered the finest available data;
-
Origin–destination: data of the start (origin) and the end (destination) of each journey are used. The data can be represented as points (e.g., representing a bike- sharing system station or kiosk) or aggregated to represent a city zone;
-
Self-reported journeys: research can solicit a journey’s data using participatory mapping by recruiting participants. Yet, the accuracy of the obtained data depends to a large extent on the participants’ skills of mapping [14].
For privacy reasons, origin–destination data is the most popular open-data. Exposing sensitive information, such as military outposts and private data, is more likely to occur using GPS trajectories. It has been reported that trip GPS trajectories accidently disclosed sensitive locations such as military outposts and the users’ houses [15]. To safeguard users’ privacy, GPS trajectories are usually bucketed at a street level, and are not available at an individual journey level, meaning one cannot trace a single journey, where it started and ended, and what streets have been taken.
3. Active Transportation
Active transportation (also known as active travel)—human-powered transportation—is known to offer numerous benefits. It has been reported that this travel mode reduces air pollution, improves cardiovascular health, and enhances social cohesion [16]. Active transportation is witnessing growing academic scrutiny, which is further supported by the popularity of social fitness networks as a mechanism for data collection. Social fitness networks are online communities that trace users’ indoor and outdoor physical activities’ (walking, cycling, kayaking, and skiing) GPS locations, allowing them to track, share, and analyze their activities [17]. Strava is the most populous social fitness network, as it has more than 80 million users. Similar to conventional social media networks, where posts are “liked”, in social fitness networks, shared activities can receive “kudos” [18]. Afterwards, augmented data are provided for further analysis. An illustration of active transportation activities in New York City is provided in Figure 3. These networks motivate users to be active through the integration of gamified experience, where users are challenged and rewarded points for their activities [19]. There is a caveat with this approach, however: some users jeopardize their safety to earn more points by cycling recklessly [18].
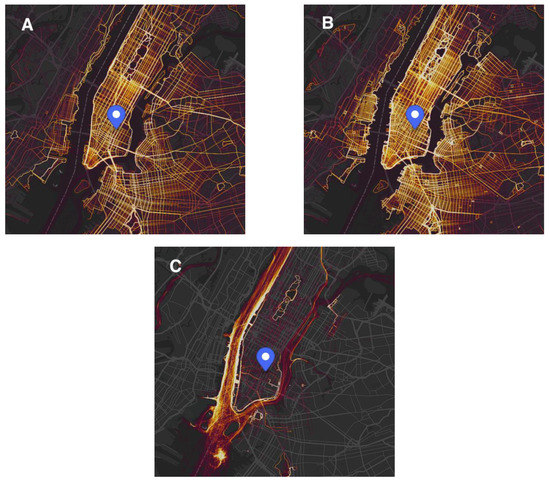
Figure 3. Strava activities in New York city: (A) cycling activities; (B) walking and running activities; (C) water activities (Source: Strava Heat Map (https://www.strava.com/heatmap/, accessed on 22 March 2022)).
Using data obtained from social fitness networks, researchers are able to study various aspects of active transportation modes. Until now, the most predominant mode is cycling (e.g., to model cyclists’ route choices [9], cycling exposure to automobiles [20], and cyclists’ air pollution exposure [21]). Little attention has been paid to other modes such as walking (e.g., to investigate the change in people’s urban greenspace usage after the COVID-19 outbreak [22]) and skiing (e.g., to assess the conflict between recreational activities and wildlife [23]). However, social fitness network data are subject to bias towards young, fitness-oriented, and tech-savvy users [14]. Datasets from social fitness network are prone to erroneous data entry, where a user mistakenly logs a vehicle trip as an active transportation trip [24]. More recently, cycling has played a major role in food justice during COVID-19. Food justice refers to ensuring access to healthy, nutritious, and affordable food [25].
Nonetheless, some agencies opt to develop their own app to collect data, such as the CycleTracks app, developed at the San Francisco County Transportation Authority (SFCTA) [26], and the Cycle Atlanta app, developed by Georgia Institute of 109 Technology and the City of Atlanta’s planning office [27]. Additionally, SafeLanes.org (https://safelanes.org, accessed on 22 March 2022) and BikeLaneUpRising (https://www.bikelaneuprising.com, accessed on 22 March 2022) are being used to report improper parking that impedes active transportation access [28]. Aerial and satellite imageries are also being applied to retrieve data from stationary objects related to active transportation and where the temporal aspect is less relevant. For example, Moran [28] used Google Earth to manually inspect intersections in San Francisco for the type of marked crosswalks.
Bike-sharing systems, in which bicycles are distributed across a certain area—either in station or floating—to provide individuals with on-demand bikes, are also a source of spatial data on active travel. Since vehicles from bike-sharing systems are prone to vandalism and theft, in several locations, many service operators have ceased operations. Statistically, bike-sharing is safer than conventional bikes as a consequences of the bike-sharing vehicles’ design, including the noticeable weight and the presence of reflectors and lights [29]. Data from service providers such as Los Angeles’s Metro Bike (https://bikeshare.metro.net/about/data/, accessed on 23 March 2022), Chicago’s Divvy (https://ride.divvybikes.com/system-data, accessed on 23 March 2022), Philadelphia’s Indego (https://www.rideindego.com/about/data/, accessed on 23 March 2022), and many other locations are made available for researchers to explore bike-sharing patterns. Open-data policies have further accelerated burgeoning research in this area. Scholars have addressed many issues such as the impact of the COVID-19 pandemic [30], effects of the weather on bike-sharing ridership [31][32], analyzing the spatial demand of bike-sharing [33], forecasting bike-sharing demand [34][35], and the impact of subway closure on bike-sharing [36][37]. Yet, these data are generally available at an origin–destination level, rather than the GPS trajectory for each journey. Some bike-sharing systems, such as Los Angeles’s Metro Bike and New York City’s Citi Bike, leverage participatory mapping to ask stakeholders to suggest new locations to expand their systems.
4. Micromobility
Micromobility—partially or fully electrified, low-speed, lightweight vehicles (e.g., electric scooters (e-scooters), e-bikes, e-mopeds)—has been recognized as being less physically taxing (compared to conventional cycles), allowing for longer distance to be covered [38] and hilly terrain to be traversed with less effort. Micromobility is ideal for commute trips, as these modes prevent the user from the need of shower facilities and of being physically taxed [39]. Most importantly, micromobility can accommodate a large portion of local journeys commonly undertaken by cars, and can thereby ameliorate internal combustion engine vehicles’ corresponding externalities [40]. However, micromobility is sometimes condemned for discouraging physical activity [41][42], though this mode of transportation might suit less physically competent users.
Currently, many service operators, such as Lime (https://www.li.me/en-us/home, accessed on 23 March 2022) and Spin (https://www.spin.app/, accessed on 23 March 2022), provide on-demand micromobility vehicles using apps, through which users can locate and rent micromobility vehicles. Using built-in GPS tracking devices, spatial data about the trips are collected; Figure 4 shows a logged trip using a Spin e-scooter in San Francisco, CA. For many cities, micromobility GPS trajectories are available through the Uber movement (https://movement.uber.com/, accessed on 23 March 2022), a platform developed by the ridesharing service Uber inc. For privacy purposes, the data is binned into hexagonal polygons. Similarly, Austin’s (Texas) open-data portal (https://data.austintexas.gov/, accessed on 23 March 2022) and the City of Norfolk (Virginia) (https://data.norfolk.gov/, accessed on 23 March 2022) are offering micromobility data at a census tract polygon level.
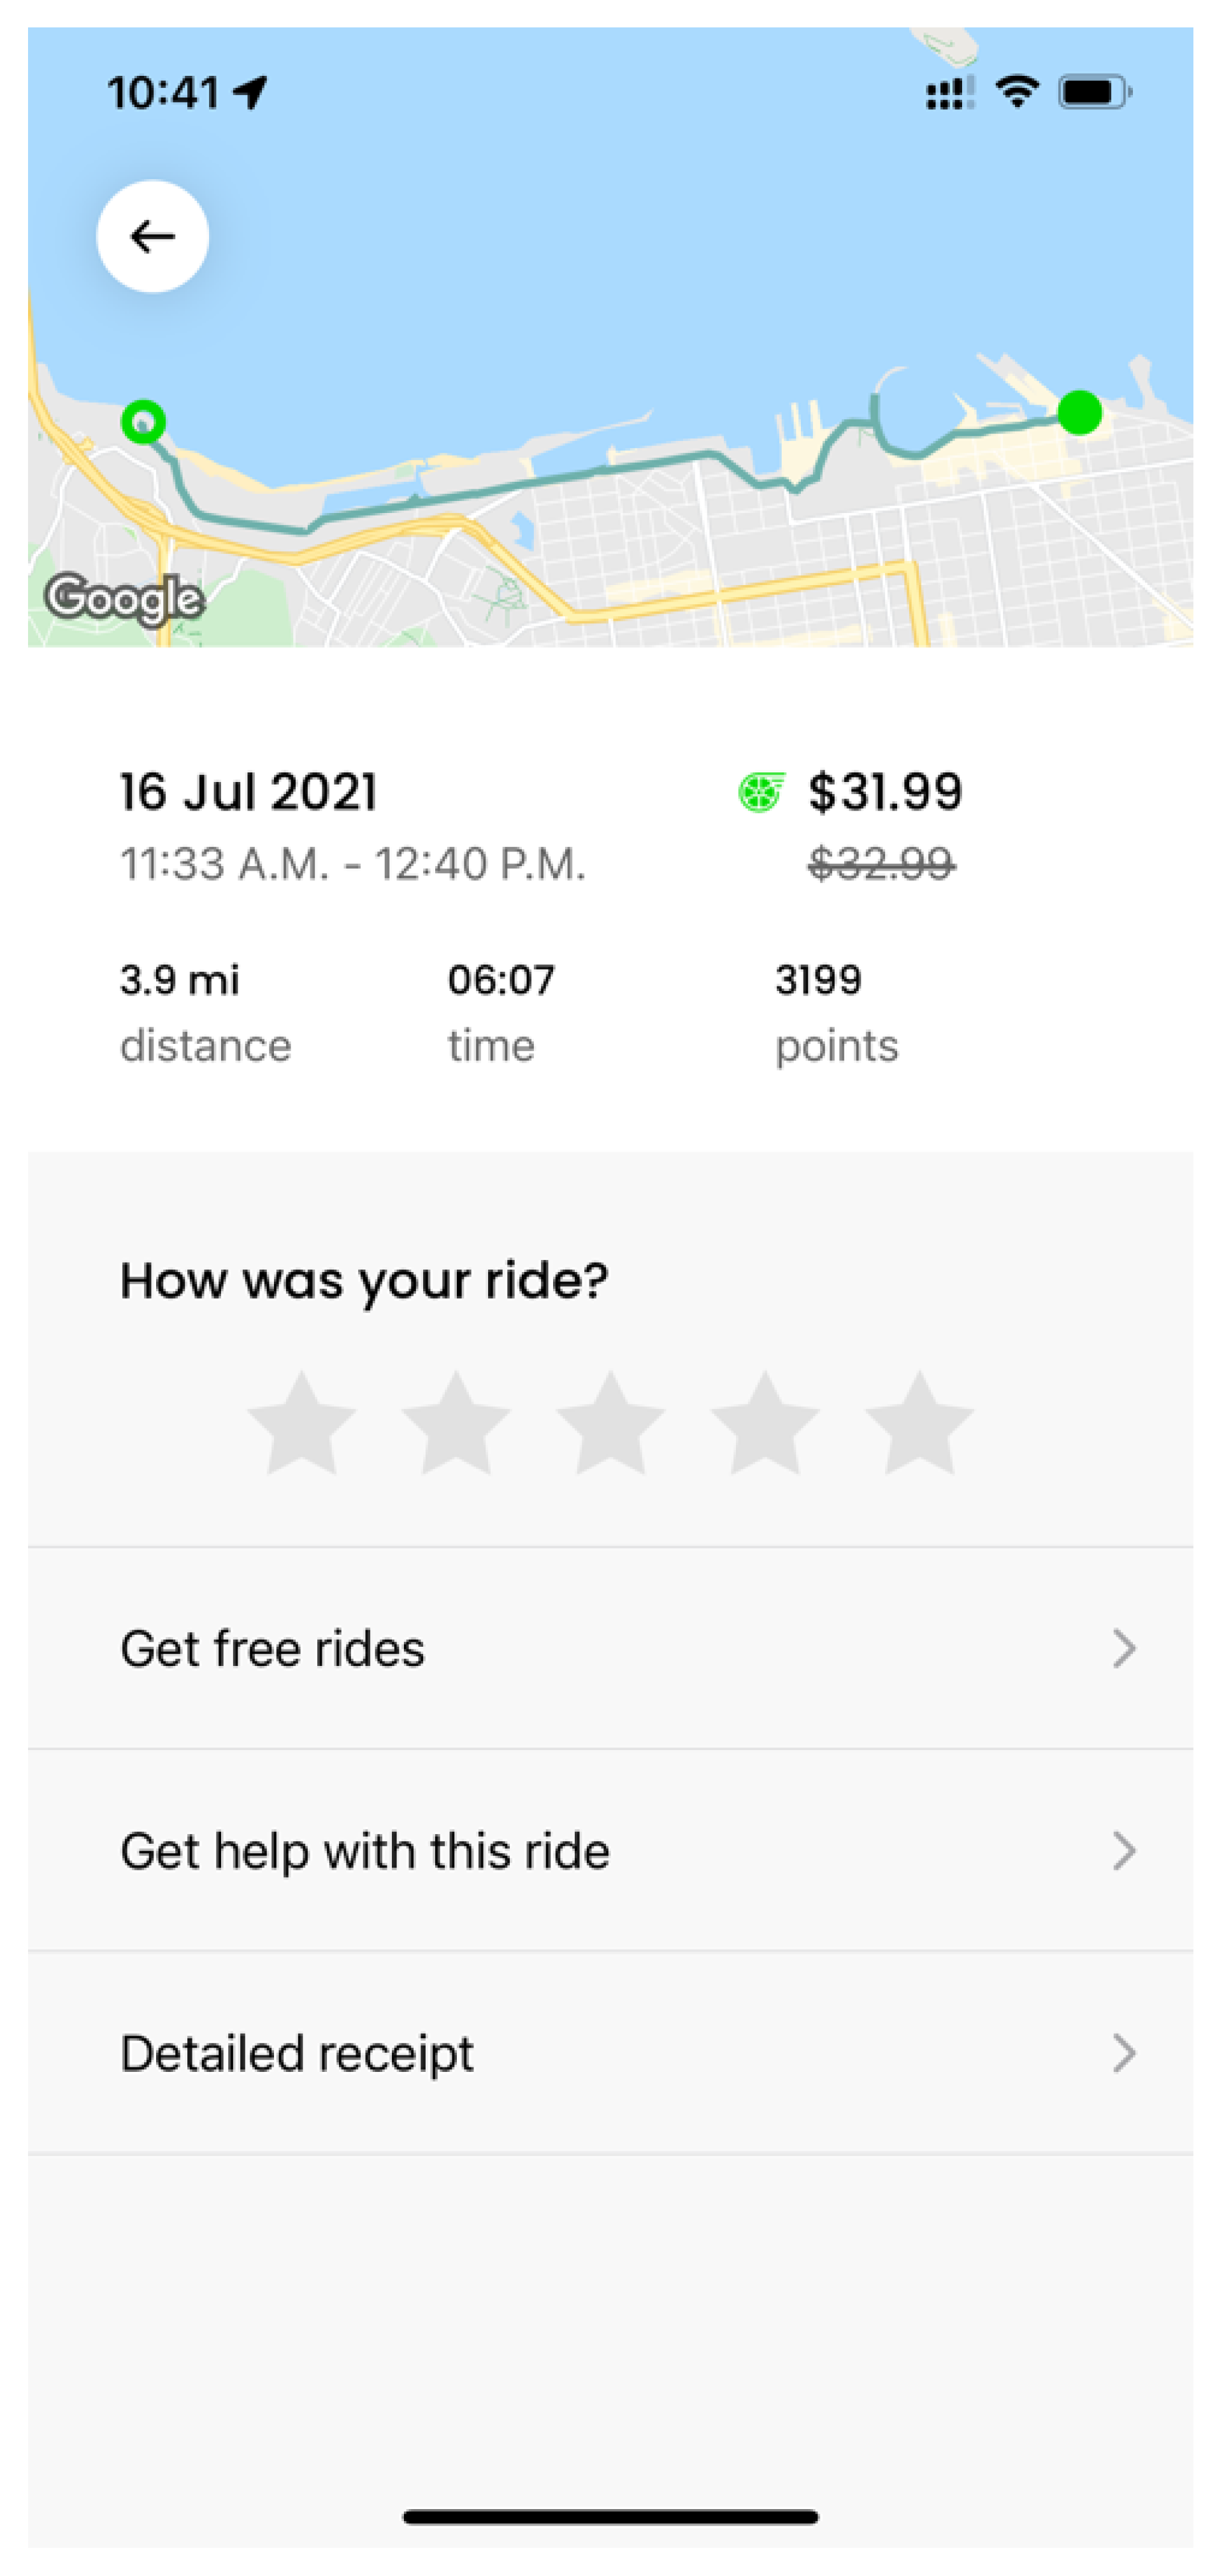
Figure 4. Spin’s app screenshot (Source: Author’s trip).
Many micromobility issues have been addressed using GIS, such as micromobility equity [43], potentiality for micromobility to replace cars [44], spatiotemporal characteristics [45], the role of micromobility in first/last mile problem [46], whether micromobility complements or competes with public transit [47], and changes in micromobility usage before and after COVID-19 lockdowns [48]. Improper micromobility parking causing blocked access is one of the most common concerns of micromobility and has been addressed by many authors [49][50]. Additionally, the safety of micromobility has been compared to conventional cycling [42][51].
5. Cars
Many apps and platforms have been developed to collect spatial data related to cars. However, unlike active transportation and micromobility, cars’ spatial data are usually not GPS trajectories. Many apps have been developed to improve cars’ infrastructure. Street Bump is an app to collect streets’ bumps to help cities to prioritized their interventions [52]. In a similar fashion, Gap Trap is a prototype for an app to detect streets’ potholes [53]. Using the Waze app, the public can report real-time events such as floods, accidents, traffic jams, and roadworks [54]. Imagery is also a good source for spatial data, as it has been used to analyze cars’ parking angles [55] and to analyze unofficial parking [56]. Nonetheless, GPS traces from mobile service providers, known as mobile phone positioning, are often used as a proxy for vehicular journey trajectories [57][58].
In some cities, the hourly average speed in each street segment (presented in Figure 5) and the travel time between given city zones (presented in Figure 6) are provided by the ridesharing service Uber Inc in the Uber Movement (https://movement.uber.com/, accessed on 24 March 2022) platform. New York City Taxi and Limousine Commission (TLC) is openly providing the trip records of ridesharing services (e.g., Uber, Lyft, Via and Juno) as well as taxis. An increasing number of works has been published using these free datasets. In terms of Uber Movement data, in [59], Sun, Ren, and Sun used this data as a commuting time proxy; whereas, in [60], Ch, Krumm, and Kun analyzed traffic patterns to detect speed anomalies. Data from TLC have been used to investigate the impact of Uber on the taxi markets [61][62], the impact of the weather on taxi and ridesharing services [63], and the impact of ridesharing services on public transportation [64]. Ridesharing services have also been studied elsewhere, where the data were not openly available. For example, in [65], a drop in alcohol-related accidents were attributed to the usage of ridesharing services in Chile. An in-depth analysis of ridesharing in Chicago has been studied in [66], which covers traveling time, traveling origin and destination, trip length, and travel differences in travelling patterns between weekend and weekdays.
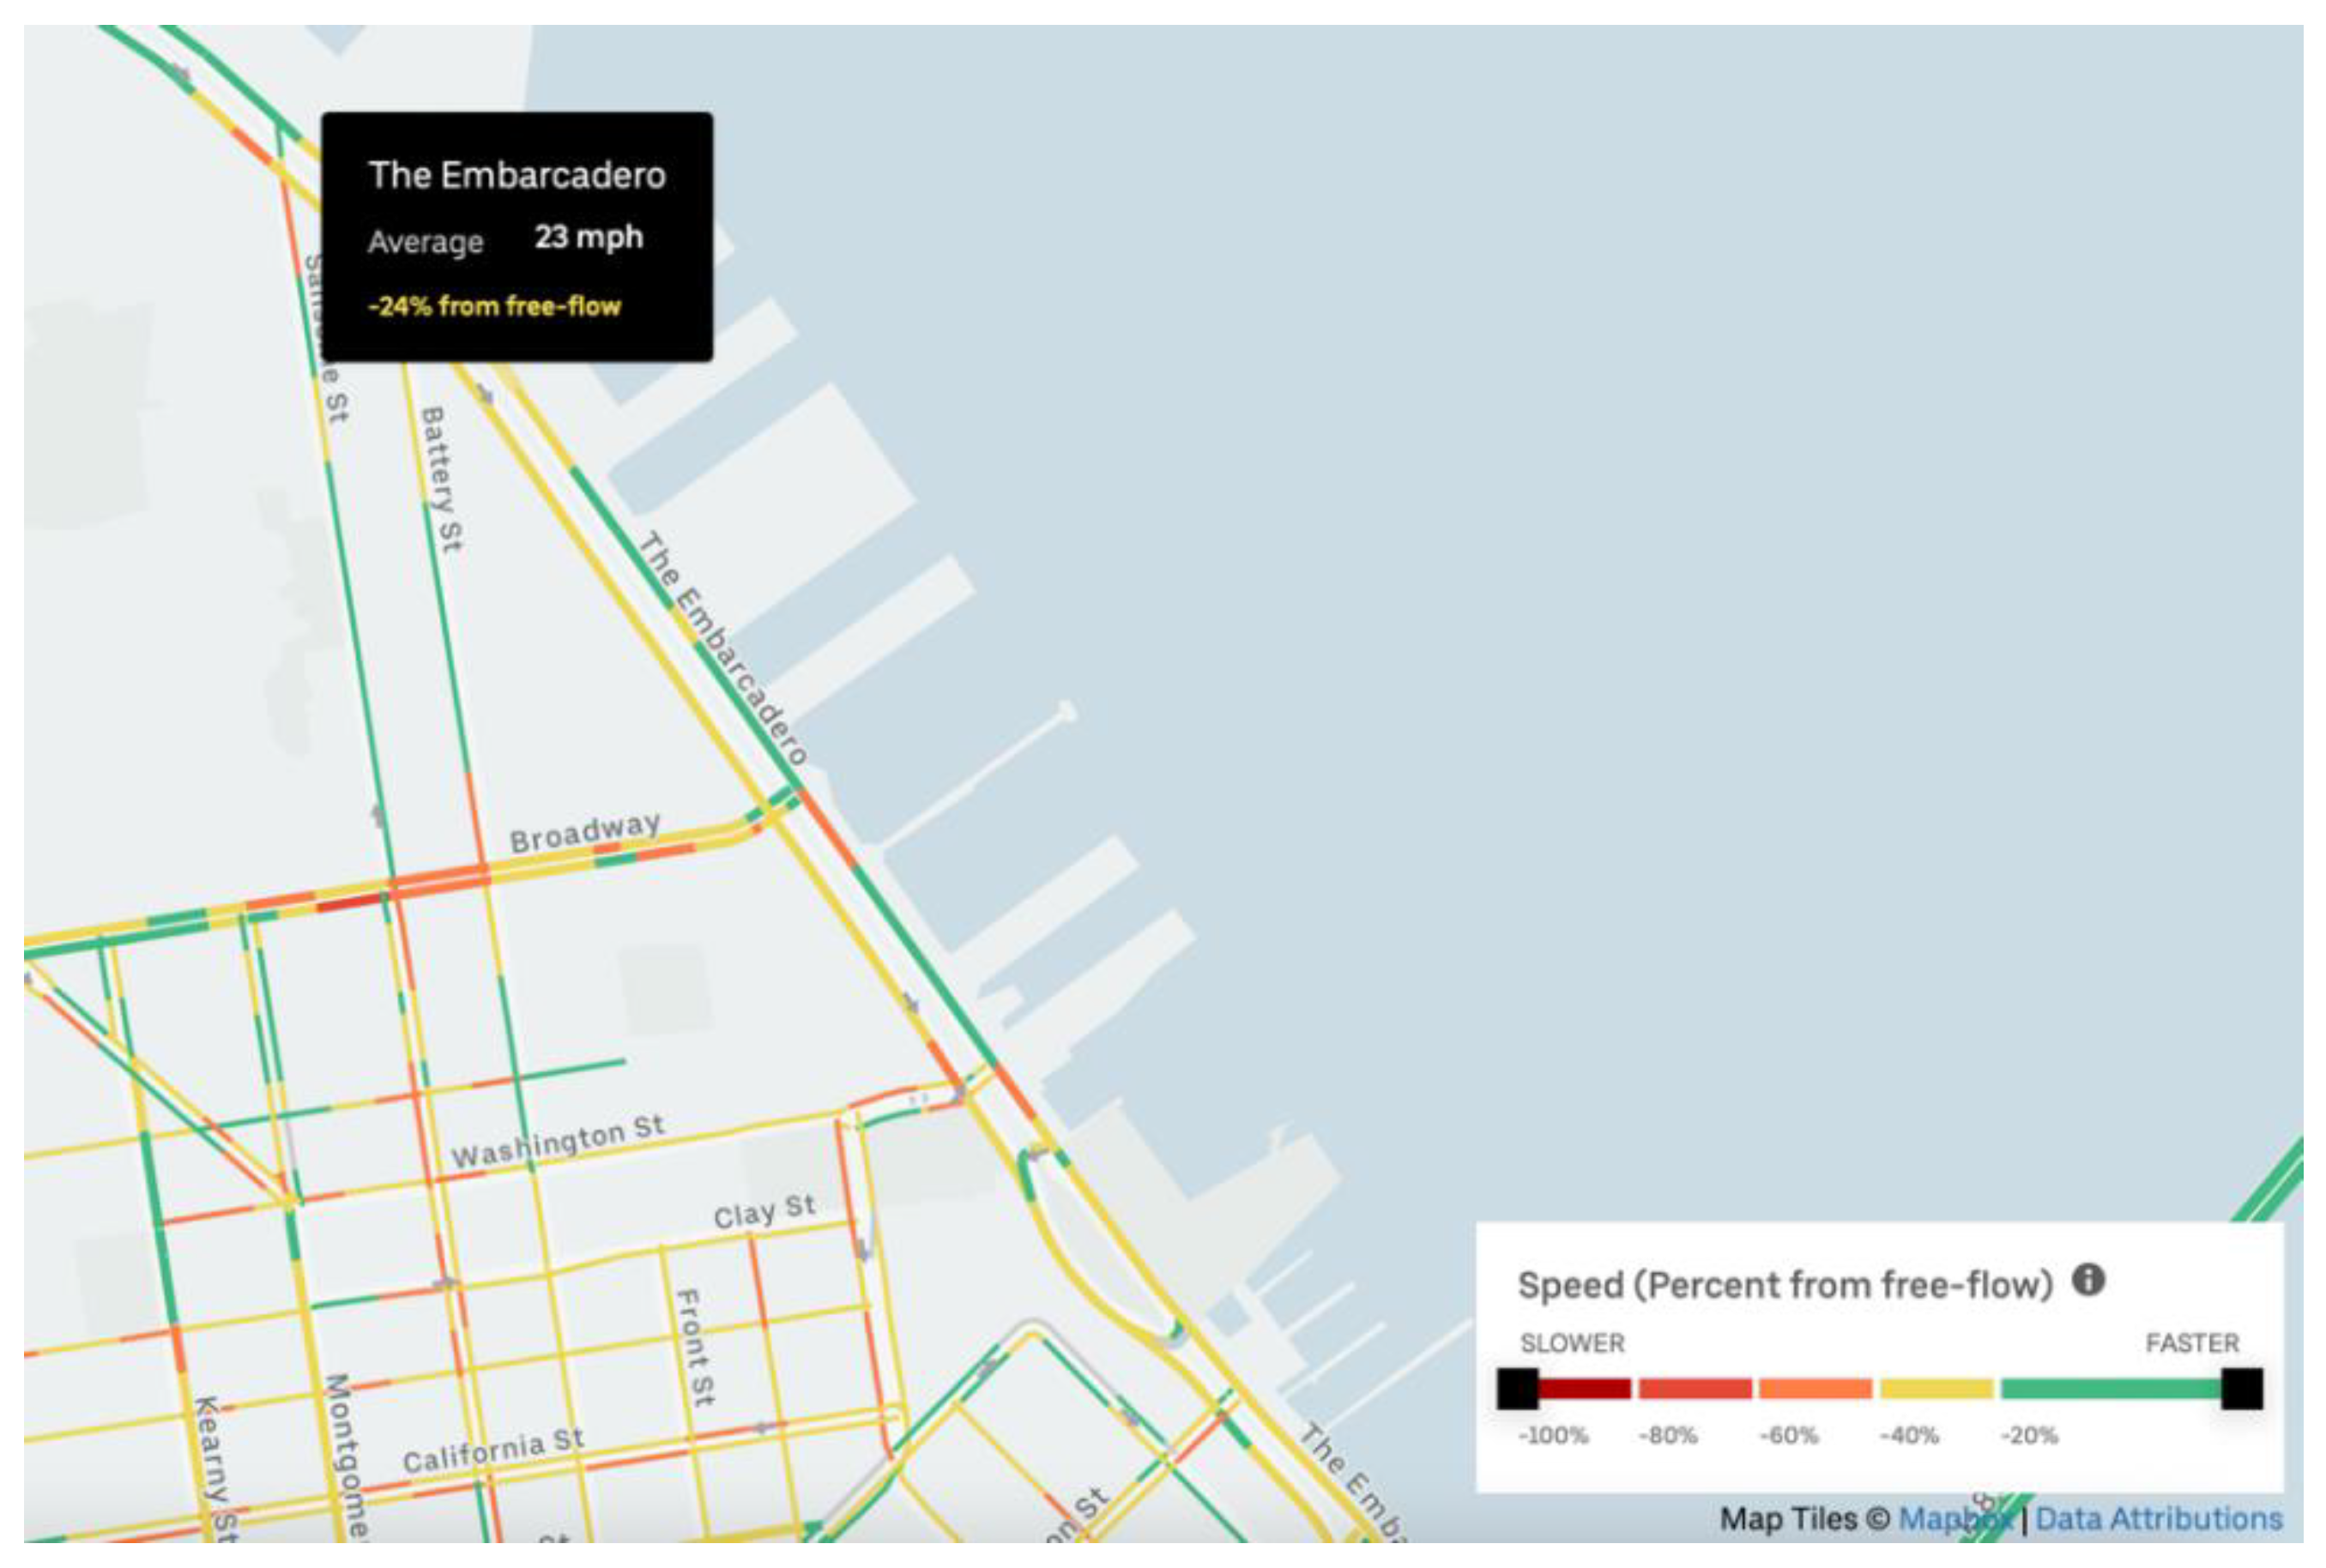
Figure 5. Uber Movement street speed illustration in San Francisco (Source: Uber Movement).
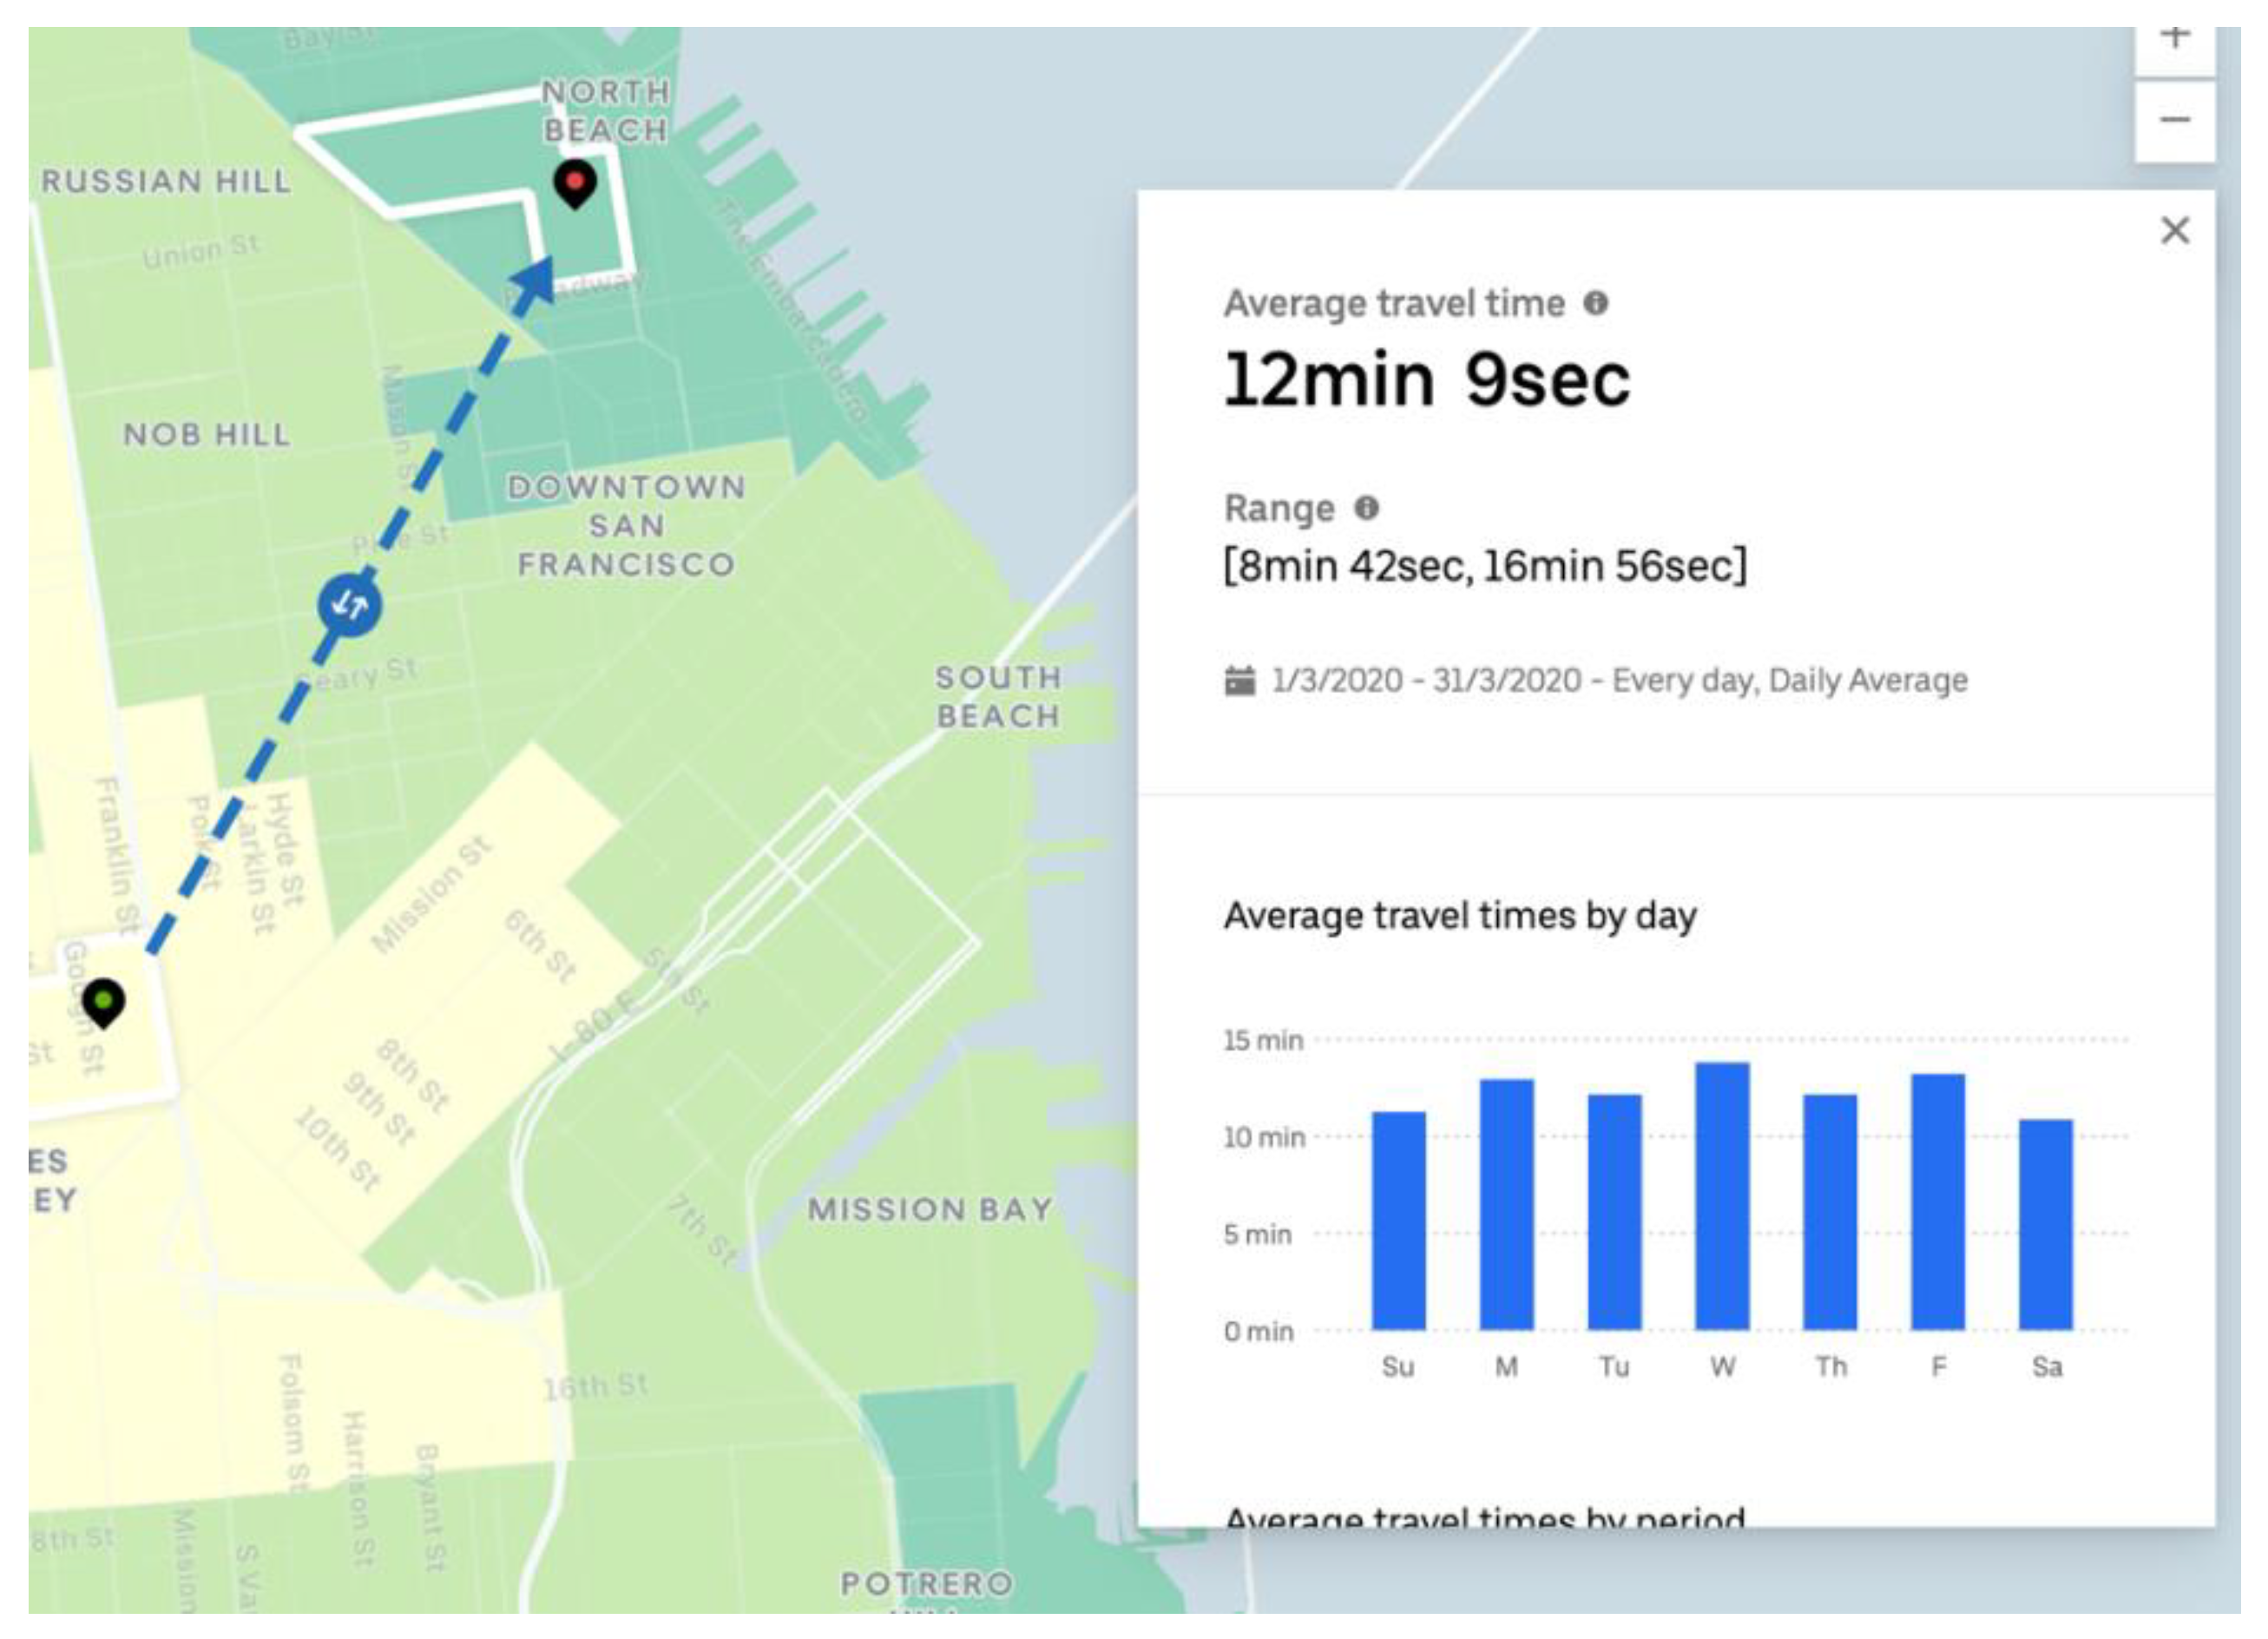
Figure 6. Uber Movement zone-to-zone average travel time illustration in San Francisco (Source: Uber Movement).
As GIS is commonly used in Uber, and the company developed a web-based, open-sourced geospatial toolbox called kepler.gl (https://kepler.gl, accessed on 24 March 2022). Kepler.gl can handle visualizing Big Data, as shown in Figure 7. The platform has been used in many applications, such as origin–destination using mobile data for an entire city [67], global population movement during the COVID-19 pandemic [68], and even visualizing micromobility data [69].
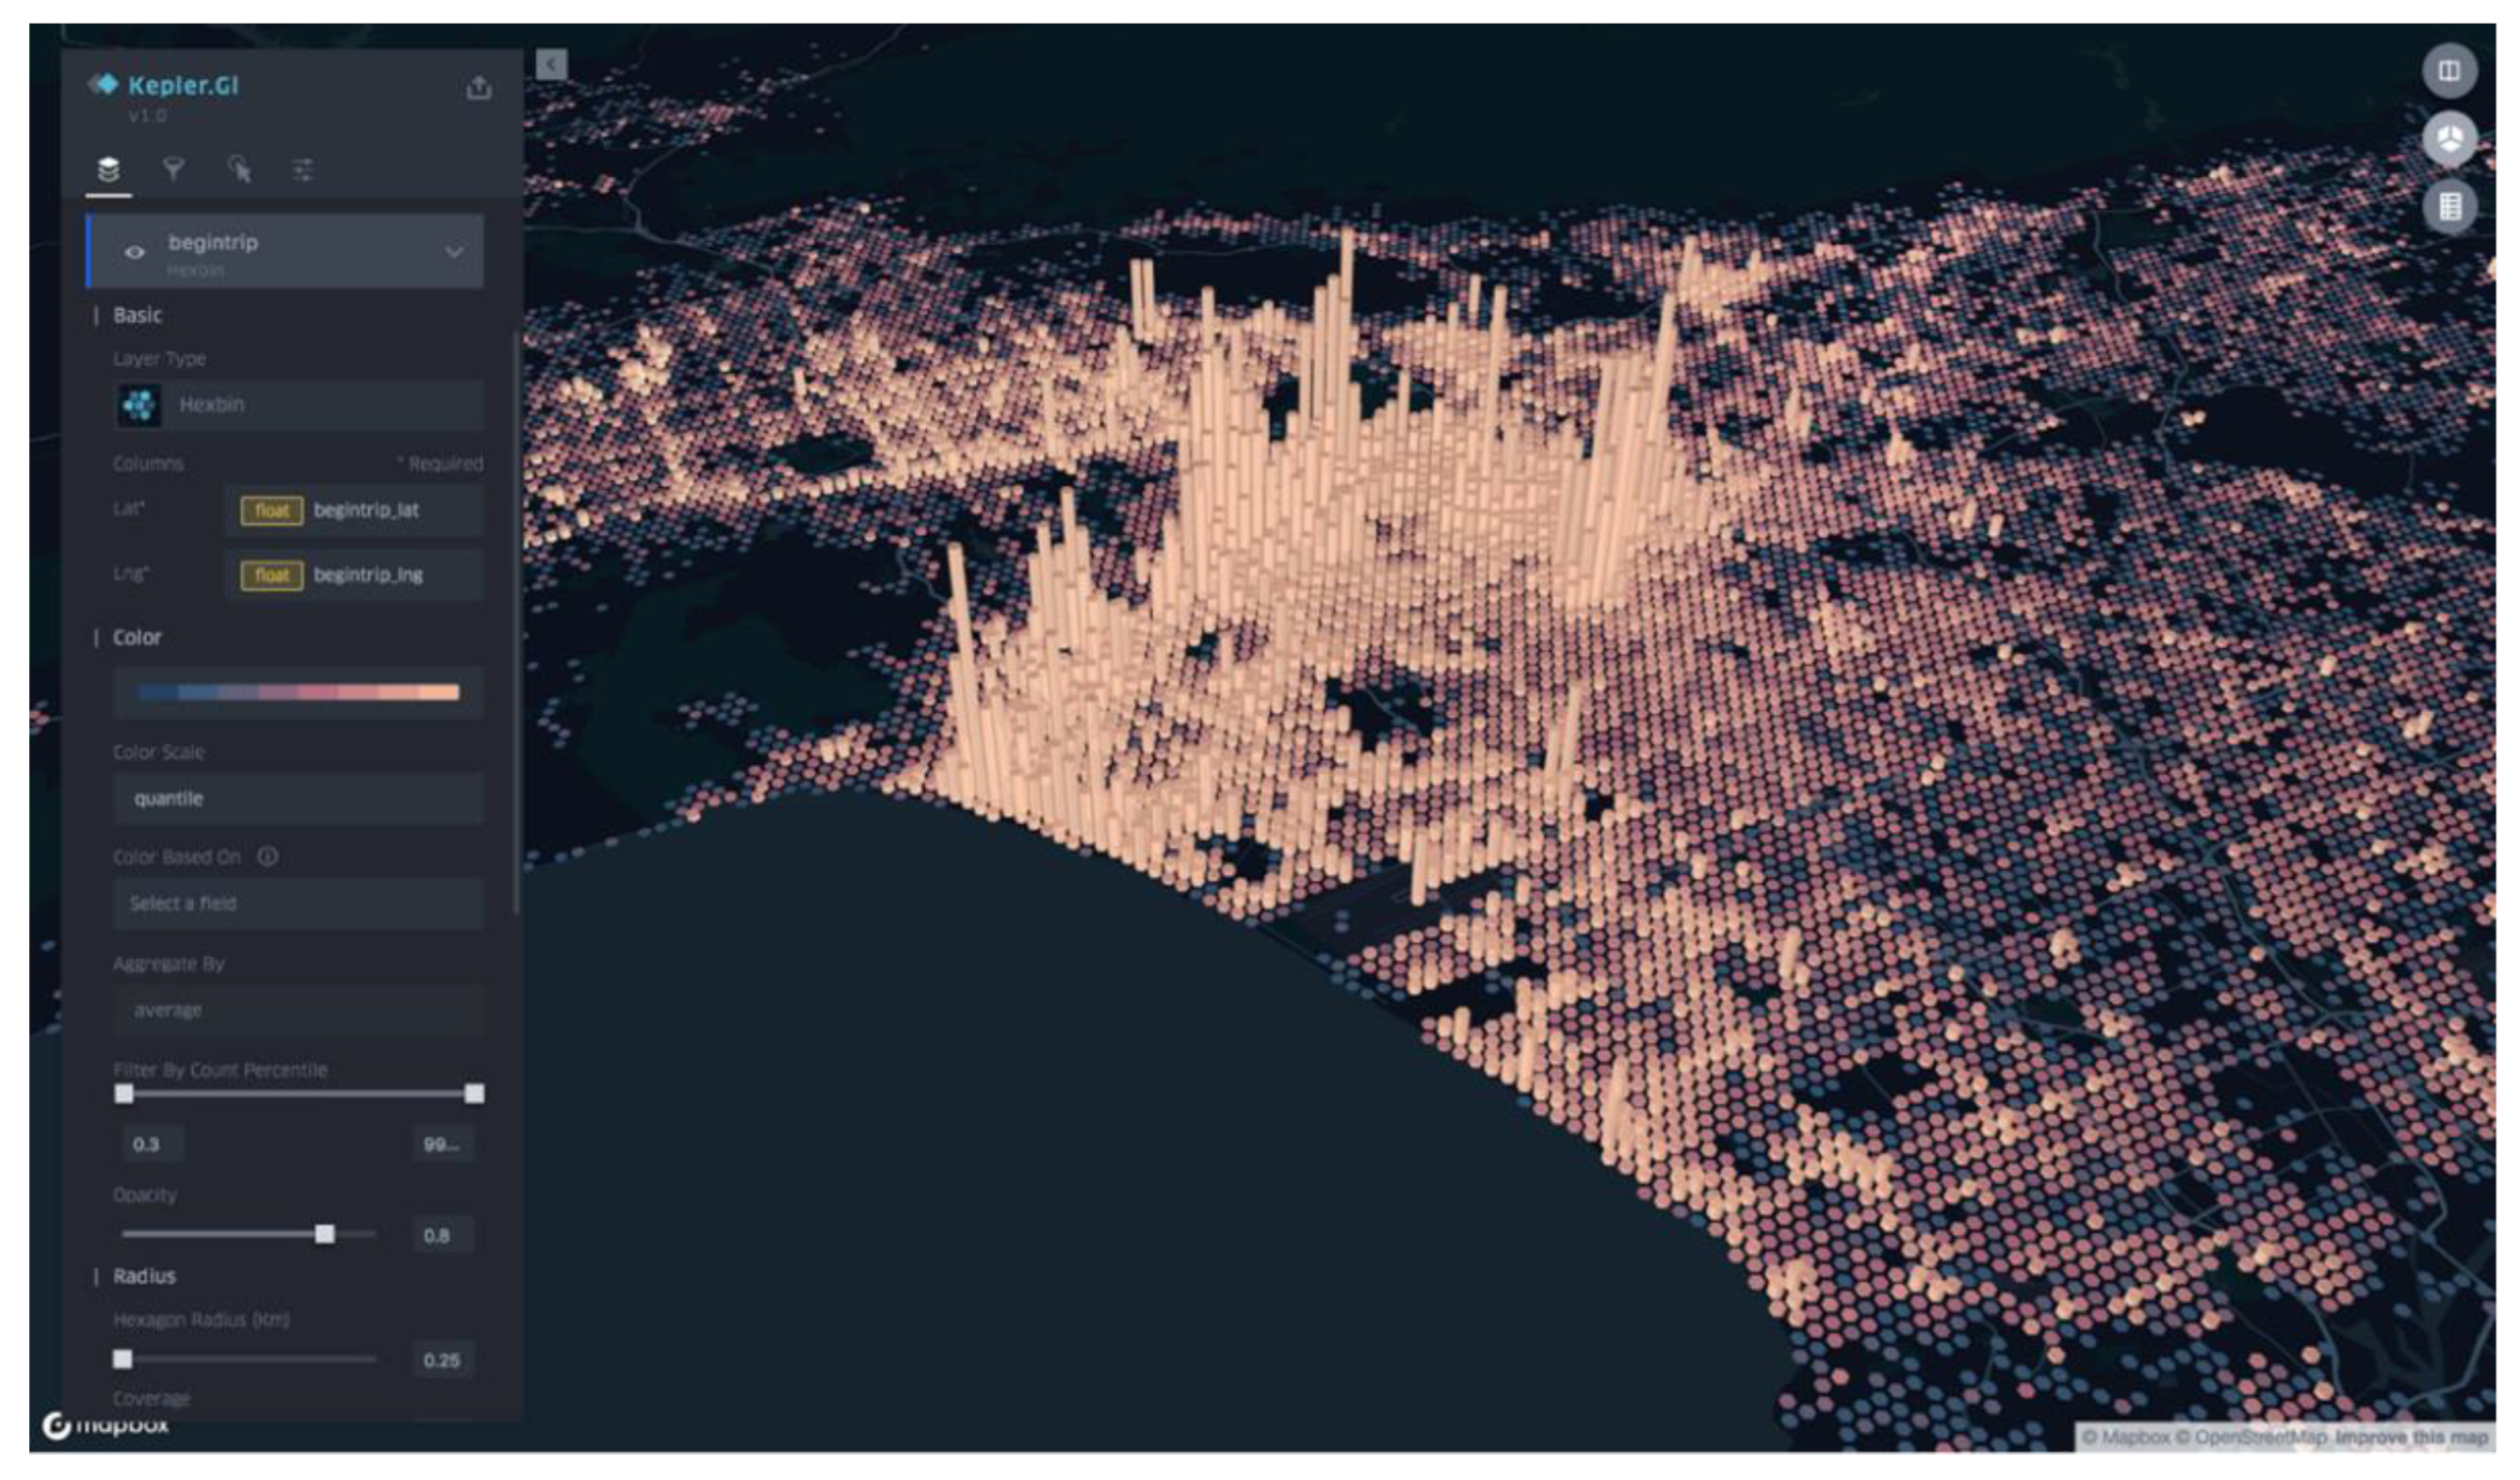
Figure 7. Illustration of Kepler.gl converting points to 3D hexbins (Source: Uber Engineering (https://eng.uber.com//, accessed on 24 March 2022)).
6. Concluding Remarks
GIS is an essential tool to be integrated in analyzing atomized transportation data on the grounds that transportation is a spatial phenomenon. The ongoing smartphone and GPS-enabled devices’ penetration has made using GIS inevitable, as it is projected to reach 60% in 2022 [70]. Table 1 summarizes the results of this entry in respect to the adopted GIS definition.
Table 1. Summary of the entry results.
| Active Transportation | Micromobility | Cars | |
|---|---|---|---|
| Data producer | Social fitness networks (e.g., Strava) Transportation agencies (e.g., SFCTA) Advocate groups (e.g., SafeLanes.org) Imagery (e.g., Google Earth) Bike-sharing systems (e.g., Los Angeles’ Metro Bike) |
Service providers (e.g., Uber Movement) Transportation agencies (e.g., City of Austin open data portal) |
Apps (e.g., Street Bump) Ride sharing services (e.g., Uber) Imagery (e.g., Google Earth) |
| Types of data | Trip volume data Trip histories data Infrastructure data |
Trip volume data | Infrastructure data Average speed and travel time |
| Methods | Spatial statistics (e.g., heatmap and proximity analysis) | Spatial statistics (e.g., heatmap and proximity analysis) | Spatial statistics (e.g., heatmap and proximity analysis) |
| Manual digitization | Manual digitization | ||
| Visualization methods | Object-oriented programing languages (e.g., R and Python) GIS software (e.g., ArcMap) Cloud-based analytic tool (e.g., Kepler.gl) |
||
Researchers and planners are seeking to catalyze the shift from internal combustion engine vehicles to active transportation and micromobility, consequently making cities more livable. To do so, data-driven decision-making is needed. In this work, we reviewed basic GIS concepts and how they are integrated by studying atomized transportation modes, although GIS is also being used for mass transportation modes such as subways [71], airlines [72], and cruise ships [73]. Evidently, the availability of open data is the reason behind the wealth of literature in some areas (e.g., bike-sharing systems) and some areas being in their infancy (e.g., pedestrian GPS trajectories). This work calls for the following recommendations:
-
There is a pressing need for researchers and planners to be equipped with GIS skills to deal with atomized transportation data;
-
Making the data openly available to facilitate a better understanding of trends and allowing more collaboration between researchers. A geographic gap can be witnessed in the case studies’ location, given the availability of data. For instance, limited knowledge is available about locations where active transportation is less prevalent;
-
There is a lack of studies about food delivery services making cycling more safe and providing jobs that include cyclist couriers in active transportation advocacy plans [74];
-
There is a scarcity in the literature about bike-sharing systems and micromobility vandalism and theft incidents. Collecting such data might be cumbersome for researchers. Yet, if service operators provide such data, insightful patterns that help to curb such behavior might be revealed;
-
There is a need for further investigation into the reliability of big data in terms of its representativeness and precision;
-
Replicating previous work with finer resolution data. For example, most bike-sharing system studies rely on origin–destination, whereas GPS trajectories are less used, creating a gap in the literature regarding bike-sharing system users’ route choice.
References
- Rodrigue, J.-P. The Geography of Transport Systems; Routledge: London, UK, 2020.
- Komalavalli, C.; Laroiya, C. Challenges in Big Data Analytics Techniques: A Survey. In Proceedings of the 2019 9th International Conference on Cloud Computing, Data Science & Engineering (Confluence), Noida, India, 10–11 January 2019; pp. 223–228.
- Berke, E.M. Geographic Information Systems (GIS): Recognizing the Importance of Place in Primary Care Research and Practice. J. Am. Board Fam. Med. 2010, 23, 9–12.
- Scarano, A. The Outrageous Map of the 1854 London Epidemic. Available online: https://www.domusweb.it/en/news/2020/05/03/the-outrageous-map-of-the-1854-london-epidemic.html (accessed on 11 May 2022).
- Ruankaew, N. GIS and Epidemiology. J. Med. Assoc. Thailand Chotmaihet Thangphaet 2005, 88, 1735–1738.
- van Schaaik, J.G.J.; Kemp, J.J. Real Crimes on Virtual Maps: The Application of Geography and Gis in Criminology. In Geospatial Technology and the Role of Location in Science; Springer: Berlin/Heidelberg, Germany, 2009; pp. 217–237.
- Herries, J. Mapping the Opportunity to Intervene Clearly. Available online: https://www.esri.com/about/newsroom/wp-content/uploads/2018/08/Mapping-the-Oppty-to-Intervene-Clearly.pdf (accessed on 22 March 2022).
- Campos-Sánchez, F.S.; Valenzuela-Montes, L.M.; Abarca-Álvarez, F.J. Evidence of Green Areas, Cycle Infrastructure and Attractive Destinations Working Together in Development on Urban Cycling. Sustainability 2019, 11, 4730.
- Alattar, M.A.; Cottrill, C.; Beecroft, M. Modelling Cyclists’ Route Choice Using Strava and OSMnx: A Case Study of the City of Glasgow. Transp. Res. Interdiscip. Perspect. 2021, 9, 100301.
- Stewart, N. Using Pedestrian Accessibility Indicators to Locate Schools: A Site Suitability Analysis in Greenville County, South Carolina. Doctoral Dissertation, University of Southern California, Los Angeles, CA, USA, 2016.
- Yen, Y.; Zhao, P.; Sohail, M.T. The Morphology and Circuity of Walkable, Bikeable, and Drivable Street Networks in Phnom Penh, Cambodia. Environ. Plan. B Urban Anal. City Sci. 2019, 48, 169–185.
- Alattar, M.; Cottrill, C.; Beecroft, M. Accounting for Spatial Heterogeneity Using Crowdsourced Data. Findings 2021.
- Zhu, D.; Liu, Y. Modelling Irregular Spatial Patterns Using Graph Convolutional Neural Networks. arXiv 2018, arXiv:1808.09802.
- Alattar, M.A.; Cottrill, C.; Beecroft, M. Public Participation Geographic Information System (PPGIS) as a Method for Active Travel Data Acquisition. J. Transp. Geogr. 2021, 96, 103180.
- Hern, A. Fitness Tracking App Strava Gives Away Location of Secret US Army Bases. Guardian 2018, 28, 2018.
- Saunders, L.E.; Green, J.M.; Petticrew, M.P.; Steinbach, R.; Roberts, H. What Are the Health Benefits of Active Travel? A Systematic Review of Trials and Cohort Studies. PLoS ONE 2013, 8, e69912.
- Gui, X.; Chen, Y.; Caldeira, C.; Xiao, D.; Chen, Y. When Fitness Meets Social Networks: Investigating Fitness Tracking and Social Practices on Werun. In Proceedings of the 2017 CHI Conference on Human Factors in Computing Systems, Denver, CO, USA, 6–11 May 2017; pp. 1647–1659.
- Ali, S. The Dark Side of Strava: What Happens When Users Lose Control. Available online: https://www.newstatesman.com/social-media/2021/10/thedarksideofstrava (accessed on 24 May 2022).
- Rivers, D.J. Strava as a Discursive Field of Practice: Technological Affordances and Mediated Cycling Motivations. Discourse Context Media 2020, 34, 100345.
- Ferster, C.; Nelson, T.; Laberee, K.; Winters, M. Mapping Bicycling Exposure and Safety Risk Using Strava Metro. Appl. Geogr. 2021, 127, 102388.
- Sun, Y.; Mobasheri, A. Utilizing Crowdsourced Data for Studies of Cycling and Air Pollution Exposure: A Case Study Using Strava Data. Int. J. Environ. Res. Public Health 2017, 14, 274.
- Venter, Z.S.; Barton, D.N.; Gundersen, V.; Figari, H.; Nowell, M.S. Back to Nature: Norwegians Sustain Increased Recreational Use of Urban Green Space Months after the COVID-19 Outbreak. Landsc. Urban Plan. 2021, 214, 104175.
- Jäger, H.; Schirpke, U.; Tappeiner, U. Assessing Conflicts between Winter Recreational Activities and Grouse Species. J. Environ. Manag. 2020, 276, 111194.
- Colorado Department of Transportation Strava Metro Data Analysis Summary. 2018. Available online: https://www.codot.gov/programs/bikeped/documents/strava-analysis-summary_06-25-18.pdf (accessed on 24 May 2022).
- Alkon, A.H.; Norgaard, K.M. Breaking the Food Chains: An Investigation of Food Justice Activism. Sociol. Inq. 2009, 79, 289–305.
- Hood, J.; Sall, E.; Charlton, B. A GPS-Based Bicycle Route Choice Model for San Francisco, California. Transp. Lett. 2011, 3, 63–75.
- Watkins, K.; Ammanamanchi, R.; LaMondia, J.; Le Dantec, C.A. Comparison of Smartphone-Based Cyclist GPS Data Sources. In Proceedings of the Transportation Research Board 95th Annual Meeting, Washington DC, USA, 10–14 September 2016.
- Moran, M.E. Where the Crosswalk Ends: Mapping Crosswalk Coverage via Satellite Imagery in San Francisco. Environ. Plan. B Urban Anal. City Sci. 2022, 23998083221081530.
- Zheng, L.; Li, Y. The Development, Characteristics and Impact of Bike Sharing Systems: A Literature Review. Int. Rev. Spat. Plan. Sustain. Dev. 2020, 8, 37–52.
- Hu, S.; Xiong, C.; Liu, Z.; Zhang, L. Examining Spatiotemporal Changing Patterns of Bike-Sharing Usage during COVID-19 Pandemic. J. Transp. Geogr. 2021, 91, 102997.
- El-Assi, W.; Mahmoud, M.S.; Habib, K.N. Effects of Built Environment and Weather on Bike Sharing Demand: A Station Level Analysis of Commercial Bike Sharing in Toronto. Transportation 2017, 44, 589–613.
- Ashqar, H.I.; Elhenawy, M.; Rakha, H.A. Modeling Bike Counts in a Bike-Sharing System Considering the Effect of Weather Conditions. Case Stud. Transp. Policy 2019, 7, 261–268.
- Morton, C.; Kelley, S.; Monsuur, F.; Hui, T. A Spatial Analysis of Demand Patterns on a Bicycle Sharing Scheme: Evidence from London. J. Transp. Geogr. 2021, 94, 103125.
- Li, X.; Xu, Y.; Zhang, X.; Shi, W.; Yue, Y.; Li, Q. Improving Short-Term Bike Sharing Demand Forecast through an Irregular Convolutional Neural Network. arXiv 2022, arXiv:2202.04376.
- Ma, X.; Yin, Y.; Jin, Y.; He, M.; Zhu, M. Short-Term Prediction of Bike-Sharing Demand Using Multi-Source Data: A Spatial-Temporal Graph Attentional LSTM Approach. Appl. Sci. 2022, 12, 1161.
- Teixeira, J.F.; Lopes, M. The Link between Bike Sharing and Subway Use during the COVID-19 Pandemic: The Case-Study of New York’s Citi Bike. Transp. Res. Interdiscip. Perspect. 2020, 6, 100166.
- Fung, C.M.; McArthur, D.P.; Hong, J. Examining the Effects of a Temporary Subway Closure on Cycling in Glasgow Using Bike-Sharing Data. Travel Behav. Soc. 2021, 25, 62–77.
- Korzilius, O.; Borsboom, O.; Hofman, T.; Salazar, M. Optimal Design of Electric Micromobility Vehicles. In Proceedings of the 2021 IEEE International Intelligent Transportation Systems Conference (ITSC), Indianapolis, IN, USA, 19–22 September 2021; pp. 1677–1684.
- Lazarus, J.; Pourquier, J.C.; Feng, F.; Hammel, H.; Shaheen, S. Micromobility Evolution and Expansion: Understanding How Docked and Dockless Bikesharing Models Complement and Compete—A Case Study of San Francisco. J. Transp. Geogr. 2020, 84, 102620.
- Şengül, B.; Mostofi, H. Impacts of E-Micromobility on the Sustainability of Urban Transportation—A Systematic Review. Appl. Sci. 2021, 11, 5851.
- Sundfør, H.B.; Fyhri, A. A Push for Public Health: The Effect of e-Bikes on Physical Activity Levels. BMC Public Health 2017, 17, 809.
- Schepers, P.; Wolt, K.K.; Helbich, M.; Fishman, E. Safety of E-Bikes Compared to Conventional Bicycles: What Role Does Cyclists’ Health Condition Play? J. Transp. Health 2020, 19, 100961.
- Aman, J.J.C.; Zakhem, M.; Smith-Colin, J. Towards Equity in Micromobility: Spatial Analysis of Access to Bikes and Scooters amongst Disadvantaged Populations. Sustainability 2021, 13, 11856.
- Philips, I.; Anable, J.; Chatterton, T. A Small Area Estimation of the Capability of Individuals to Replace Car Travel with Walking, Cycling and e-Bikes and Its Implications for Energy Use. In Proceedings of the ECEEE Summer Study Proceedings, Hyères France, 3–8 June 2019; pp. 1097–1104.
- Li, Y.; Dai, Z.; Zhu, L.; Liu, X. Analysis of Spatial and Temporal Characteristics of Citizens’ Mobility Based on e-Bike GPS Trajectory Data in Tengzhou City, China. Sustainability 2019, 11, 5003.
- Espinoza, W.; Howard, M.; Lane, J.; Van Hentenryck, P. Shared E-Scooters: Business, Pleasure, or Transit? arXiv 2019, arXiv:1910.05807, 5807.
- Yan, X.; Yang, W.; Zhang, X.; Xu, Y.; Bejleri, I.; Zhao, X. A Spatiotemporal Analysis of E-Scooters’ Relationships with Transit and Station-Based Bikeshare. Transp. Res. Part D Transp. Environ. 2021, 101, 103088.
- Li, A.; Zhao, P.; He, H.; Axhausen, K.W. Understanding the Variations of Micro-Mobility Behavior before and during COVID-19 Pandemic Period. Arbeitsberichte Verkehrs-und Raumplan. 2020, 1547.
- Bai, S.; Jiao, J. From Shared Micro-Mobility to Shared Responsibility: Using Crowdsourcing to Understand Dockless Vehicle Violations in Austin, Texas. J. Urban Aff. 2020, 1–13.
- Brown, A.; Klein, N.J.; Thigpen, C.; Williams, N. Impeding Access: The Frequency and Characteristics of Improper Scooter, Bike, and Car Parking. Transp. Res. Interdiscip. Perspect. 2020, 4, 100099.
- Schepers, P.; Klein Wolt, K.; Fishman, E. The Safety of E-Bikes in The Netherlands; Discussion Paper; International Transport Forum: Paris, France, 2018.
- Brisimi, T.S.; Cassandras, C.G.; Osgood, C.; Paschalidis, I.C.; Zhang, Y. Sensing and Classifying Roadway Obstacles in Smart Cities: The Street Bump System. IEEE Access 2016, 4, 1301–1312.
- Burgart, S. Gap Trap: A Pothole Detection and Reporting System Utilizing Mobile Devices. 2014. Available online: https://www.cs.umd.edu/sites/default/files/scholarly_papers/Burgart.pdf (accessed on 24 May 2022).
- Zhang, Z. Exploring the Potentials of Using Crowdsourced Waze Data in Traffic Management: Characteristics and Reliability. Doctoral Dissertations, University of Tennessee, Knoxville, TN, USA, 2020.
- Moran, M. What’s Your Angle? Analyzing Angled Parking via Satellite Imagery to Aid Bike-Network Planning. Environ. Plan. B Urban Anal. City Sci. 2020, 48, 2399808320954205.
- Dukiya, J.J. GIS Based On-Street Urban Parking Analysis and Management in Minna, Niger State, Nigeria. Int. J. Sustain. Transp. Logist. 2021, 1, 1–11.
- Pappalardo, L.; Rinzivillo, S.; Qu, Z.; Pedreschi, D.; Giannotti, F. Understanding the Patterns of Car Travel. Eur. Phys. J. Spec. Top. 2013, 215, 61–73.
- Lee, K.; Sener, I.N. Emerging Data Mining for Pedestrian and Bicyclist Monitoring: A Literature Review Report; Safety through Disruption (Safe-D) National University Transportation Center (UTC) Program; Texas A&M Transportation Institute: Austin, TX, USA, 2017.
- Sun, Y.; Ren, Y.; Sun, X. Uber Movement Data: A Proxy for Average One-Way Commuting Times by Car. ISPRS Int. J. Geo-Inf. 2020, 9, 184.
- Ch, N.A.N.; Krumm, J.; Kun, A. Speed Anomalies and Safe Departure Times from Uber Movement Data. In Proceedings of the 9th SIGKDD International Workshop on Urban Computing, San Diego, CA, USA, 24 August 2020.
- Correa, D.; Xie, K.; Ozbay, K. Exploring the Taxi and Uber Demand in New York City: An Empirical Analysis and Spatial Modeling. In Proceedings of the 96th Annual Meeting of the Transportation Research Board, Washington, DC, USA, 8–12 January 2017.
- Willis, G.; Tranos, E. Using ‘Big Data’to Understand the Impacts of Uber on Taxis in New York City. Travel Behav. Soc. 2021, 22, 94–107.
- Brodeur, A.; Nield, K. An Empirical Analysis of Taxi, Lyft and Uber Rides: Evidence from Weather Shocks in NYC. J. Econ. Behav. Organ. 2018, 152, 1–16.
- Jin, S.T.; Kong, H.; Sui, D.Z. Uber, Public Transit, and Urban Transportation Equity: A Case Study in New York City. Prof. Geogr. 2019, 71, 315–330.
- Blazquez, C.; Laurent, J.G.C.; Nazif-Munoz, J.I. Differential Impacts of Ridesharing on Alcohol-Related Crashes by Socioeconomic Municipalities: Rate of Technology Adoption Matters. BMC Public Health 2021, 21, 2008.
- Du, J.; Rakha, H.A.; Breuer, H. An In-Depth Spatiotemporal Analysis of Ride-Hailing Travel: The Chicago Case Study. Case Stud. Transp. Policy 2022, 10, 118–129.
- Marzuoli, A.; Liu, F. A Data-Driven Impact Evaluation of Hurricane Harvey from Mobile Phone Data. In Proceedings of the 2018 IEEE International Conference on Big Data (Big Data), Seattle, WA, USA, 10–13 October 2018; IEEE: New York, NY, USA, 2018; pp. 3442–3451.
- Yang, C.; Sha, D.; Liu, Q.; Li, Y.; Lan, H.; Guan, W.W.; Hu, T.; Li, Z.; Zhang, Z.; Thompson, J.H.; et al. Taking the Pulse of COVID-19: A Spatiotemporal Perspective. Int. J. Digit. Earth 2020, 13, 1186–1211.
- MacKenzie, D.; Ban, X.J.; Pathak, C.; Arabkhedri, B. Crowdsourcing Parking Data for Micromobility Vehicles; Connected Cities for Smart Mobility toward Accessible and Resilient Transportation Center: Brooklyn, NY, USA, 2020.
- Hasimoto-Beltran, R.; Calderon-Calderon, M.D.; Olavarría-Jaramillo, V.H. Secure Real-Time Chaotic Partial Encryption of Entropy-Coded Multimedia Information for Mobile Devices: Smartphones. IEEE Access 2022, 10, 15876–15890.
- Ghorbanzadeh, M.; Effati, M.; Gilanifar, M.; Ozguven, E.E. Subway Station Site Selection Using GIS-Based Multi-Criteria Decision-Making: A Case Study in a Developing Country. Comput. Res. Prog. Appl. Sci. Eng. 2020, 6, 60–69.
- Borhani, M.; Akbari, K.; Matkan, A.; Tanasan, M. A Multicriteria Optimization for Flight Route Networks in Large-Scale Airlines Using Intelligent Spatial Information. Rev. IJIMAI 2020, 6, 121–123.
- Gabe, T.M.; Lynch, C.P.; McConnon Jr, J.C. Likelihood of Cruise Ship Passenger Return to a Visited Port: The Case of Bar Harbor, Maine. J. Travel Res. 2006, 44, 281–287.
- Lee, D.J.; Ho, H.; Banks, M.; Giampieri, M.; Chen, X.; Le, D. Delivering (in) Justice: Food Delivery Cyclists in New York City. In Bicycle Justice and Urban Transformation; Routledge: London, UK, 2016; pp. 114–129.
This entry is offline, you can click here to edit this entry!