1. Introduction
The word resilience originally stems from the Latin term “resiliere” that means to jump back or bounce back. The first careful consideration of the term resilience arose in the field of mechanics in 1858, followed by psychology in the 1950s, human ecology in the 1990s, and ending up with disaster risk reduction and climate change adaptation in the 2000s [
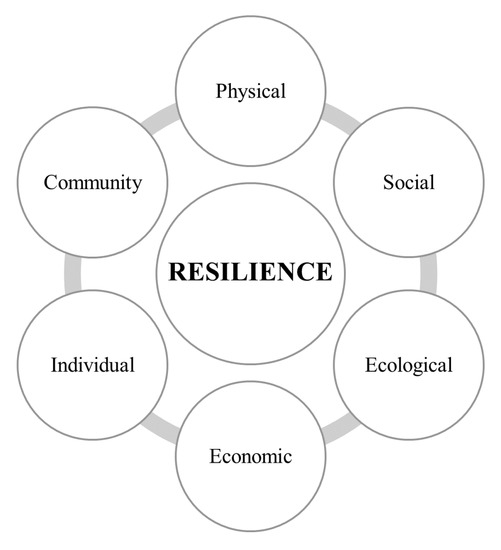
1]. Resilience concentrates on improving the capacity of a system in the face of multiple hazards, rather than precluding or diminishing the loss of assets because of specified events. Resilience accepts the condition that a wide range of disruptive events—both stresses and shocks—may take place but are not inevitably foreseeable. This research topic has received significant interest from not only researchers but also practitioners and service-users. Recognising the importance of resilience, many definitions at multiple domains have been offered, as shown in , including physical [
2,
3], social [
4,
5], ecological [
6,
7,
8], economic [
9], individual [
10,
11], and community [
12,
13]. According to mentioned literature, there is no commonly accepted way to define the concept of resilience formally; besides, several definitions are even overlapping with existing concepts [
14], some of which are robustness, fault-tolerance, flexibility, survivability, and agility.
Figure 1. Multiple domains of resilience.
As the formal definition given by the United Nations Office for Disaster Risk Reduction (UNDRR), resilience is “the ability of a system, community or society exposed to hazards to resist, absorb, accommodate, adapt to, transform and recover from the effects of a hazard in a timely and efficient manner [
15]”, in not only pre- but also post-disaster. During pre-disaster, we aim at anticipating vulnerabilities and risks proactively to mitigate harmful effects. On the other hand, the capability of valid and sufficient recovery is an essential objective in the post-disaster period [
16]. Studies about resilience can help our societies in reducing disaster risk, adapting to climate changes, and coming up with strategies to develop more sustainably and efficiently.
In this paper, we focus on giving an overview of multiple perspectives regarding community resilience. Community resilience aims at representing the abilities of a local community as a complex system, including actions and interactions of local agencies, natural and built environments, critical infrastructures, and citizens, to reduce, withstand, and even turn back from impacts of hazards, as well as the competence to adapt and thrive themselves to be less vulnerable to future disasters and emergencies. There are more and more studies concentrating on building community resilience across various application domains (e.g., tourism [
17], biodiversity management [
18], energy [
19], and mental health [
20]) in either global [
21] or regional levels, some of which are Brazil [
22], Greece [
23], and the United Kingdom [
24]. Nonetheless, this research field still needs many efforts from researchers and practitioners to come up with comprehensive methodologies to model, measure, and understand community resilience. These three mandatory phases can support communities in proposing additional activities and new approaches to the comprehension of how to ensure that our communities can be better prepared, more flexible, and have the ability to bounce back promptly from an event, whatever form it may take.
Our motivation is to provide crucial knowledge regarding multiple methods for modelling, measuring, and visualising community resilience in this paper. For coming up with optimal decision-making criteria and strategies to make our communities resilient, we should focus on the entire process—all of these three phases. In particular, we address various components and properties to model community resilience; different qualitative, quantitative, and hybrid approaches for measuring resilience value; and several visualisation methods at the end to show resilience-related information. We believe that this paper can support not only academic researchers but also practitioners in recognising what frameworks are already out there and how we can build on them.
In this section, we introduced the problem and emphasised our motivation for conducting this review. The rest of this paper includes the following structure. In the next section, the necessary background will be given.
Section 3 will provide vital information about the materials and methods to conduct this review. Further,
Section 4 summarises different methodologies for modelling community resilience. Then, we will describe qualitative, quantitative, and hybrid approaches to measure community resilience in
Section 5.
Section 6 will provide various visualisation techniques for representing resilience information. Finally, we will give some discussion, draw essential conclusions, and express future directions in the last section.
2. Background
Community resilience is a complicated concept that cannot be captured and turned into explicit knowledge effortlessly. What is generally accepted among researchers is the fact that community resilience tremendously depends on multiple components that affect and influence the overall resilience of a community [
25]. Such elements can be related to particular risks, temporal and spatial contexts, and community features that resilience refers to (e.g., perception, hazards, and capacities). Even more complex, the term community resilience also has diverse meanings between communities by referring to different components of the community, including, but not limited to, the resilience of community infrastructure [
26] and the resilience of social relationships [
27]. Hence, it is necessary to identify, define, and describe the particular components and properties of community resilience in the process of modelling.
Based on components and properties defined in the modelling step, we can apply qualitative, quantitative, or hybrid methodologies to translate resilience dimensions, indicators, and proxies into tractable and understandable frameworks, expressions, formulations, or values. The target of qualitative methods is to provide detailed descriptions depending on specific contexts. To enable the ability to understand and transfer results, experts account for their viewpoints and perspectives [
28] through case studies, grounded theories, interviews, ethnography, phenomenology, and hermeneutics [
29]. It is ordinary to represent qualitative results as charts, diagrams, and other graphics by using visualisation methods. On the other hand, we measure quantitative value by paying attention to community resilience at a particular time point or by comparing resilience value before and after an event [
30]. Generally, the community resilience value is appropriate for internal use. To compare a community with others, we may use their rank or percentile equivalent of the community resilience value; however, we have to ensure that the measurements should be taken in similar contexts. Our data should be comparable, comprehensible, measurable, and relevant [
21] so that it is suitable for quantitative methodologies. Further, hybrid approaches are the integration of quantitative and qualitative methods; therefore, they can estimate both tangible and intangible value of community resilience.
Visualisation is the final puzzle piece to complete a big-picture of community resilience. In emergencies, especially in situations requiring immediate actions, we may face a massive amount of community resilience information. Visualisation is an effective and efficient solution that has the capacity to represent resilience-related information of communities in systematic forms without missing essential details [
31]. We can also utilise information visualisation to discover latent patterns, which are arduous to recognise manually [
32]. Additionally, emerging digital visualisation tools can involve end-users in many interactions (e.g., zooming in or out, employing dynamic charts, and changing visual appearances such as colours and shapes). With the support of disruptive technologies (e.g., machine learning and artificial intelligence) [
33], we can leverage information visualisation to build recommender systems and dashboards for potential use in emergencies, disasters, and catastrophes as well.