The most common bone disease in humans is osteoporosis (OP). Current therapeutics targeting OP have several negative side effects. Bone morphogenetic protein 2 (BMP2) is a potent growth factor that is known to activate both osteoblasts and osteoclasts. It completes these actions through both SMAD-dependent and SMAD-independent signaling. A novel interaction between the BMP type Ia receptor (BMPRIa) and casein kinase II (CK2) was discovered, and several CK2 phosphorylation sites were identified. A corresponding blocking peptide (named CK2.3) was designed to further elucidate the phosphorylation site’s function. Previously, CK2.3 demonstrated an increased osteoblast activity and decreased osteoclast activity in a variety of animal models, cell lines, and
isolated human osteoblasts. It is hypothesized that CK2.3 completes these actions through the BMP signaling pathway. Furthermore, it was recently discovered that BMP2 did not elicit an osteogenic response in osteoblasts from patients diagnosed with OP, while CK2.3 did. In this study, we explore where in the BMP pathway the signaling disparity or defect lies in those diagnosed with OP. We found that osteoblasts isolated from patients diagnosed with OP did not activate SMAD or ERK signaling after BMP2 stimulation. When OP osteoblasts were stimulated with BMP2, both BMPRIa and CK2 expression significantly decreased. This indicates a major disparity within the BMP signaling pathway in patients diagnosed with osteoporosis.
- osteoporosis
- BMP2
- CK2.3
- pERK
- pSMAD
1. Definition
Bone morphogenetic protein 2 (BMP2) is a potent growth factor that is known to induce both osteoblast activity and osteoclast activity [1]. BMP2 has been approved by the FDA for the healing of long bone fractures and spinal fusion surgeries [2]. Its potential use as an osteoporotic treatment has been explored; however, long-term use of BMP2 has been linked to increased osteoclast activity and bone resorption [3]. In addition, there are a multitude of negative side-effects following the use of BMP2 in the clinic, such as vertebral osteolysis, hematoma and seroma formation [2]. Therefore, while BMP2 itself is not an optimal treatment for OP, studying and analyzing the BMP pathway will elucidate the mechanism of osteoblast and osteoclast activation, and this pathway may be implicated for future therapeutics.
2. Introduction
Osteoporosis (OP) is a debilitating bone disease affecting approximately one in three women and one in five men age 50 years and older, worldwide [4]. As the aging population increases, the number of patients who will be diagnosed with OP will also increase [5][6]. Therefore, there is an urgent need to further delineate the causes of OP and develop novel therapeutics to treat this disease. Currently, there are six different types of osteoporotic medications clinically available. A large majority of these treatments are antiresorptive, meaning they focus on decreasing bone resorption. There are very few treatments on the market that are anabolic, which increase bone formation [7]. Currently, there is one available treatment, namely Romosozumab, that increases bone formation while decreasing bone resorption [8]. However, because of its recent approval from the Food and Drug Administration (FDA), its long-term side effects have not been well-characterized [9][10]. Therefore, alternate therapeutics need to be developed, but in order to create more effective drug options, bone maintenance and homeostasis must be understood.
The bones are maintained and remodeled through the bone remodeling system. There are two major cell types in this system, which include osteoclasts and osteoblasts. Osteoclasts are responsible for resorbing back old or damaged bone, while osteoblasts form new bone [11]. In a normal, healthy individual, there is a balance between osteoclast activity and osteoblast activity. However, in OP patients, there is an imbalanced relationship between these two cell types, causing increased osteoclast activity and decreased osteoblast activity [12]. This leads to increased porosity in bone, which increases the risk of fractures [12]. In 2015, there were 2.3 million osteoporotic fractures reported in the United States; therefore, understanding this disease and developing more viable treatments that target both osteoblasts and osteoclasts is of the utmost importance [4].
Interestingly, several research groups have discovered a potential signaling disparity within the BMP pathway with those diagnosed with OP [13][14]. Further, we have previously reported that osteoblasts extracted from patients diagnosed with OP did not respond to BMP2 stimulation through mineralization assessments [15]. Mineralization deposits consist of mainly calcium and phosphate, thus indicating whether BMP2 is stimulating bone formation in OP patients when compared to control patients. Additionally, it has been demonstrated that there is a decrease in BMP2 induced SMAD signaling (the canonical signaling pathway) when compared to control patients, as indicated by decreased SMAD4 levels [13].
BMP2 can bind to two receptors responsible for initiating the canonical and non-canonical signaling cascades, which are known as the type I receptor (BMPRIa) and the type II receptor (BMPRII). BMP2 induced signaling is initiated when the protein either recruits the binding of the two receptors to dimerize or binds to already dimerized receptors [16]. Once all three components are bound together in a complex, the type II receptor will phosphorylate the type I receptor within its glycine-serine-rich (GS) box homeodomain [17]. Subsequently, both SMAD independent and SMAD dependent signaling may be activated [17].
3. Results
2.1. BMP2 Stimulation Decreases pERK Expression in OP Patients
Since BMP2 stimulation did not induce an osteogenic mineralization response, other downstream signaling proteins need to be further investigated in order to determine where the BMP signaling disparity lies. The SMAD independent signaling encompasses a variety of pathways, one of which is the ERK signaling pathway. To analyze the ERK signaling pathway, mature osteoblasts were plated, grown, and stimulated with either BMP2, CK2.3 or left unstimulated (US). After the fifth day, cells were stained immunofluorescently for pERK (green), and the nucleus (blue), Figure 1a. BMP2 stimulation significantly decreased expression of pERK, or activated ERK, when compared to US and CK2.3 stimulated cells. Interestingly, CK2.3 and US cells had significantly increased expression of pERK over BMP2. These results were further validated through an immunoblot. Briefly, patient cells were stimulated with BMP2, CK2.3 or left US for five days. On the fifth day, lysates were collected, and protein concentration was determined and normalized. Lysates were run on an SDS-PAGE gel, transferred to a PDVF membrane, and immunoblotted for pERK and β-actin. BMP2 significantly decreased expression of pERK when compared to CK2.3 stimulated cells, Figure 1b. This indicates ERK/SMAD independent signaling is disrupted in OP when stimulated with BMP2.
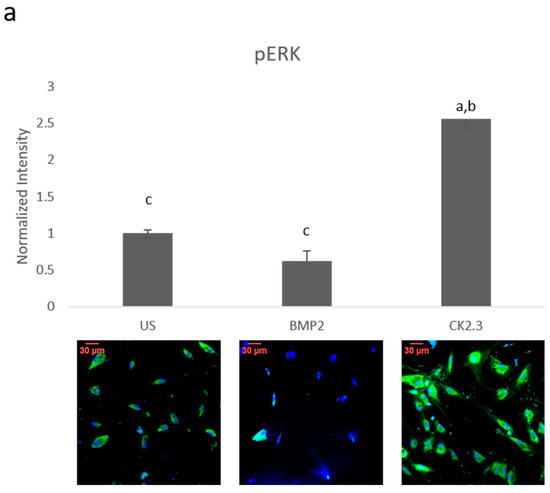
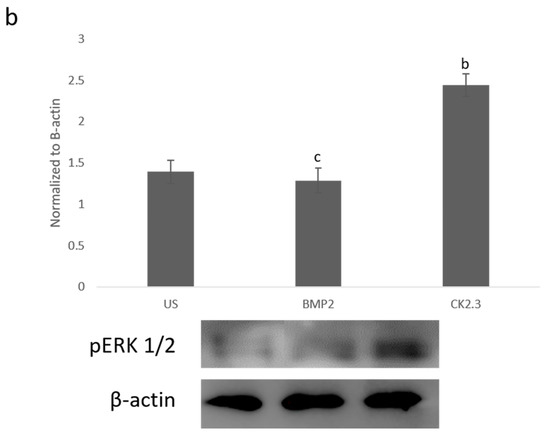
Figure 1. Mature osteoblasts were extracted from osteoporosis (OP) patients and stimulated with BMP2, CK2.3 or were left unstimulated (US) for five days. On the fifth day cells were fixed and fluorescently stained for pERK (green) and the nucleus (blue). (a) CK2.3 significantly increased fluorescent intensity when compared to BMP2 and US cells. BMP2 stimulation significantly decreased fluorescent intensity when compared to CK2.3 stimulated cells. (b) Lysates were also collected from extracted osteoblasts from OP patients and run on an SDS-Page gel to separate the proteins. The separated proteins were then transferred onto an immunoblot and pERK and β-actin protein levels were detected. Expression was detected through densiometric analysis using ImageJ. CK2.3 significantly increased expression of pERK when compared with US and BMP2 stimulated cells. Error bars represent standard error of the mean (SEM). “a” denotes statistically significant to US, “b” denotes statistically significant to BMP2 stimulated cells, and “c” denotes statistically significant to CK2.3 stimulated cells (p < 0.05).
2.2. SMAD Expression Remains Unchanged in OP Patients
Since ERK signaling was disrupted in OP patients and is part of the SMAD independent signaling pathway, SMAD dependent signaling was also investigated. Canonical SMAD signaling or SMAD dependent signaling is the most studied BMP signaling pathway. Patient cells were stimulated with BMP2, CK2.3, or left US for five days. After the fifth day, cells were immunofluorescently labeled for pSMAD (green) and the nucleus (blue), Figure 2a. While BMP2 stimulation seemed to decrease pSMAD (activated SMAD) expression, it was not significant. These results were again confirmed through a Western blot. The patient cells lysates were prepared as outlined above in Section 2.1. Again, pSMAD expression did not significantly change under all stimulations, Figure 2b. This indicates that the BMP signaling disparity was not observed within the SMAD dependent pathway.
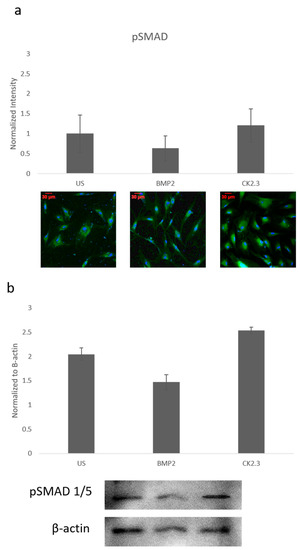
Figure 2. Mature osteoblasts were extracted from OP patients and stimulated with BMP2, CK2.3 or were left US for five days. On the fifth day, cells were fixed and fluorescently stained for pSMAD (green) and the nucleus (blue). (a) pSMAD fluorescent intensity remains unchanged under all stimulations, while BMP2 stimulation indicates a slight decrease in expression, this was not significant. (b) Lysates were also collected from extract osteoblasts from OP patients and run on an SDS-Page gel to separate the proteins. The separated proteins were then transferred onto an immunoblot and pSMAD and β-actin protein levels were detected. Expression was detected through densiometric analysis. BMP2 stimulation seems to decrease pSMAD expression, but this difference was not significant. Error bars represent standard error of the mean (SEM). (p < 0.05).
2.3. Trabecular Bone Explants as a Viable Bone Model
We wanted to further explore how the native bone tissue itself reacted to stimulations with BMP2 and CK2.3. Therefore, we utilized an explant model to observe these effects. Explant models are beneficial models because they utilize the organ of interest, allowing for investigation of the stimulations or treatments used. To prepare our samples for an explant study, the femoral heads from both control and OP patients were cut down the midsagittal plane and the area of interest is indicated in Figure 3a. Bone fragments were then fixed and stained for Calcein red-orange and Hoescht in order to determine efficacy and viability of the cells within the bone, as well as the bone explant model, Figure 3c. Calcein stains viable cells, while Hoescht is a nuclear stain that stains both live and dead cells. The bone fragments were imaged using confocal microscopy and the percent viability of the cells were determined. In both control and OP bone fragments, in all stimulations, cell viability was over 80%. This shows the efficacy of the trabecular bone model.
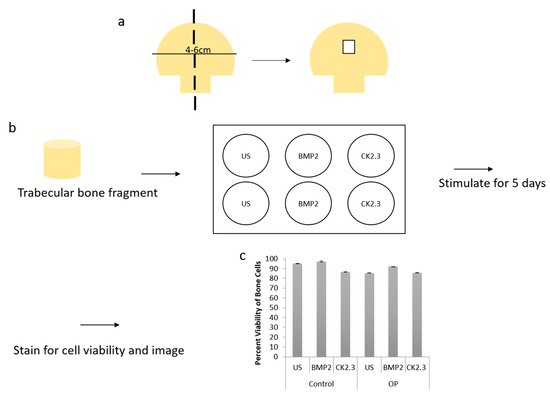
Figure 3. (a) A schematic representing how femoral heads were sliced down the midsagittal plane, and what region of interest was used for both the methyl methacrylate (MMA) experiments and the explant experiments. (b) Diagram showing the explant experimental set up. The trabecular bone fragment was removed from the femoral head, washed with PBS incubated with antibiotics/antimycotics for 10 min. The fragments were placed in a six well plate (one fragment per well) with DMEM. They were stimulated as designated for five days, following which they were either stained for cell viability and imaged or they were fixed with 4.4% PFA, immunofluorescently stained and then imaged. (c) Cell viability was assessed through a Calcein and Hoescht stain, and viable cells were counted. Under all stimulations and conditions cells were 80% or more viable within the explants. Error bars represent standard error of the mean (SEM).
2.4. BMP2 Stimulation Decreases OC and ALP Expression in OP Patients Bone Explants When Compared to Control Patients
After the creation of a viable explant model, we wanted to further validate its effectiveness. Previously, we showed that primary osteoblasts isolated from OP patients led to decreased expression of the osteoblast specific markers, namely OC and ALP, when stimulated with BMP2 [15]. Here, we conducted the same study as described by Weidner et al., except we used the explant model and included control patients as a comparison. The explants were stimulated with BMP2, CK2.3, or left US for five days. After the fifth day, the explants were fixed in 4.4% PFA and immunofluorescently labeled for OC (green) and ALP (red), Figure 4a,c. Representative images can be seen in Figure 4b,d, respectively. Again, BMP2 stimulation significantly decreased expression of both OC and ALP in OP patients. However, CK2.3 significantly increased expression when compared to both BMP2 and US. Interestingly, both BMP2 and CK2.3 significantly increased expression of OC and ALP in control patients when compared to US. This shows the validity of the trabecular explant model.
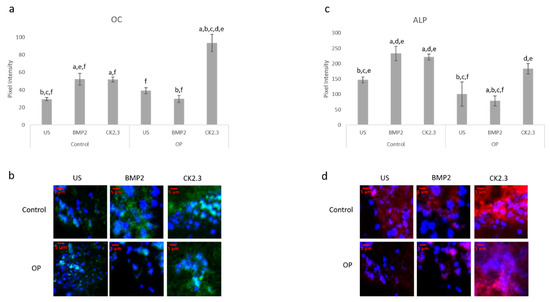
Figure 4. Explants from OP and control patients were prepared as previously described and stimulated with BMP2, CK2.3, or left US. After the fifth day the explants were fixed and stained for OC (green), ALP (red), and the nucleus (blue). (a) Control and OP explants stimulated with CK2.3 significantly increased expression of OC when compared to US and BMP2 stimulation. OP explants stimulated with BMP2 significantly decreased expression of OC. (b) Representative 2D images depicting the nuclear stain overlayed with the OC stain. (c) Both control and OP explants stimulated with CK2.3 significantly increased expression of ALP when compared to control and BMP2 stimulation. BMP2 stimulation significantly decreased ALP expression in both control and OP explants. (d) Representative 2D images depicting the nuclear stain overlaid with the ALP stain. Error bars represent standard error of the mean (SEM). “a” denotes statistically significant to control US explants, “b” denotes statistically significant to control BMP2 stimulated explants, “c” denotes statistically significant to control CK2.3 stimulated explants, “d” denotes statistically significant to OP US explants, “e” denotes statistically significant to OP BMP2 stimulated explants, and “f” denotes statistically significant to OP CK2.3 stimulated explants (p < 0.05).
2.5. Increased Basal Levels of BMPRIa and CK2α Expression in OP Patients
Human femoral heads were isolated from female patients diagnosed with OP, as well as control. The specimens were preserved in 10% Nuetral Buffered Formalin (NBF) solution within 48 h of extraction. The samples were then cut down the midsagittal plane, and a 2 mm bone fragment was removed and embedded in MMA to protect the integrity of the bone microenvironment. Other embedded methods, such as paraffin embedding, decalcify the bone before embedding, which remove meaningful and important parameters when investigating skeletal based diseases such as OP. The embedded bone fragments were stained for BMPRIa and CK2α, and increased expression levels of both proteins were observed in the OP specimens, Figure 5. Control specimens did have expression of both BMPRIa and CK2α, however, OP patients demonstrated significantly increased expression of both proteins. This further indicates a signaling disparity within the BMP pathway that needs to be investigated.
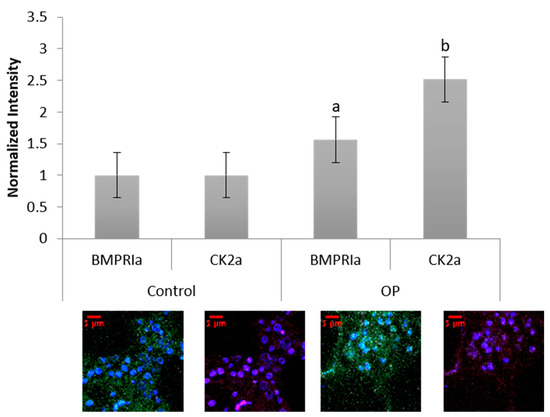
Figure 5. Female OP and OA (control) trabecular bone slices were embedded in MMA and fluorescently stained for BMPRIa (green), CK2α (red), and the nucleus (blue). OP BMPRIa and CK2α expression was significantly higher than the expression levels in control bone slices. Error bars represent standard error of the mean (SEM). “a” denotes statistically significant to control BMPRIa levels, “b” denotes statistically significant control CK2α levels (p < 0.05).
2.6. BMP2 Stimulation Decreases BMPRIa and CK2α Expression in OP Patients Bone Explants
The bone explant model was utilized to study BMPRIa and CK2α expression after BMP2 and CK2.3 stimulation. Femoral heads from both control and OP samples were used and after the fifth day of stimulation, once fixed, the samples were labeled immunofluorescently for BMPRIa (green), Figure 6a,b, and CK2α (red), Figure 6c,d. Representative images can be seen below each figure. In control samples, there was a significant increase in BMPRIa and CK2α after both BMP2 and CK2.3 expression when compared to US. In OP samples, there was a significant decrease in BMPRIa and CK2α expression when compared to US and CK2.3 stimulated samples. This mimicked the response observed in the MMA trabecular bone slices, Figure 3.
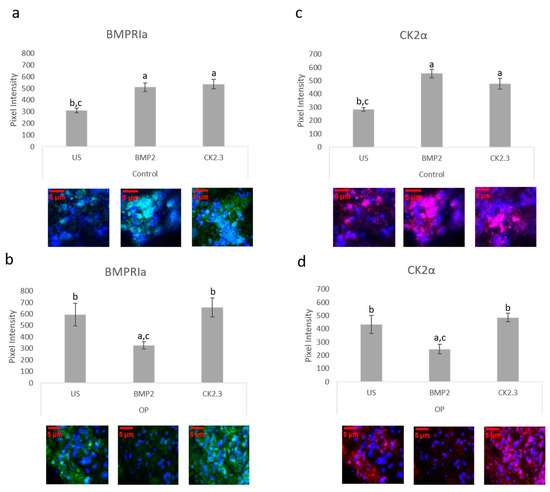
Figure 6. Trabecular bone slices were removed from isolated femoral heads. OP and control explants were prepared as previously described. Fixed explants were stained fluorescently for BMPRIa (green), CK2α (red), and the nucleus (blue). (a) In control explants CK2.3 and BMP2 significantly increased BMPRIa expression when compared to US explants. (b) In OP explants, BMP2 significantly decreased BMPRIa expression when compared to CK2.3 and US explants. (c) In control explants, BMP2 and CK2.3 significantly increased expression of CK2α when compared to US explants. (d) In OP explants, BMP2 stimulation significantly decreased expression of CK2α when compared to US and CK2.3 stimulated explants. Error bars represent standard error of the mean (SEM). “a” denotes statistically significant to US explants, “b” denotes statistically significant to BMP2 stimulated explants, and “c” denotes statistically significant to CK2.3 stimulated explants (p < 0.05).
2.7. BMPRIa and CK2α Levels in Osteoblasts from OP Patients
BMPRIa and CK2α expression levels were further validated in an in vitro model. Mature osteoblasts were isolated from OP patients as previously described. Cells were plated and stimulated with BMP2, CK2.3, or left US. After five days, the cells were fixed and stained for BMPRIa (green), CK2α (red), and nucleus (blue). There was a significant increase in BMPRIa and CK2α expression in CK2.3 stimulated cells when compared to US and BMP2 stimulation, Figure 7a,b. This mimicked the responses we had seen in both MMA embedded bone and the explant models. Finally, RNA was isolated from the cells and gene levels of BMPRIa were detected through RT-PCR, Figure 7c. This further indicates a potentially BMP2 induced signaling disruption in OP as it mimics the responses seen in the MMA trabecular bone slices (Figure 5) and the bone explants (Figure 6).
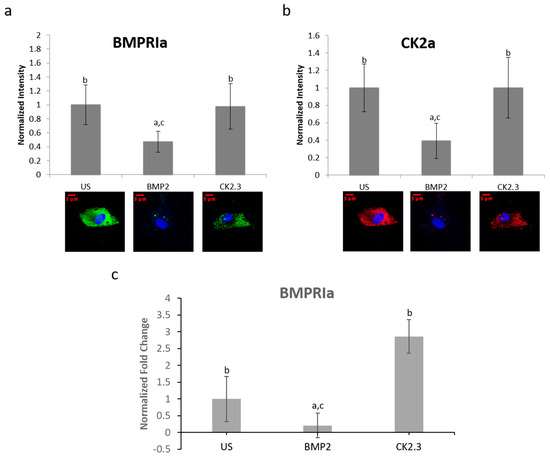
Figure 7. Osteoblasts extracted from OP patients were stimulated with BMP2, CK2.3, or left US for five days. After the fifth day, the cells were fixed and stained for BMPRIa (green), CK2α (red), and the nucleus (blue). (a) CK2.3 and US cells significantly increased expression of BMPRIa when compared to BMP2 stimulation. (b) BMP2 stimulation significantly decreased expression of CK2α when compared to CK2.3 and US cells. (c) RNA was extracted from OP patients’ osteoblasts after they were stimulated with BMP2, CK2.3, or left US for five days. BMP2 significantly decreased BMPRIa gene expression when compared to US and CK2.3 stimulated cells. Error bars represent standard error of the mean (SEM). “a” denotes statistically significant to US, “b” denotes statistically significant to BMP2, and “c” denotes statistically significant to CK2.3 (p < 0.05).
2.8. Proposed Mechanisms for BMP2 and CK2.3
In congruence with previous findings, the following mechanisms are proposed for BMP signaling in patients diagnosed with OP. As seen in Figure 8a, when the extracted cells from OP patients are stimulated with BMP2, they are unresponsive in their osteogenic response [23]. They have significantly decreased ERK and SMAD activation, in addition to significantly decreased immunofluorescent expression of BMPRIa, and CK2α. Where the discrepancy within the BMP pathway lies needs to be further investigated. Consequently, CK2.3 does induce mineralization in cells extracted from OP patients [23]. CK2.3 has been shown to activate SMAD and ERK signaling in C2C12 cells lines [22], and now has been shown to increase ERK activation in cells extracted from patients diagnosed with OP, Figure 8b.
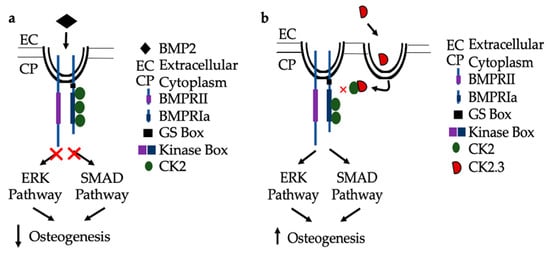
Figure 8. Proposed mechanism of BMP2 (a) and CK2.3 (b) signaling in POP primary osteoblasts. (a) Upon treatment with BMP2, POP primary osteoblasts are unresponsive and the downstream signaling pathways, ERK and SMAD, are not activated and osteogenesis is decreased. (b) When stimulated with CK2.3, this peptide is up-taken by POP primary osteoblasts and subsequently, the ERK and SMAD signaling pathways are activated independently of BMP2, which increases osteogenesis.
This entry is adapted from the peer-reviewed paper 10.3390/ijms21186909
References
- K.N. Inc. Case Medical Research FDA approves new treatment for osteoporosis in postmenopausal women at high risk of fracture. Case Med. Res. 2019. [Google Scholar] [CrossRef]
- Florencio-Silva, R.; Sasso, G.R.D.S.; Sasso-Cerri, E.; Simões, M.D.J.; Cerri, P.S. Biology of Bone Tissue: Structure, Function, and Factors That Influence Bone Cells. BioMed Res. Int. 2015, 2015, 421746. [Google Scholar] [CrossRef]
- Jensen, E.D.; Pham, L.; Jr, C.J.B.; Espe, K.; Carlson, A.E.; Westendorf, J.J.; Petryk, A.; Gopalakrishnan, R.; Mansky, K.C. Bone morphogenic protein 2 directly enhances differentiation of murine osteoclast precursors. J. Cell. Biochem. 2009, 109, 672–682. [Google Scholar] [CrossRef]
- Lowery, J.W.; Pazin, D.; Intini, G.; Kokabu, S.; Chappuis, V.; Capelo, L.P.; Rosen, V. The role of BMP2 signaling in the skeleton. Crit. Rev. Eukaryot. Gene Expr. 2011, 21, 177–185. [Google Scholar] [CrossRef]
- James, A.W.; Lachaud, G.; Shen, J.; Asatrian, G.; Nguyen, V.; Zhang, X.; Ting, K.; Soo, C. A Review of the Clinical Side Effects of Bone Morphogenetic Protein-2. Tissue Eng. Part B Rev. 2016, 22, 284–297.
- Jensen, E.D.; Pham, L.; Jr, C.J.B.; Espe, K.; Carlson, A.E.; Westendorf, J.J.; Petryk, A.; Gopalakrishnan, R.; Mansky, K.C. Bone morphogenic protein 2 directly enhances differentiation of murine osteoclast precursors. J. Cell. Biochem. 2009, 109, 672–682.
- Facts and Statistics | International Osteoporosis Foundation. Available online: https://www.iofbonehealth.org/facts-statistics (accessed on 23 March 2020).
- Office of the Surgeon General (US). Bone Health and Osteoporosis. 2004. Available online: https://www.ncbi.nlm.nih.gov/books/NBK45513/ (accessed on 23 March 2020).
- PubMed Homepage. Available online: http://www.ncbi.nlm.nih.gov/pubmed/ (accessed on 2 March 2012).
- Tu, K.N.; Lie, J.D.; Wan, C.K.V.; Cameron, M.; Austel, A.G.; Nguyen, J.K.; Van, K.; Hyun, D. Osteoporosis: A Review of Treatment Options. Pharm. Ther. 2018, 43, 92–104. [Google Scholar]
- Chavassieux, P.; Chapurlat, R.; Portero-Muzy, N.; Roux, J.-P.; Garcia, P.; Brown, J.P.; Libanati, C.; Boyce, R.W.; Wang, A.; Grauer, A. Bone-Forming and Antiresorptive Effects of Romosozumab in Postmenopausal Women with Osteoporosis: Bone Histomorphometry and Microcomputed Tomography Analysis after 2 and 12 Months of Treatment. J. Bone Miner. Res. 2019, 34, 1597–1608. [Google Scholar] [CrossRef] [PubMed]
- Bandeira, L.; Lewiecki, E.M.; Bilezikian, J.P. Romosozumab for the treatment of osteoporosis. Expert Opin. Boil. Ther. 2017, 17, 255–263. [Google Scholar] [CrossRef] [PubMed]
- Donoso, O.; Pino, A.M.; Seitz, G.; Osses, N.; Rodriguez, J.P. Osteoporosis-associated alteration in the signalling status of BMP-2 in human MSCs under adipogenic conditions. J. Cell. Biochem. 2015, 116, 1267–1277. [Google Scholar] [CrossRef]
- Liu, D.B.; Sui, C.; Wu, T.T.; Wu, L.Z.; Zhu, Y.Y.; Ren, Z.H. Association of Bone Morphogenetic Protein (BMP)/Smad Signaling Pathway with Fracture Healing and Osteogenic Ability in Senile Osteoporotic Fracture in Humans and Rats. Med. Sci. Monit. 2018, 24, 4363–4371. [Google Scholar] [CrossRef]
- Weidner, H.; Gao, V.Y.; Dibert, D.; McTague, S.; Eskander, M.; Duncan, R.; Wang, L.; Nohe, A. CK2.3, a Mimetic Peptide of the BMP Type I Receptor, Increases Activity in Osteoblasts over BMP2. Int. J. Mol. Sci. 2019, 20, 5877. [Google Scholar] [CrossRef] [PubMed]
- Bragdon, B.; Thinakaran, S.; Moseychuk, O.; King, D.; Young, K.; Litchfield, D.W.; Petersen, N.O.; Nohe, A. Casein Kinase 2 β-Subunit Is a Regulator of Bone Morphogenetic Protein 2 Signaling. Biophys. J. 2010, 99, 897–904. [Google Scholar] [CrossRef] [PubMed]
- Bragdon, B.; Moseychuk, O.; Saldanha, S.; King, D.; Julian, J.; Nohe, A. Bone Morphogenetic Proteins: A critical review. Cell Signal. 2011, 23, 609–620.
- Bragdon, B.; Moseychuk, O.; Saldanha, S.; King, D.; Julian, J.; Nohe, A. Bone Morphogenetic Proteins: A critical review. Cell Signal. 2011, 23, 609–620.
