The recent advances in lung ultrasound for the diagnosis of cardiogenic pulmonary edema are outstanding; however, the mechanism of vertical artifacts known as B-lines used for the diagnosis has not yet been fully elucidated. The theory of “acoustic trap” is useful when considering the
generation of vertical artifacts. Basic research in several studies supports the theory. Published studies with pilot experiments indicate that clarification of the relationship between the length and intensity of vertical artifacts and physical or acoustic composition of sources may be useful for differentiating cardiogenic pulmonary edema from lung diseases. There is no international consensus with regard to the optimal settings of ultrasound machines even though their contribution to the configuration of vertical artifacts is evident. In the clinical setting, the configuration is detrimentally affected by the use of spatial compound imaging, the placement of the focal point at a deep level, and the use of multiple focus. Simple educational materials using a glass microscope slide also show the non-negligible impact of the ultrasound machine settings on the morphology of vertical artifacts.
1. Introduction
In lung ultrasound, the presence and severity of pulmonary edema are evaluated with vertical artifacts known as B-lines. In an international consensus statement published in 2012, B-lines were defined as discrete, laser-like vertical hyperechoic artifacts that arise from the pleural line and extend to the bottom of the screen without fading [
1]. The term “multiple B-lines” refers to the presence of three or more B-lines in a longitudinal plane between two ribs. In patients with cardiogenic pulmonary edema, multiple B-lines are usually distributed bilaterally and diffusely [
1,
2]. Lung ultrasound can also drastically contribute to reducing the time spent on the diagnosis [
5]. In addition, the number and spatial extent of B-lines allow the assessment of the severity of pulmonary edema or a semi-quantitative estimation of extravascular lung water [
6].
2. Generation of Vertical Artifacts
2.1. Clinical Implications
Chest CT is not a standard imaging modality to diagnose cardiogenic pulmonary edema; however, it is very useful for grasping the distribution of edema in the lung tissue. The findings of interstitial pulmonary edema are ground-glass opacities and interlobular septal and bronchovascular thickening. Alveolar edema appears as airspace consolidation, in addition to the above findings [
11,
12].
Lichtenstein et al. compared ultrasound images with CT images and indicated that B-lines originate from the thickening of the sub-pleural interlobular septa and ground-glass opacities [
13]. Many researchers then reported the association of cardiogenic pulmonary edema and lung diseases with B-lines in their observational studies. Now, B-lines are thought to be generated when the air content decreases and lung density increases due to transudate, exudate, blood, collagen, or hyper-cellularity in the subpleural space [
14].
2.2. The Theory of Acoustic Trap
An acoustic trap corresponds to a small volume of fluid in cardiogenic pulmonary edema, inflammatory changes in pulmonary diseases, surrounded by aerated alveoli with an acoustic channel on top of the trap at the pleural line. Once an ultrasound beam enters the trap through the channels, it is trapped and reflected by the wall of aerated alveoli multiple times with scattering. The reflection and scattering phenomena act as successive ultrasound sources, with the trapped energy radiated to the transducer little by little. With a larger channel, the ultrasound energy can escape more easily, and opportunities for reflection consequently decrease [
7,
16].
3. Influence of Machine Settings and the Selection of Transducers on Vertical Artifacts
3.1. Spatial Compound Imaging
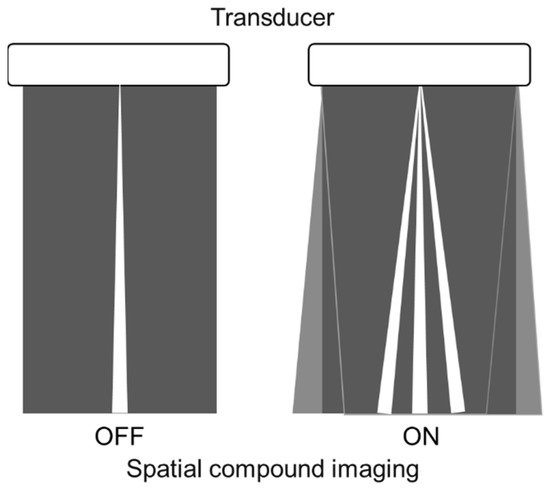
Spatial compound imaging is now available on most ultrasound machines. The main purposes are to improve contrast resolution and to reduce acoustic shadowing. This method acquires three or more multiple images by multiple transmission with different angles, and creates averaging images by overlaying them incoherently [
22] (
Figure 2). When a linear probe is used with spatial compound imaging enabled, a single B-line changes to multiple lines starting from the same depth of the pleural line [
8] (
Figure 3 and
Figure 4). This is because the vertical artifact generates associated with the scan line. Thus, the vertex of the multiple lines is considered to be a point of the acoustic trap. The angle made by the lines depends on the machine settings. These multiple lines appear to overlap each other with convex probes in some ultrasound machines. In such cases, the resulting “single” line features a divergent appearance with increasing depth [
23] (
Figure 5).
Figure 2. Spatial compound imaging is a method wherein sonographic information is obtained from several different insonation angles and combined to produce a single image.
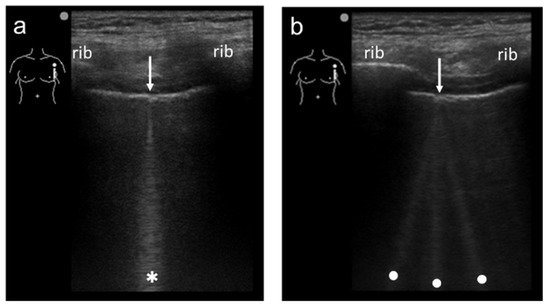
Figure 3. Ultrasound images obtained by MicroMaxx scanner (SonoSite) with a linear transducer without (a) and with spatial compound imaging (b). A focal point was set as default by the manufacturer, and it is not shown on the screen. With spatial compound imaging enabled, single B-line (asterisk) changes to multiple lines (dots) radiating from the same point (arrows) on the pleural line.
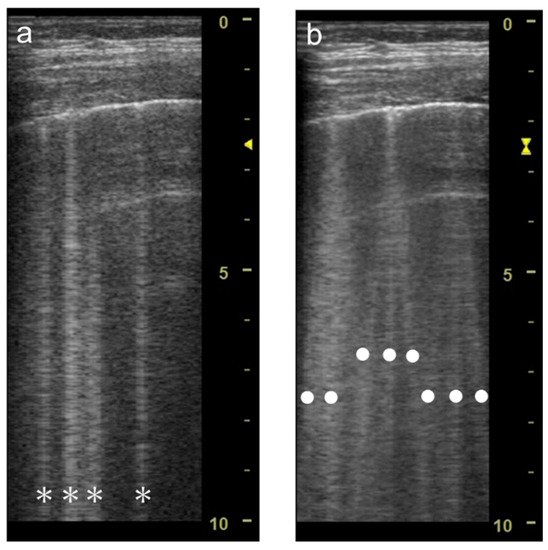
Figure 4. Ultrasound images obtained by LOGIQ V scanner (GE Healthcare) with a linear transducer without (a) and with spatial compound imaging (b) in cardiogenic pulmonary edema. With spatial compound imaging enabled, each single B-line (asterisks) changes to multiple lines (dots) radiating from the same point on the pleural line.
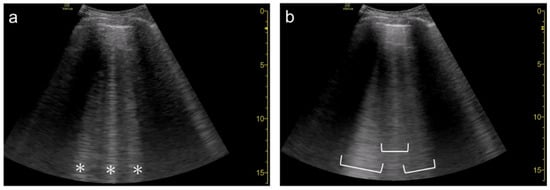
Figure 5. Ultrasound images obtained by Venue scanner (GE Healthcare) with a curvilinear transducer without (a) and with spatial compound imaging (b) in pulmonary edema. With spatial compound imaging enabled, each B-line (asterisks) becomes divergent with increasing depth, indicating the overlap of multiple lines.
Many ultrasound machines are now equipped with spatial compound imaging for several applications (e.g., abdominal, breast, thyroid, or vascular ultrasound). If one of the presets for these applications is accidentally selected for the evaluation of B-lines, they may be erroneously counted. To avoid misinterpretation, spatial compound imaging should be set to “off” [
8,
19,
21], or the preset for the lung ultrasound should be selected in advance.
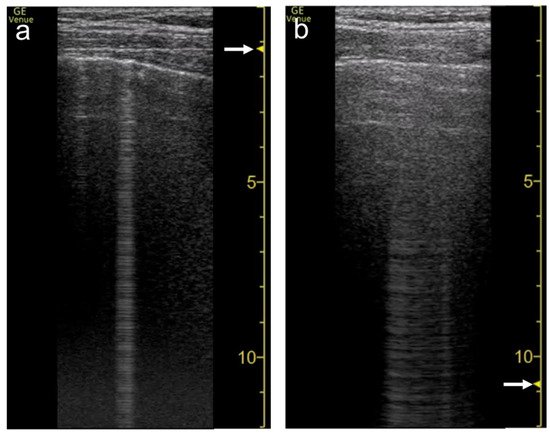
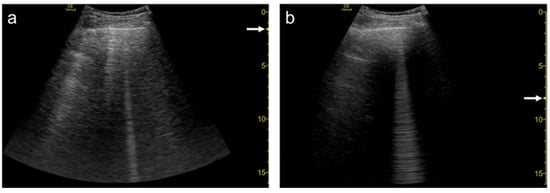
3.2. Focal Point
The focal point can also affect the quantification of B-lines. As the single focal point is shifted from the level of the pleural line to deeper levels, the dispersion of B-lines becomes wider during multiple reflections [
8] (
Figure 6 and
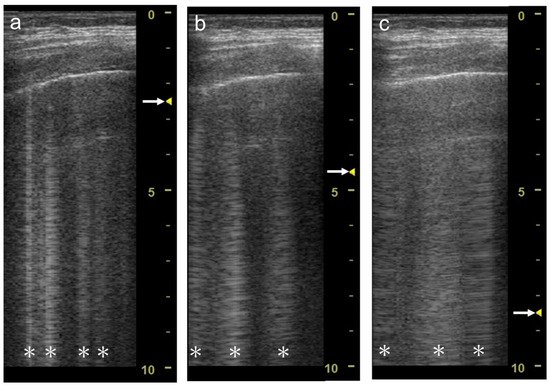
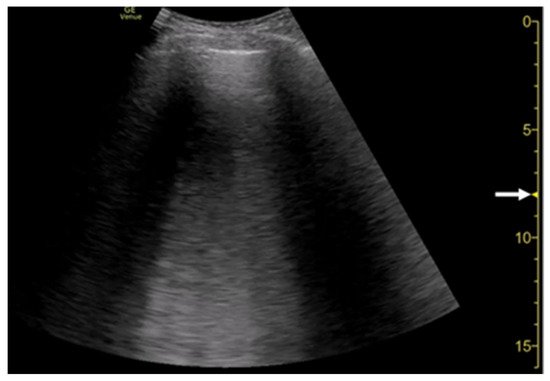
Figure 7). As the focal point is shifted to deeper levels, multiple B-lines become wider and can finally overlap each other (
Figure 8 and
Figure 9). With focused ultrasound, transmission pulse at the focal point hits a small area, whereas the beam width becomes wider in the de-focused area. That means B-lines can be emphasized if the focal point is set to the same depth of the pleural line [
16].
Figure 6. Ultrasound images obtained by Venue scanner (GE Healthcare) with a linear transducer. The B-line becomes wider as the single focal point (arrow) is shifted from the same level as the pleural line (a) to a deep level (b).
Figure 7. Ultrasound images obtained by Venue scanner (GE Healthcare) with a curvilinear transducer. The B-line becomes wider as the single focal point (arrow) is shifted from the same level as the pleural line (a) to a deeper level (b).
Figure 8. Ultrasound images obtained by LOGIQ V scanner (GE Healthcare) with a linear transducer in cardiogenic pulmonary edema. As the single focal point (arrow) is shifted from a level near the pleural line (a) to deeper levels, each B-line becomes wider (b), with the B-lines finally overlapping each other (c). Asterisks indicate B-lines.
Figure 9. Ultrasound image obtained by Venue scanner (GE Healthcare) with a curvilinear transducer in the same case as Figure 5. As the single focal point (arrow) is shifted to a deeper level, each B-line becomes wider and overlaps each other.
In daily practice, confluent B-lines are often observed in cardiogenic pulmonary edema. The confluent B-lines are also called white lung pattern, especially when they cover the intercostal space [
24]. However, at present, the confluent B-lines are not precisely defined in the consensus definitions [
25]. For consensus, it is recommended that focal point be set at or near the level of the pleural line to ensure “confluence” and accurate quantification or semi-quantification of B-lines [
8,
9,
19,
21].
3.3. Frequency
Recent in vitro and in vivo studies have revealed the effect of the frequency on vertical artifacts. Demi et al. [
27] and Mento et al. [
28] conducted in vitro studies using lung-mimicking phantoms with a multifrequency approach, illustrating how the visualization of vertical artifacts depends on frequency and how native frequency correlates with the geometric characteristic of a bubbly structure.
3.4. Selection of Transducers
B-lines are detectable using sector, curvilinear, or linear transducers with low to high central frequencies [
1,
6]. In sector and curvilinear transducers, multiple B-lines spread radially, whereas in linear probes, multiple B-lines run in parallel (
Figure 10).
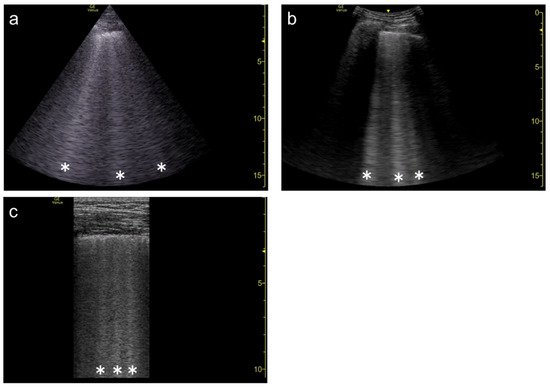
Figure 10. Ultrasound images obtained with Venue scanner (GE Healthcare) with a sector (a), curvilinear (b), and linear (c) transducers in cardiogenic pulmonary edema. Asterisks indicate B-lines.
3.5. Simple Educational Materials
A more simplified experimental model is useful for the educational purpose. A motionless stable vertical artifact is easily generated by the model using a glass microscopic plate, which is easily obtainable in each medical facility. We herein demonstrate simple educational materials that help users understand the influence of machine settings on the configuration of vertical artifacts [
34]. A diagnostic ultrasound scanner (LOGIQ S8, GE Healthcare) with 9 MHz linear transducer (9L-D) and 3.5 MHz curvilinear transducer (C1-5-D) is used in this demonstration. Fundamental B-mode with 5.0 MHz (linear) and 4.0 MHz (curvilinear) is used. The overall gain and dynamic range are 60 and 72, respectively. TGC is flat as used in clinical examinations.
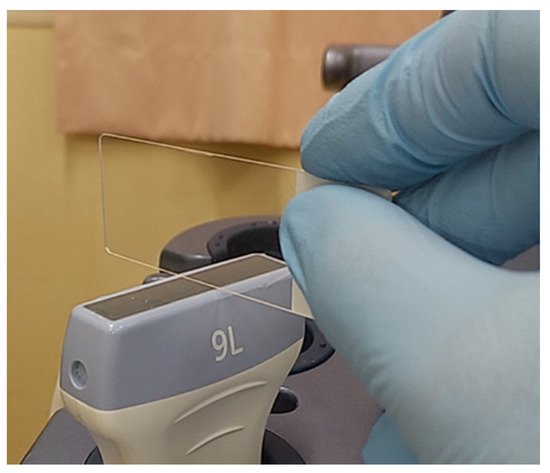
As the preset, spatial compound imaging is turned off and the focal zone is set at the shallowest level. A glass microscope slide of 1 mm in thickness (impedance, 12.7 × 10⁶ Pa s/m) is placed perpendicularly on the footprints with a thin layer of ultrasound gel. The thickness of the slide is made parallel to the scan direction (Figure 11). A single clear vertical artifact with a dense cascade of horizontal lines is shown with both linear and curvilinear transducers, while the width of the artifact is wider with the convex transducer than with the linear transducer.
Figure 11. Simple educational materials that help provide an understanding of the influence of machine settings on the configuration of vertical artifacts. A glass microscope slide is placed perpendicularly on the footprint of a linear transducer with a thin layer of ultrasound gel.
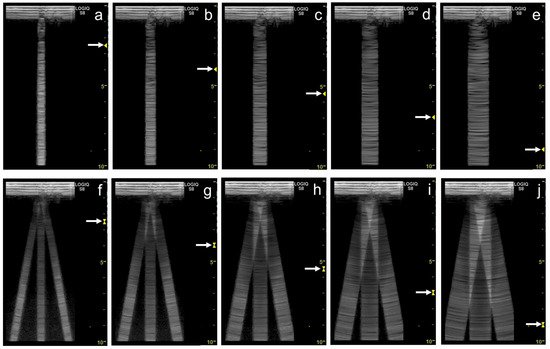
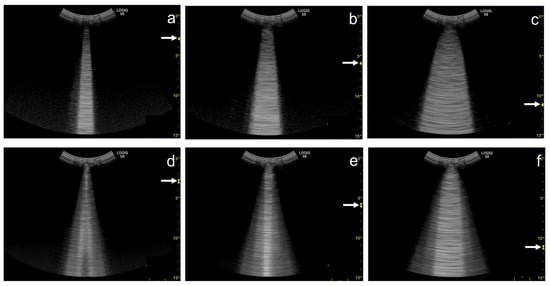
As the focal zone is moved from the shallowest level to the deeper levels, the vertical artifact becomes wider with both linear and convex transducers (Figure 12a–e and Figure 13a–c).
Figure 12. Ultrasound images obtained with the. linear transducer. The vertical artifact becomes wider as the focal point (arrow) is moved to deeper levels (a–e). When spatial compound imaging is enabled, the single vertical artifact changes to three lines radiating from the same point (a,f). The three lines become wider as the focal point (arrow) is moved to deeper levels (f–j).
Figure 13. Ultrasound images obtained with the curvilinear transducer. The vertical artifact becomes wider as the focal point (arrow) is moved to deeper levels (a–c). When spatial compound imaging is enabled, three lines appear to overlap each other (a,d). The three lines become wider as the focal point (arrow) is moved to deeper levels (d–f).
When the linear transducer is used with spatial compound imaging enabled, the single vertical artifact changes to three lines radiating from the same point (Figure 12a,f). The three lines become wider as the focal zone is moved to deeper levels (Figure 12 f–j). When the curvilinear transducer is used with spatial compound imaging enabled, the three individual lines appear to overlap each other (Figure 13a,d). These lines become wider as the focal zone is moved to deeper levels (Figure 13d–f).
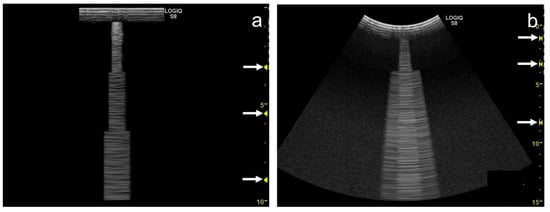
Some ultrasound scanners have “multiple focus” in B-mode. It transmits ultrasound pulses in the same direction with a different focal depth, synthesizing these scan-line data (mostly applying focal areas) into one scan line image. As a result, the synthesized image has higher spatial resolution due to the multiple focal points. However, this method causes a “patchy” step-wise configuration in the vertical artifact (Figure 14a,b).
Figure 14. Ultrasound images obtained by a linear transducer (a) and a curvilinear transducer (b) with multiple focus (arrows), which causes step-wise configuration in a vertical artifact.
This entry is adapted from the peer-reviewed paper 10.3390/diagnostics12020252