Solid state nuclear magnetic resonance (ssNMR) is a powerful and attractive characterization method for obtaining insights into the chemical structure and dynamics of a wide range of materials. Current interest in cellulose-based materials, as sustainable and renewable natural polymer products, requires deep investigation and analysis of the chemical structure, molecular packing, end chain motion, functional modification, and solvent–matrix interactions, which strongly dictate the final product properties and tailor their end applications. In comparison to other spectroscopic techniques, on an atomic level, ssNMR is considered more advanced, especially in the structural analysis of cellulose-based materials
1. Introduction
Cellulose is among the most renewable, abundant, and ubiquitous biopolymer/biomass available in nature
[1][2][3][4][5][6][7][8][9][10][11], as it constitutes one of the major components of the cell walls in green plants and is responsible for mechanical strength enhancement
[3][4][5]. This polysaccharide was discovered by the French chemist Anselme Payen in 1838 via isolation from plant matter and has the formula (C6H10O5)n, where n represents the degree of polymerization
[12]. It consists of linear polymer chains that are composed of several hundred to many thousands of β(1→4) linked D-glucose units
[13].
Cellulose structure is peculiar, in that it has a d-glucose unit at one end, a C4-OH group as the reducing end, and a C1-OH as terminating group. Some celluloses contain extra carbonyl and carboxyl groups, such as bleached wood pulp
[4]. The cellulose present in plants is usually found in and amongst a mixture of hemicellulose, lignin, pectin, and other substances. The unique molecular structure of cellulose gives it interesting properties, such as chirality, hydrophilicity, degradability, and high reactivity, due to the presence of the donor, OH group
[7][8][10]. As a result of the strong hydrogen bonds present in cellulose, those materials exhibit crystalline fiber structures
[4]. More interestingly, and contrary to other polysaccharides, cellulose can retain a semi-crystalline state of aggregation in aqueous environments
[14][15]. From a microstructure perspective, cellulose consists of fibrils with crystalline and amorphous domains
[4].
Cellulose and its derivatives have numerous applications, but cellulose itself is most commonly used in the paper and pulp industry. It is also a major component present in natural fibers
[16]. Important applications of cellulose include the production of biofuel
[17], viscous fibers
[18], and use as a thickening agent in the food industry
[19]. Alternative applications of cellulose include, but are not limited to, tissue engineering
[15][20], drug delivery
[21][22], nanoadsorbents for proteins
[9], wastewater treatment
[23], sensor technology
[10], and biomedical applications
[24].
2. Cellulose Structure Investigated via Solid State NMR Spectroscopy
After decades of research on cellulose-based nature materials using different diffraction and spectroscopy techniques, the exact structure of cellulose in natural products is still not fully understood. One of the most useful approaches for the analysis of the cellulose structure on an atomic level is using solid state NMR spectroscopy with 1D 13C CP MAS and 2D 13C INADEQUATE (Incredible Natural Abundance Double Quantum Transfer Experiment) techniques, due to their sensitivity to chemically equivalent nuclei in magnetically non-equivalent environments (crystalline and amorphous cellulose showing different chemical shifts).
2.1. Pure Cellulose with 13C CP MAS and Different Crystal Phases
Different cellulose materials obtained from pulp (cellulose I) [25][26][27], regenerated cellulose fibers (cellulose II) [28], cellulose-based shells [29], and bacterial cellulose [30][31] were characterized by 13C CP/MAS solid state NMR [32]. The 13C CP MAS NMR spectrum was extended over a chemical shift from 57 to 108 ppm and divided into four separate regions, resolved to a different extent, including less resolved regions C6 (57–67 ppm), C1 (102–108 ppm) and C2,3,5 in the cellulosic ring (70–80 ppm), and well resolved region C4 (80–92 ppm) [33]. Ultra-structural information regarding crystallinity could be extracted from the C4 peak in the isolated cellulose spectrum, which is resolved into one crystalline and another amorphous region. When spectral deconvolution was applied to the C4 region of untreated sugarcane bagasse, several signals were recorded that were a sum of four signals and were assigned to the crystalline region possessing narrow fitting and sharpness, corresponding to α (90 ppm), β (86 ppm), a mixture of α + β cellulose (89 ppm) crystal structures and paracrystalline cellulose (88 ppm). To the right, the signal for inaccessible fibril surface appears at (83 ppm) and two other signals (84 and 82 ppm) are assigned to accessible fibril surface [33]. The cellulose amorphous region consists of two characteristic doublets at 84 and 85 ppm, corresponding to the accessible fibril surface and identified as located on top of the two different crystal planes, with a broad signal for deeply located inaccessible fibril surface at round 85.4 ppm [34]. The spatial distribution of the cellulose morphologies within the cellulose microfibril suggests a core-shell structure, consisting of an outer amorphous shell composed mainly of accessible cellulose microfibril surfaces [35].
2.2. Cellulose Polymorphism in Plant Primary Cell Walls
Wang et al.
[36] managed to explain cellulose polymorphism in plant primary cell walls in different plants, including Arabidopsis, Brachypodium, and Zea Mays. Using the data generated by the
13C NMR spectra of these plants, a better picture of such polymorphism was shown.
Another way to visualize cellulose polymorphism in plant cell walls is by using the 2D 13C-13C INADEQUATE spectrum to collect spectrograms of unlabeled stems of wild-type rice using the DNP system. At first, this 2D experiment was considered impossible to achieve, because there is a low natural abundance of 13C (1.1%) and a lower probability of detecting a cross peak between two carbons. However, now this experiment can be completed using DNP system within 35 h [37].
3. Lignocellulosic Biomass Structure Interpretation
Lignin is located close to cell wall polysaccharides in structure
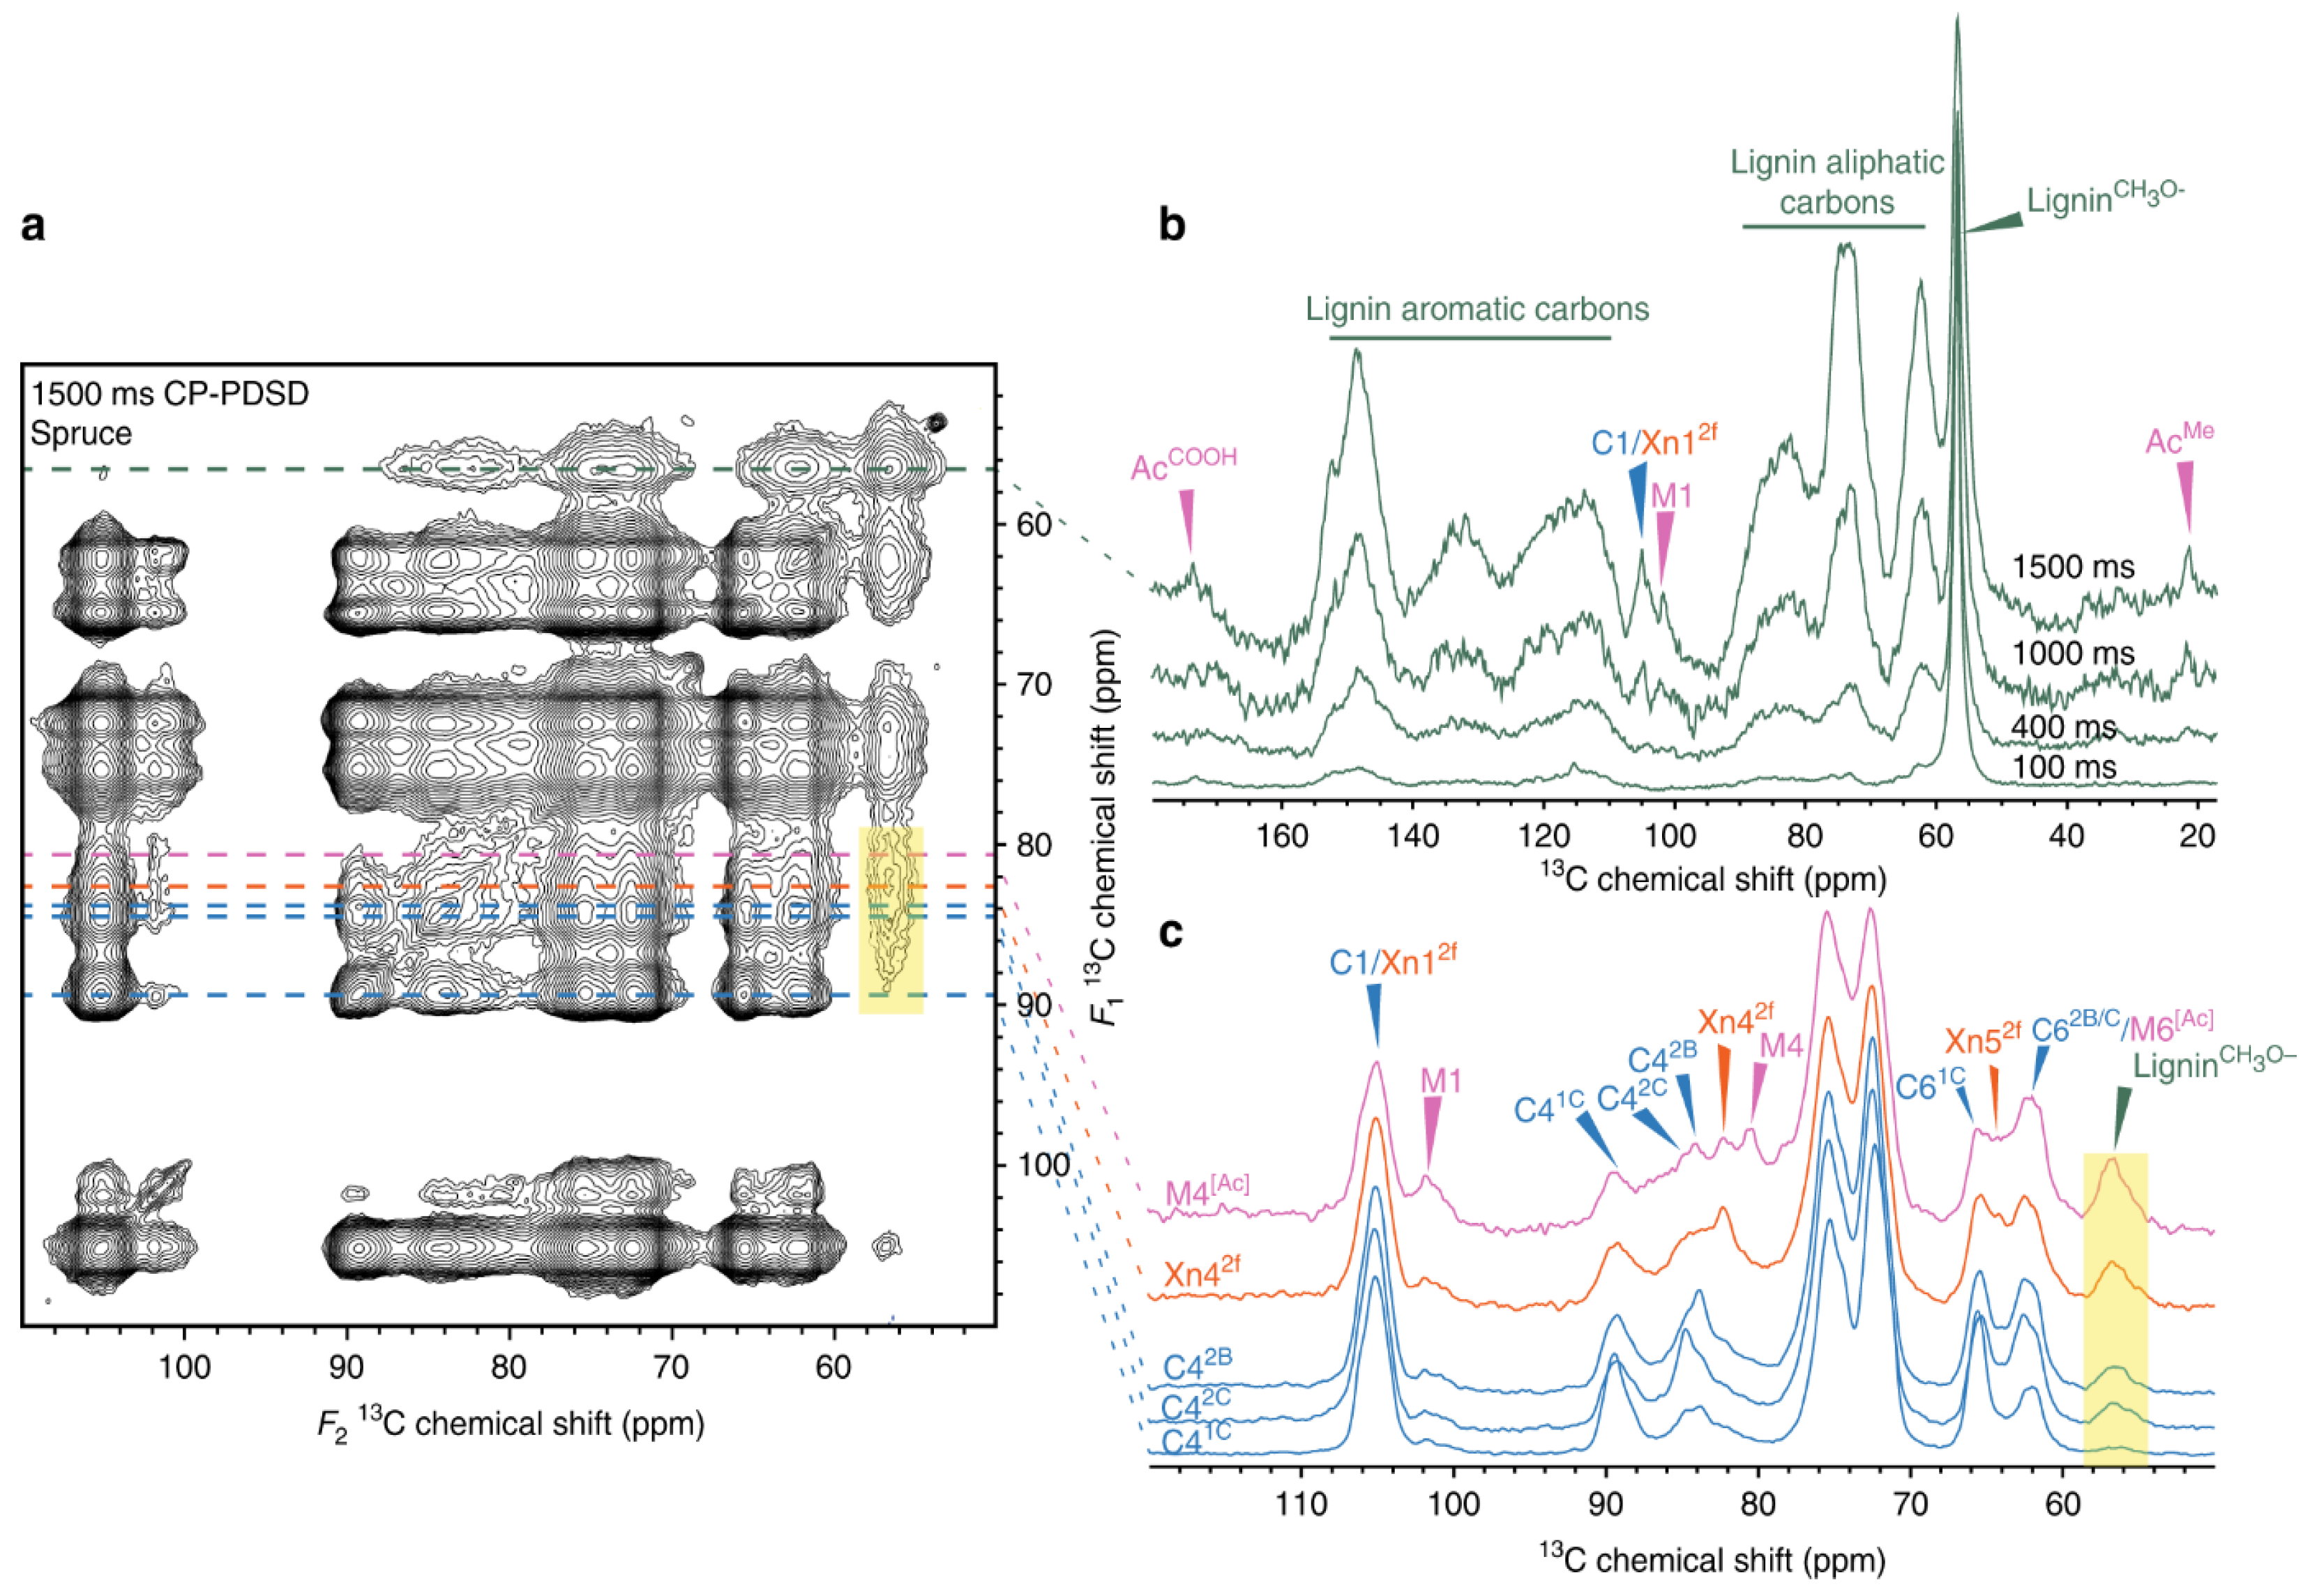
[38][39]. To confirm this statement, the CP-PDSD spectra for cross-peaks between polysaccharide carbons and lignin methoxyl were examined at 56.5 ppm. In
Figure 1a, one can observe the cross peaks of lignin at 56.5 ppm.
Figure 1b, slices from varying mixing times at 56.5 ppm slices of spectra are stacked. Up to the 1000 ms mark, the cross-peaks shown are intramolecular from lignin methoxy to aliphatic lignin carbons, which are chemically similar to polysaccharide carbons. Intramolecular cross peaks to aromatic lignin carbons can also be seen at 115–153 ppm. Interestingly, there are no cross-peaks to Ac
Me or to polysaccharide carbon 1, which provides evidence that cross peaks between lignin methoxy groups and carbons with chemical shifts 62–90 ppm are intramolecular at the 400 ms mark. At 1000 ms and reaching to 1500 ms, a cross peak between the lignin methoxy group appears, and the galactoglucomannan (GGM) Ac
Me and another cross peaks between lignin methoxy group and C1/Xn1
2f, M1
[Ac] appear. This proves that both lignin and the acetylated and unacetylated mannosyl residues in GGM are spatially close. Most of the cross peaks from the lignin methoxy group are intramolecular. This suggests that most of the lignin is distant from polysaccharides
[40].
Figure 1. 2D
13C–
13C correlation spectroscopy for assisting in locating lignin in spruce. (
a) The carbohydrate region of a
13C CP-PDSD spectrum is shown, with lines marking the 1D slices derived from the 2D spectrum. (
b) The lignin methoxyl (56.5 ppm) slice extracted at 100, 400, 1000, and 1500 ms mixing times are overlaid and normalized. (
c) The carbon 4 slices of GGM (80.4 ppm), xylan (82.4 ppm), and three cellulose (2B = 83.7, 2C = 84.5, 1C = 89.5 ppm) sub-domains from the 1500 ms 2D CP-PDSD spectrum are shown, normalized. A translucent yellow box highlights the cross-peak to the lignin methoxyl. Reproduced with permission. Ref.
[40] Copyright 2019, Nature Publishing Group.
4. Effect of Oxidation on Pulp and Viscous Cellulose
The oxidation and functionalization of cellulose has long been investigated
[41][42], it has gained much interest in biobased industry, additionally to the formation of several cellulose-based derivatives
[43], which were used in different fields, such as drug delivery vehicles
[44]. Oxidation involves the selective creation of oxidized groups, mainly as aldehyde functional groups between C2 and C3 in cellulose, these aldehyde groups serve as anchors for further modification, such as amine molecules (imines) and oxidation to carboxyl groups. Several factors and conditions play an effective role and strongly influence the oxidation rate, such as the oxidative agent type and concentration
[45], sonication
[46], temperature, ball milling
[47], and presence of metal salts
[48], in addition to the properties of the native cellulose used, such as the crystallinity, polymorphism, degree of oxidation, and accessibility of oxidizing agent
[27].
The degree of oxidation for different cellulose polymorphs was studied with
13C CP MAS NMR, the main results include noticeable resonances between 85 and 93 ppm, mainly corresponding to aldehyde hydrates, formation of hemialdal structures between the two newly formed aldehyde groups, having a peak around 97 ppm, which explains the absence of carbonyl resonances between 175 and 185 ppm, and the formation of hemiacetals, showing resonance at 88 ppm, and ones originated from C6 between 65 and 69 ppm
[27]. Solid state NMR spectroscopy allows a deep insight into the structure of oxidized cellulose, but appears to be less effective and reliable in reporting the crystallinity index
[49][50] of the different cellulose polymorphs with the CP MAS technique, due to the overlapping effects appearing on the C4 and C6 signals and internal crosslinking of hydroxyls from C6
[27].
5. Production of Crystalline Nanocelluloses via Oxidation of Microcrystalline Cellulose
Microcrystalline cellulose fibers are exposed to TEMPO-mediated oxidation
[51], to form a biocompatible and sustainable cellulose-based derivative called crystalline nanocelluloses, which include the most famous cellulose nanocrystals
[52][53] and, due to their biocompatible, sustainable, biodegradable and high surface area properties
[51], have attracted researcher attention, to utilize them as reinforcing components
[54], drug delivery carriers
[44], and supports for nanocatalysts
[55].
13C CP MAS NMR spectroscopy
[56] is capable of analyzing the chemical environment of cellulose nanocrystals
[57] in their different forms of carboxyl groups, in addition to the applied chemical modifications, and comparing these results with the original cellulose
[58]. Cellulose nanocrystal spectra show carboxyl groups in their acidic form at 171 ppm and sodium binding form at 174 ppm, where the latter also appears in the spectrum of the rhodium modified cellulose nanocrystals, in addition to a newly formed unidentified weak intensity signal at 188 ppm. The newly appearing carboxyl group at 188 ppm confirms that a chemical interaction occurs between the carboxyl group and the surface of the rhodium-based modification
[58][59].
This entry is adapted from the peer-reviewed paper 10.3390/polym14051049