Your browser does not fully support modern features. Please upgrade for a smoother experience.
Please note this is an old version of this entry, which may differ significantly from the current revision.
Among the first discovered and most prominent cellular oncogenes is MYC, which encodes a bHLH-ZIP transcription factor (Myc) that both activates and suppresses numerous genes involved in proliferation, energy production, metabolism and translation. Myc belongs to a small group of bHLH-ZIP transcriptional regulators (the Myc Network) that includes its obligate heterodimerization partner Max and six “Mxd proteins” (Mxd1–4, Mnt and Mga), each of which heterodimerizes with Max and largely opposes Myc’s functions.
- L-Myc
- Max
- Mxd Cancer Metabolism Tumor suppressor ChREBP MondoA Mlx
1. Introduction
The Myc and Mlx Networks. The year 2021 marked the 30th anniversary of the discovery of Max, the obligate heterodimerization partner of the c-Myc (Myc) bHLH-ZIP transcription factor, which had itself been identified nearly a decade earlier as the evolutionarily conserved cellular homolog of the avian v-myc retroviral oncogene [1][2][3][4][5]. Shortly thereafter, it became clear that Max was necessary for Myc-mediated target gene activation and cellular transformation but that, at higher Max:Myc ratios, it also repressed these functions in a dose-dependent manner [6][7][8][9][10][11]. This initially suggested a simple model, whereby Myc–Max heterodimers, which contain a transactivation domain (TAD) contributed by Myc, and Max homodimers, which lack a TAD, alternatively activate or suppress transcription in accord with their relative abundance [12][13]. This balance was believed to be maintained by the competitive binding of these dimers to so-called “E-box” elements that are typically located in proximity to the transcriptional start sites of target genes (Figure 1). The model immediately implied that Max could serve dual functions—on the one hand, it could activate target genes and drive transformation by virtue of its obligate association with Myc; as a homodimer, on the other hand, it could outcompete Myc–Max binding, repress target gene expression and serve as a tumor suppressor (TS).
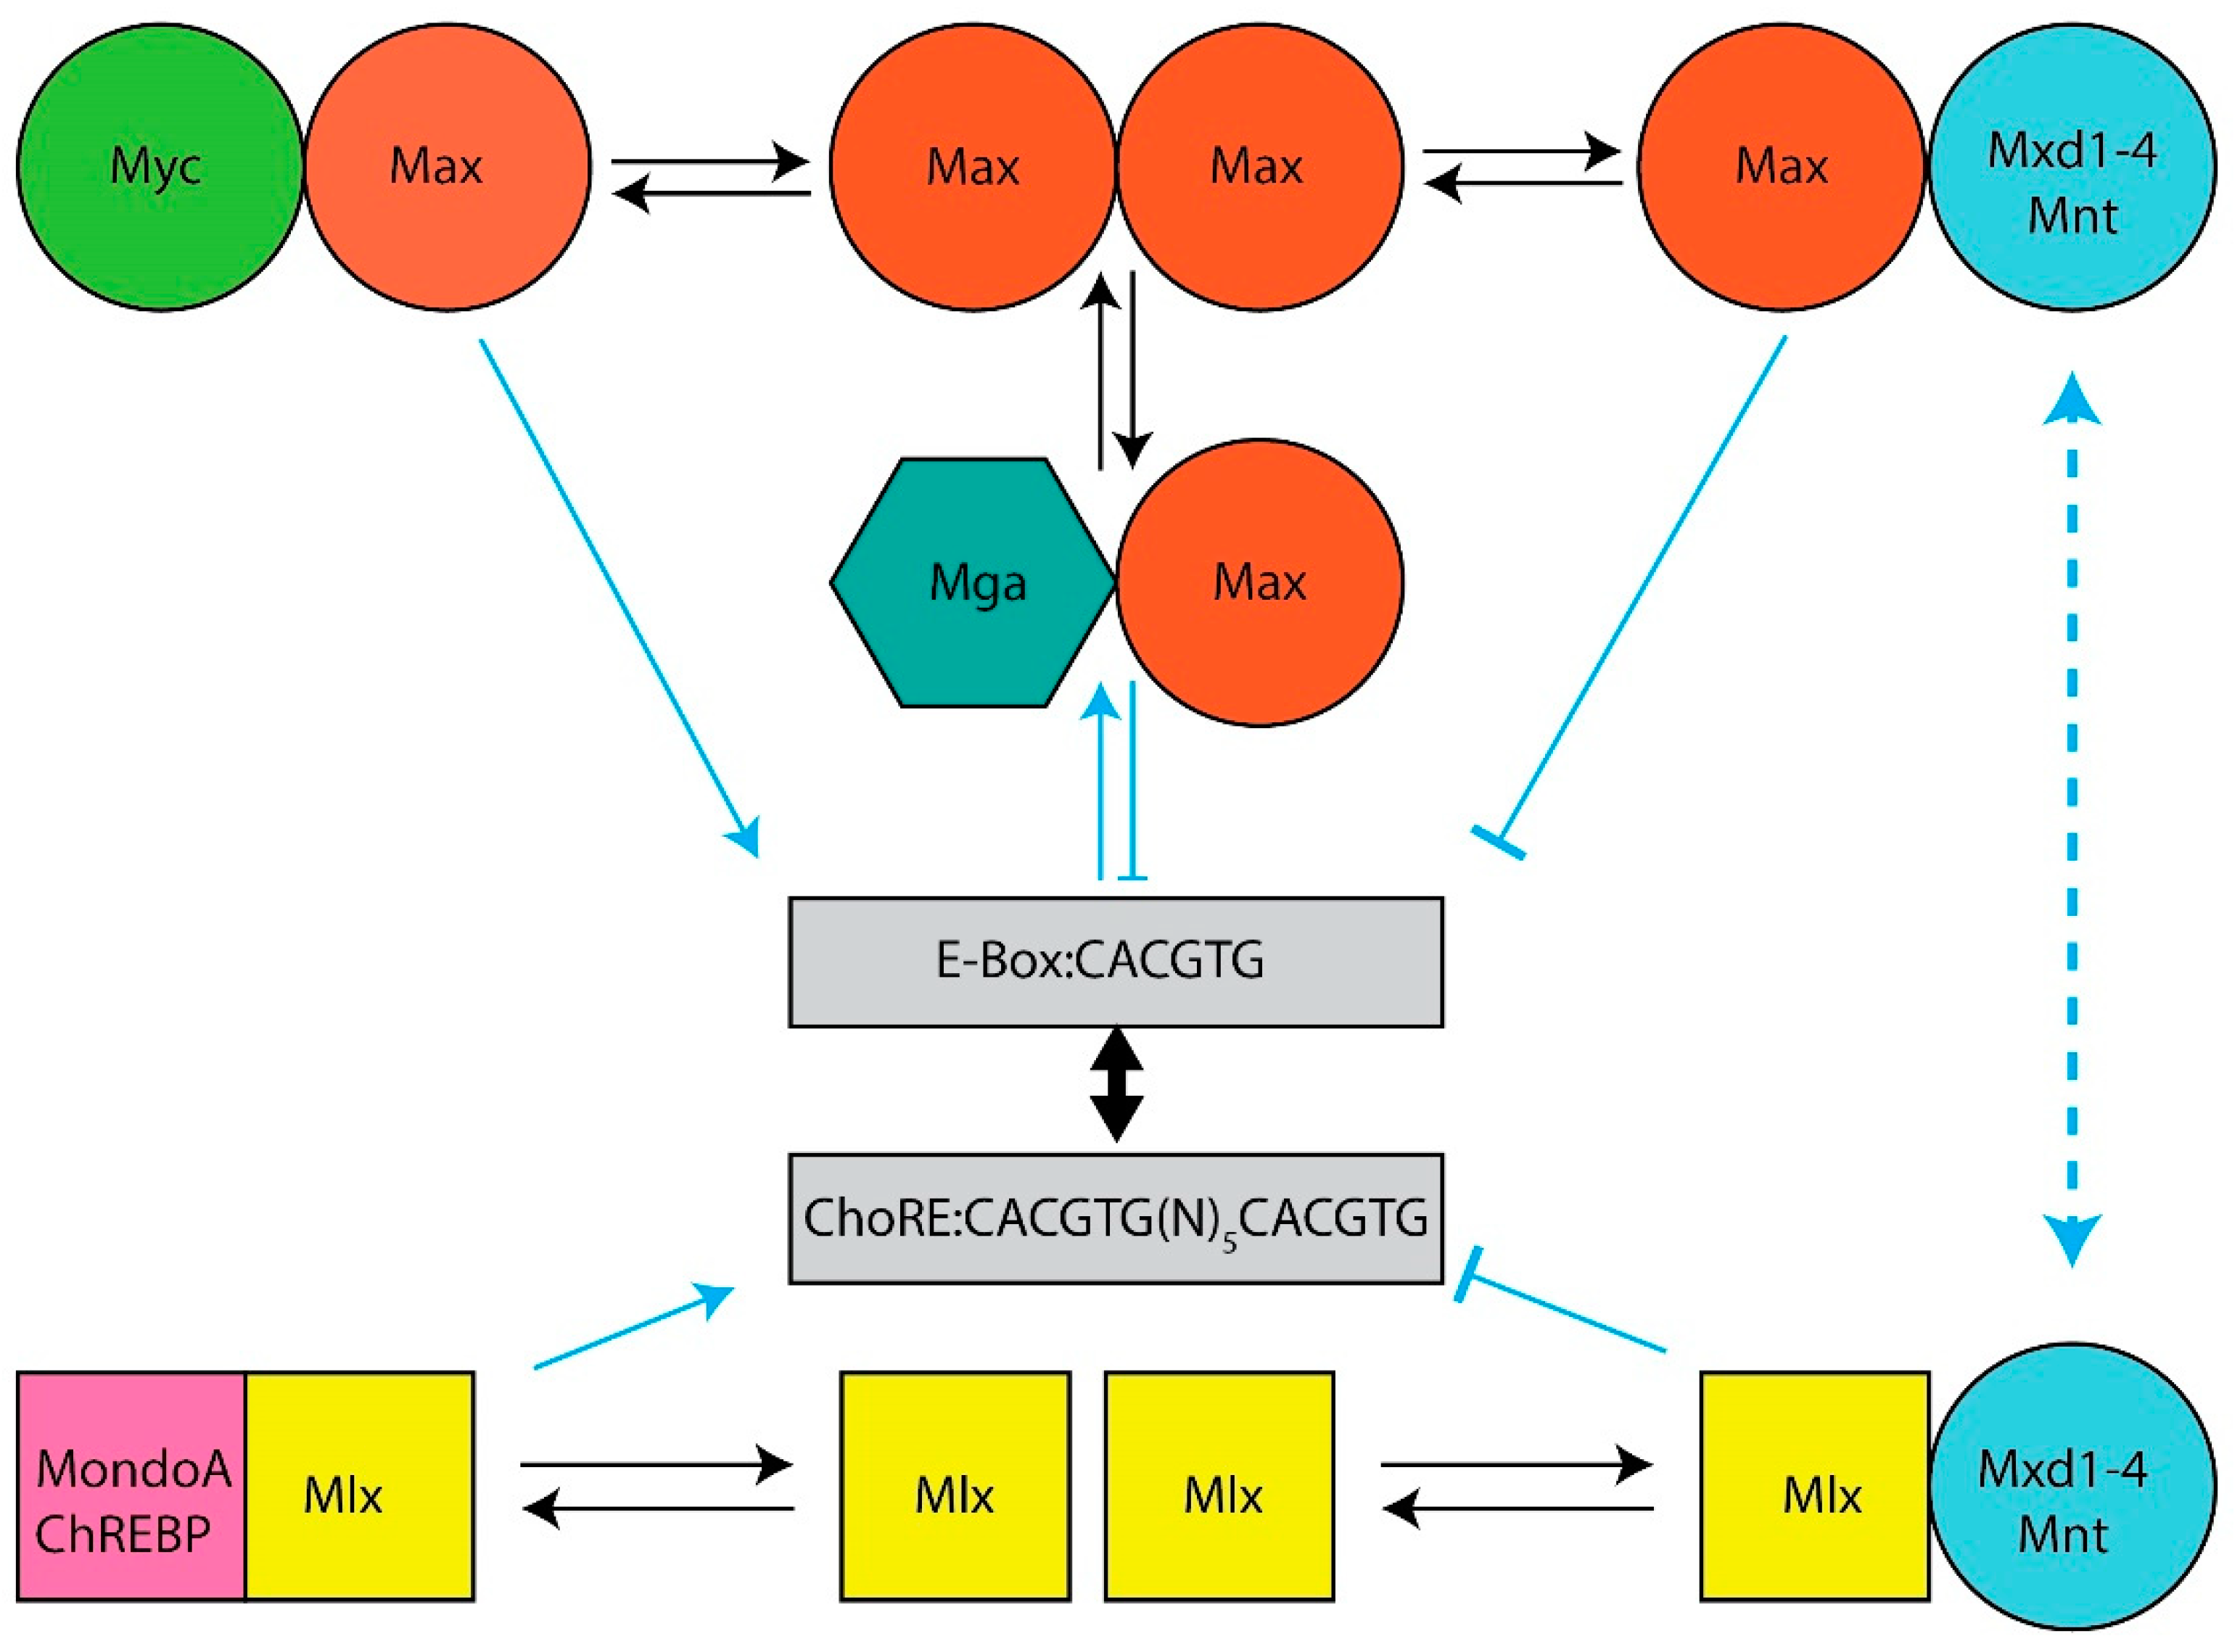
Figure 1. The Extended Myc Network. Top: The Myc Network. Myc–Max heterodimers bind to cognate E-boxes in target genes. They then recruit chromatin-modifying enzymes such as histone acetyl transferases and transcription co-factors, which mediate the histone acetylation and demethylation that permit subsequent increases in RNA polymerase II (Pol II) binding, the relief of Pol II pausing and read-through transcription [14][15][16][17][18]. DNA binding by Max homodimers is prevented by inhibitory N-terminal phosphorylation [19][20]. Max also lacks a TAD that is needed for chromatin remodeling and transcriptional activation [13][16][21]. Transcriptional repression of Myc-activated genes is mediated by six “Mxd proteins” (Mxd1–4, Mnt and Mga) whose levels of expression are variably tissue, development, age and cell cycle specific [22][23][24][25][26][27]. These compete with Myc–Max heterodimers for E-boxes, recruit mSin3, histone deacetylases, methyltransferases and complexes that mediate more direct transcriptional repression [28][29][30]. Bottom: The Mlx Network. The Myc-like factors MondoA and ChREBP heterodimerize with Mlx (which, unlike Max, can homodimerize, albeit weakly), bind certain metabolites such as glucose, glucose-6-phosphate, lactate and adenosine, and translocate from the cytoplasm to the nucleus where they bind to target genes containing both ChoREs and E-boxes although the size of this repertoire is smaller than that of Myc targets [31][32][33][34][35][36][37][38][39][40][41][42]. The negative regulatory arm of the Mlx Network employs some of the same repressive strategies utilized by the Myc Network with some distinct exceptions.
Max’s discovery soon paved the way for the rapid identification of six additional bHLH-ZIP Max partners that currently comprise the so-called “Myc Network”, of which Max remains the central member (Figure 1). These proteins, Mxd1–4, Mnt and Mga (hereafter referred to collectively as “Mxd proteins”, despite their structural and functional differences) (Figure 1), necessitated a revision of the above model as did the finding that, in mammalian cells, Max’s high level of phosphorylation, maintained by casein kinase II, prevents its binding to DNA as a homodimer but not as a heterodimer [19][20][43]. Transcriptional repression by Max was thus deemed to be mediated not simply by passive exclusion of Myc–Max heterodimers from binding E-boxes but as an active process that required Max’s heterodimerization with Mxd proteins, the association with obligate transcriptional co-repressors such as mSin3 proteins and the ensuing transcriptionally suppressive modification of chromatin via altered patterns of histone acetylation and methylation [14][28][44][45][46][47]. Collectively, these six Mxd proteins, which show distinct tissue-, developmental- and age-dependent patterns of expression, antagonize Myc’s broad impact on transcription and its highly pleiotropic effects on both normal and neoplastic growth [6][7][8][22][24][46][48][49][50][51][52][53][54][55].
By the turn of the 21st century, the existence of a second network, parallel to that of the Myc Network, and possessing significant structural and functional similarities, had emerged. This “Mlx Network”, also comprised of bHLH-ZIP factors, contained the Myc-like proteins ChREBP (“carbohydrate response element binding protein”) and MondoA and their own dedicated heterodimerization partner, the Max-related Mlx, which together formed the Network’s positively-acting arm [31][56][57][58] (Figure 1). Unlike Myc and Max, which are nuclear proteins, ChREBP, MondoA and Mlx are “conditionally nuclear” in that they translocate to the nucleus only upon binding metabolites such as glucose, glucose-6-phosphate, fructose 2,6-bisphosphate, lactate and adenosine [31][32][33][34][35][36][37][38][40][42][56][59][60][61][62][63][64][65][66][67][68]. The cytosolic location of MondoA and ChREBP is also not random; rather, amphipathic helical domains in the C-termini of these factors allow them to interact with intracytoplasmic lipid droplets and presumably serve as sensors of intracellular lipid content [69]. Lipid droplet depletion, together with the above metabolites, allows MondoA and ChREBP to translocate to the nucleus and activate genes involved in glucose metabolism. The negative arm of the Mlx Network shares three factors from the Myc Network, namely Mxd1, Mxd4 and Mnt, along with mSin3–histone deacetylase complexes [31][57][70]. These three negative regulators link the two Networks both structurally and functionally and provide a means of cross-talk for more refined and coordinated regulation of both common and unique targets.
Mlx Network heterodimers recognize E-box-related binding sites termed “carbohydrate response elements” (ChoREs) (Figure 1). Both E-boxes and ChoREs, but particularly the latter, can be quite variable and cross-binding of one Network’s members to the other Network’s sites is likely more common than previously appreciated [57][71][72][73][74][75][76]. Binding by ChREBP may also facilitate promiscuous, non-E-box-dependent binding by Myc at nearby sites [77]. Mlx Network target genes, while overlapping with those regulated by the Myc Network, are both fewer in number and have been reported to be more functionally restricted [39][41][78]. They tend to encode enzymes involved in carbohydrate and lipid metabolism; mitochondrial and ribosomal proteins and factors that regulate translational initiation, elongation and termination [31][39][41][42][46][70][71][72][73][76][78][79][80][81][82][83][84][85][86][87][88][89]. Together, these findings indicate that, via selective, cytoplasmic-nuclear partitioning, sharing of Mxd1,4 and Mnt and binding to both common and unique target genes, this “Extended Myc Network” cross-talks, while simultaneously communicating with and responding to the metabolic cues and reservoirs needed to support energy-intensive processes such as translation and proliferation [36][42][64][65][69][88][89][90][91][92][93][94][95][96].
The Extended Myc Network and tumor suppression. Given the number of Mxd proteins and their crucial roles, particularly with regard to limiting Myc signaling, proliferation and metabolism (Figure 1), it is reasonable to surmise that, at some level, they, and perhaps Max as well, behave as TSs. The researchers discuss below the evidence to support this, the findings that the inactivation of these factors is often confined to certain tumor types and the implications of Mxd member haplo-insufficiency, which is a common theme in many tumors. It is also important to consider these factors in their proper biological context. In other words, do they behave as “classical” TSs such TP53, RB and BRCA1/2, whose germ line or somatic inactivation predispose to spontaneous neoplasms such as leukemias, lymphomas, retinoblastomas, osteosarcomas, and breast, ovarian and prostate cancer [97][98][99][100][101][102]? Or, does the inactivation of these factors simply accelerate the growth of pre-existing tumors without otherwise contributing directly to their initiation?
All Mxd members, as well as the central players Max and Mlx, have been implicated as TSs based on bioinformatics-based surveys of large populations of human tumors [103][104]. However, to our knowledge, neither comprehensive summaries nor intragroup comparisons of the consequences of copy number variations (CNVs) and mutations described in these reports have been published. By way of introduction to the more detailed discussions presented in the following sections, the researchers surveyed all tumors from The Cancer Genome Atlas (TCGA) to identify those associated with CNVs of Extended Myc Network genes (Figure 2). This survey revealed several interesting findings. First, and in keeping with the known role of MYC as a bona fide oncogene and the presumptive roles of CHREBP and MONDOA in supporting transformation and rapid proliferation, these genes showed the highest frequency of amplification [36][41][45][103][104]. Second, recurrent deletions of all other Extended Myc Network members were quite frequent across many tumor types, in keeping with their presumptive role as TS genes (TSGs). Third, none of the genes was exclusively amplified or deleted across all tumor types or, in many cases, even within the same tumor type [104]. Fourth, among the “oncogenes”, high-level gene amplification, defined as >4.4 copies/cell [105], was seen only with MYC and tended to be associated with subgroups of certain cancers such as breast, ovary, liver and lung as previously reported [106][107][108][109]. Fifth, more often than not, amplifications or deletions of more than one Extended Myc Network gene were associated with particular tumor types and were most obvious in breast, ovarian and squamous cell lung cancers. This suggests that oncogenic activation of the Extended Myc Network can be achieved via multiple pathways that are cooperative rather than mutually exclusive. Sixth, despite its relatively high incidence of genomic instability, thyroid cancer was the only tumor in which CNV of any Extended Myc Network member was never observed (Figure 2). This may partly reflect the tumor’s high incidence of oncogenic BRAF, PIK3CA and PTEN mutations, which likely circumvent Myc Network activation [104][110]. In keeping with the theme that high-level MYC amplification tends to be confined to certain tumor types (Figure 2) [104], deletion of presumptive TSGs tend to cluster as well, particularly in those instances associated with two copy deletion as seen with MLX and MNT in ovarian cancer, MXD2 in prostate cancer and MXD3 in squamous cell lung cancer (Figure 2) [104]. Finally, the inactivation of TSG-like members of the Extended Myc Network by frame-shift and truncating mutations is rare, typically accounting for <1% of inactivated alleles, except in the case of MGA, where this approaches 4% [104]. Thus, as discussed more fully in the following sections, rather than the traditional bi-allelic inactivation/deletion of classical TSGs seen in both hereditary and sporadic cancers, hemizygous inactivation of MXD genes is not only common but a recurrent theme [98][99][100][101][102].
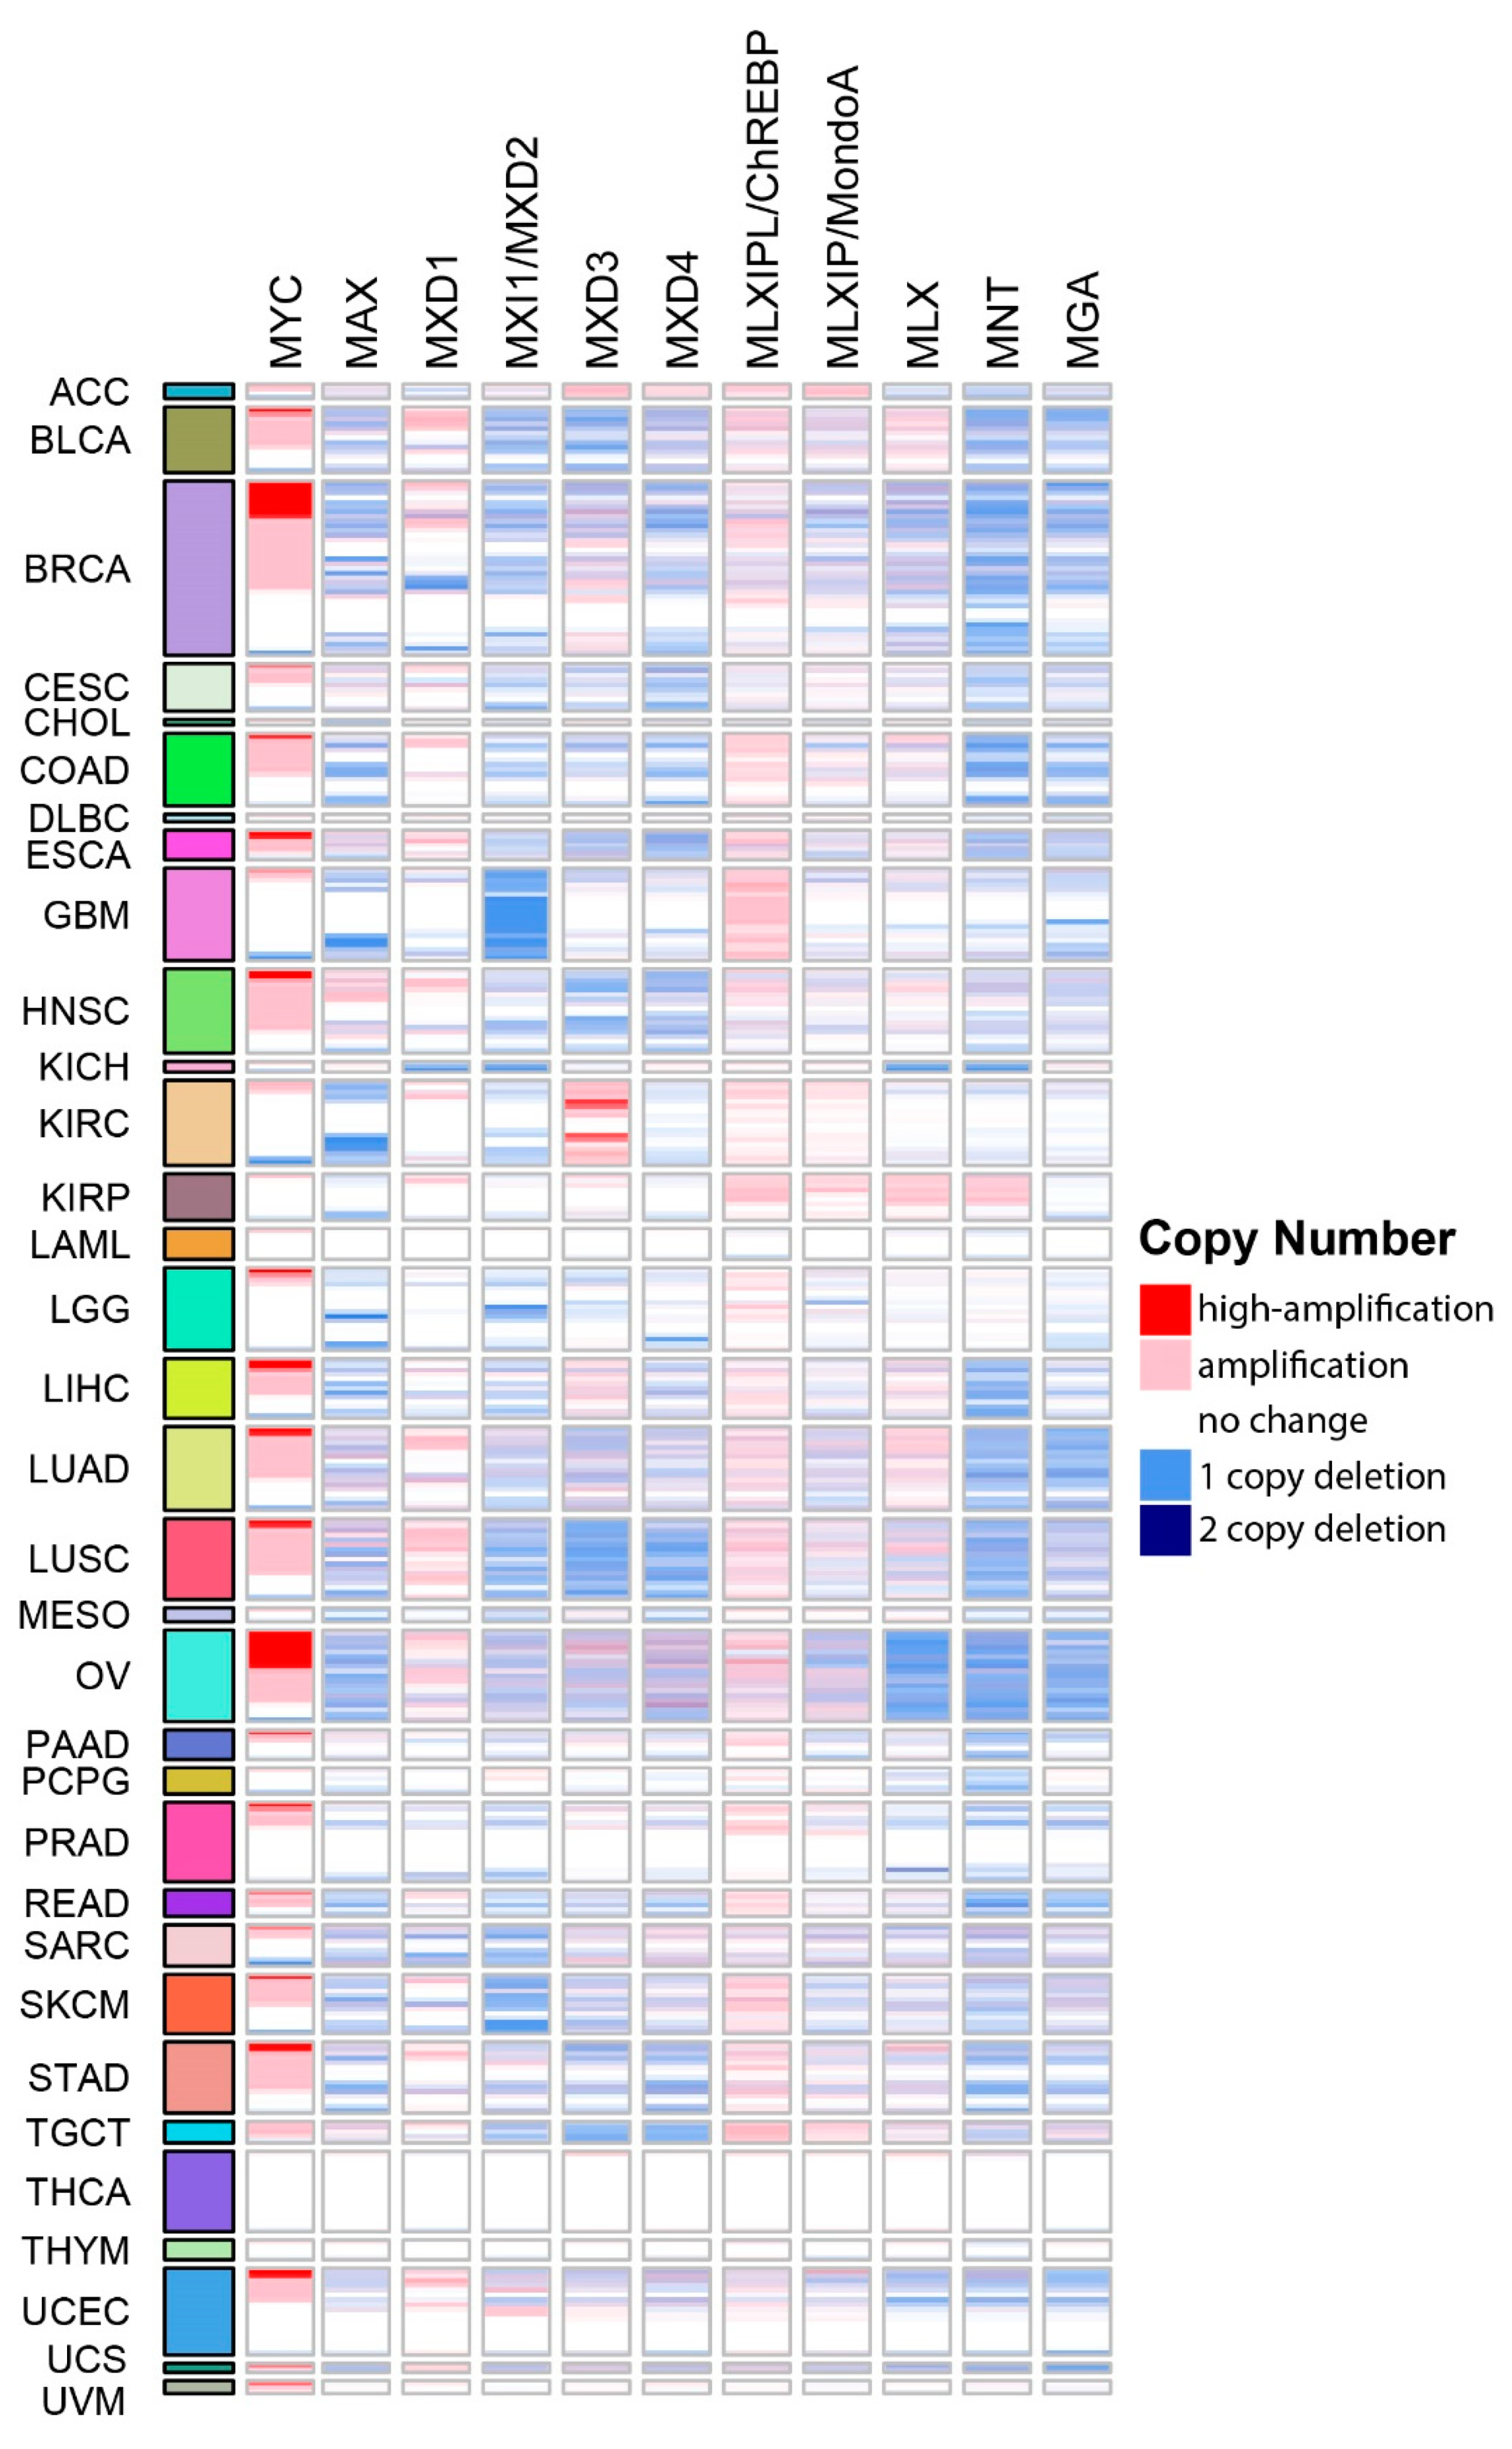
Figure 2. CNVs among individual members of the Extended Myc Network. Gene-level copy number (gistic2_thresholded) [111] data were downloaded from the TCGA Pan-Cancer (PANCAN) database (https://xenabrowser.net/datapages/?cohort=TCGA%20Pan-Cancer %20(PANCAN), accessed on 15 November 2021) Heatmaps were drawn using ComplexHeatmap R package [112]. Tumor type abbreviations: ACC: adrenocortical carcinoma; BLCA: bladder urothelial carcinoma; BRCA: breast invasive carcinoma; CESC: cervical squamous cell carcinoma/endocervical adenocarcinoma; CHOL: cholangiocarcinoma; COAD: colon adenocarcinoma; DLBC: diffuse large B-cell lymphoma; ESCA: esophageal carcinoma; GBM: glioblastoma multiforme; HNSC: head and neck squamous cell carcinoma; KICH: kidney chromophobe carcinoma; KIRC: kidney clear cell carcinoma; KIRP: kidney renal papillary cell carcinoma; LAML: acute myeloid leukemia; LGG: lower-grade glioma; LIHC: hepatocellular carcinoma; LUAD: lung adenocarcinoma; LUSC: lung squamous cell carcinoma; MESO: mesothelioma; OV: ovarian serous cystadenocarcinoma; PAAD: pancreatic adenocarcinoma; PCPG: pheochromocytoma/paraganglioneuroma; PRAD: prostate adenocarcinoma; READ: rectal adenocarcinoma; SARC: sarcoma; SKCM: skin cutaneous melanoma; STAD: stomach adenocarcinoma; TGCT: testicular germ cell tumor; THCA: thyroid carcinoma; THYM: thymoma; UCEC: uterine corpus endometrial carcinoma; UCS: uterine carcinosarcoma; UVM: uveal melanoma.
As was generally true for oncogenic members of the Extended Myc Network, the correlation between MXD TSG expression and survival is variable. Figure 3 summarizes these relationships among all tumors from TCGA and Figure 4 shows several specific examples of survival differences. Interestingly, survival correlated with the expression of as many as 8–9 of the individual Extended Myc Network members and in the cases of low-grade gliomas (LGGs) and clear cell renal cancers (KIRC), with all 11 members, although not necessarily in the same way. This supports the points mentioned above that perturbing the delicate balance among Extended Myc Network members may have oncogenic consequences that are additive or complementary rather than mutually exclusive. The connections among tumor aggressiveness, survival and the expression of individual members of the Extended Myc Network are thus complex, interdependent and presumably tumor type specific.
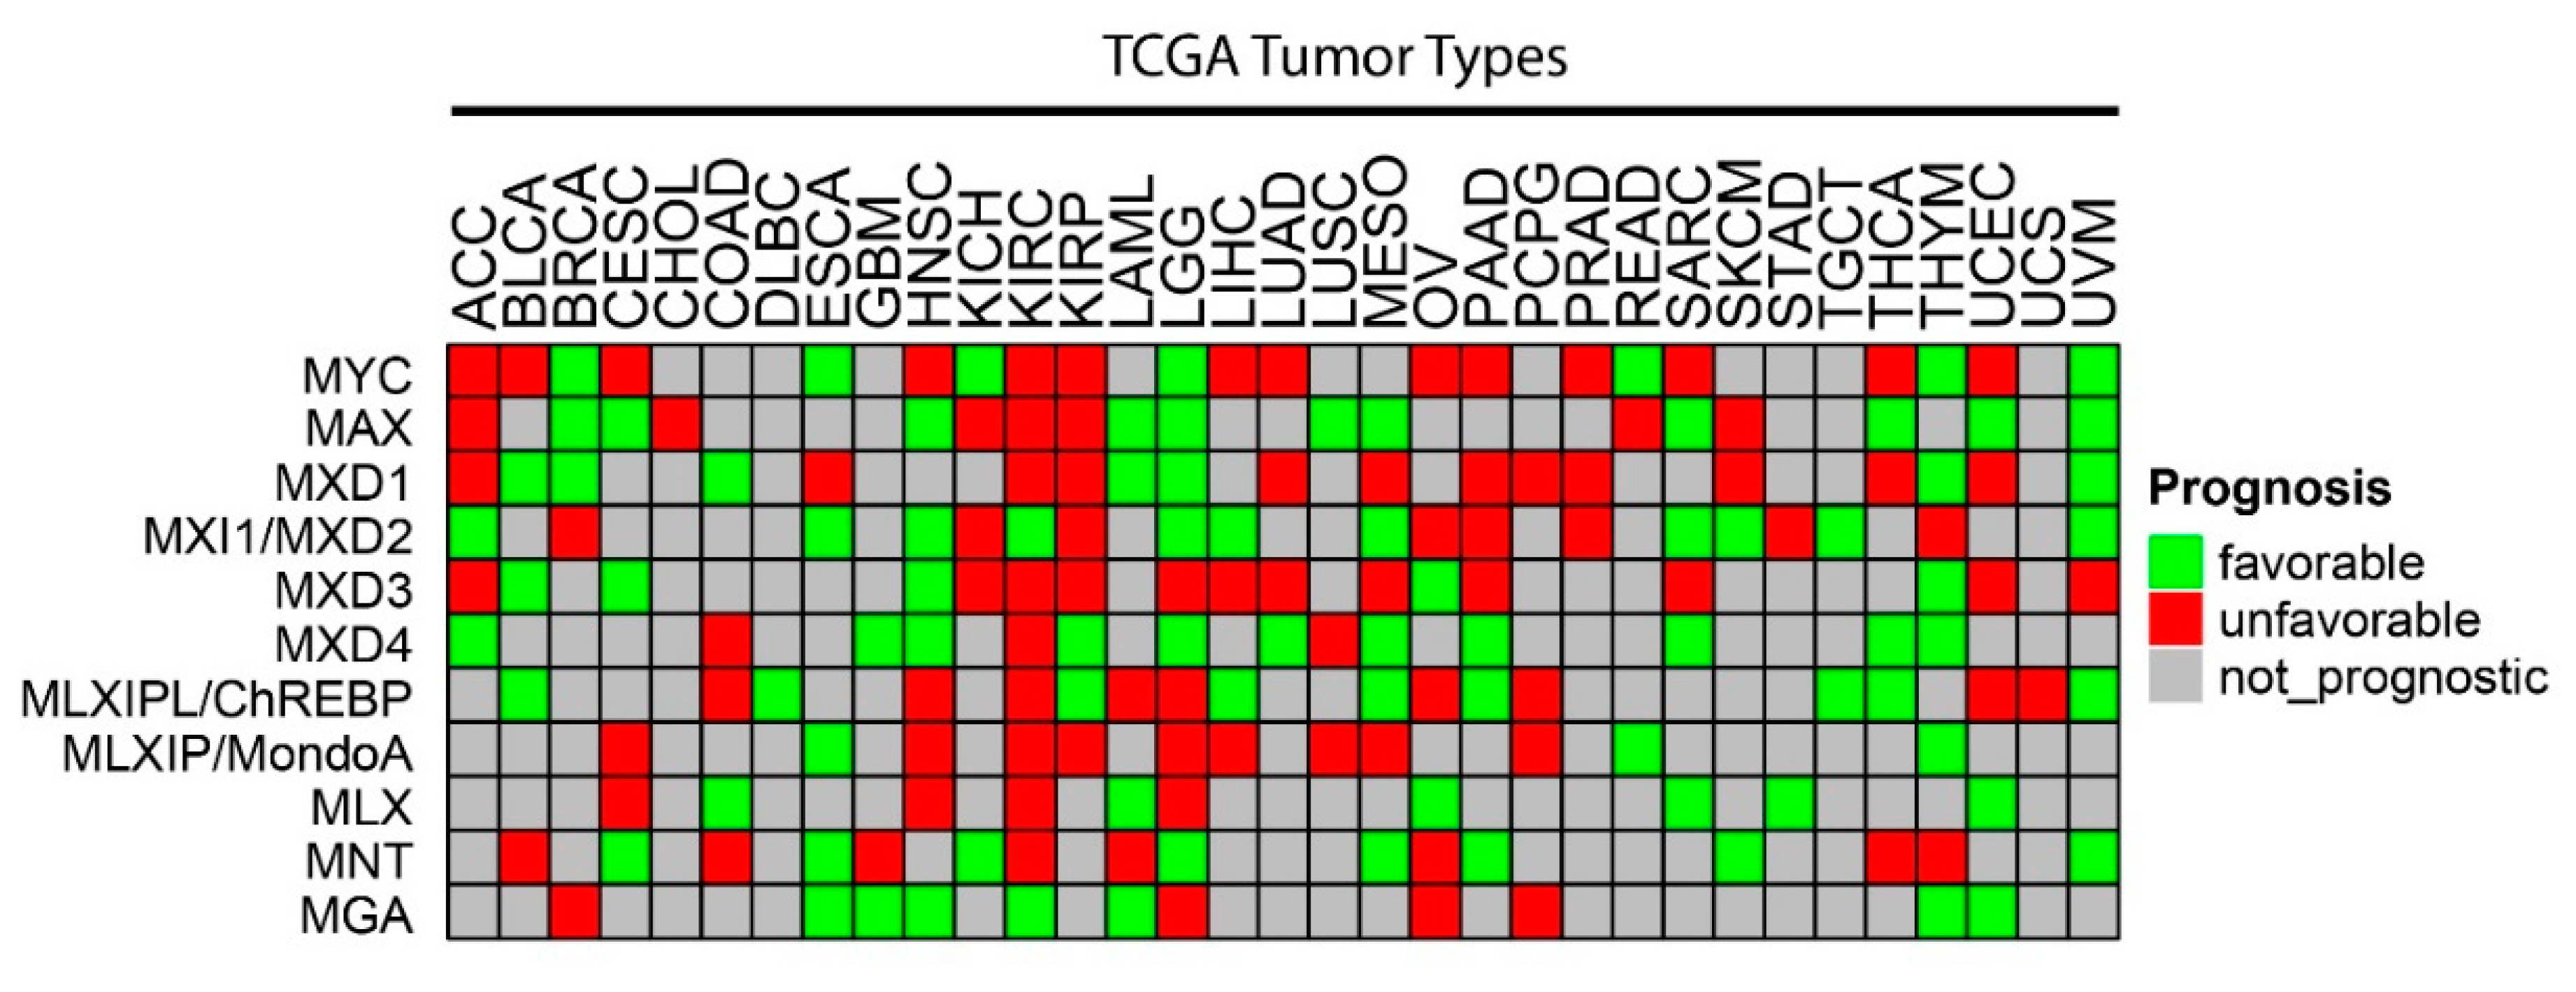
Figure 3. Correlations between survival and expression of members of the Extended Myc Network. Based on RNAseq results from TCGA, the expression of each Extended Myc Network member was examined in the indicated tumors from the same database. Tumors were divided into subsets with overall favorable or unfavorable survival. The numbers in each of these subsets were based on the levels of transcript expression that provided the most significant survival differences. The “survival” and “survminer” R packages were used for survival analysis. FPKM value ranks were used to classify individuals into two groups by 50 series cutoffs ranging from 10 to 90%. Survivorship was examined by Kaplan–Meier survival estimators, and the survival outcomes of the two groups were compared by log-rank tests. Curves were based on the FPKM cutoffs that yielded maximal survival difference between the two groups with the lowest log-rank p-value. See Legend to Figure 2 for tumor type abbreviations.
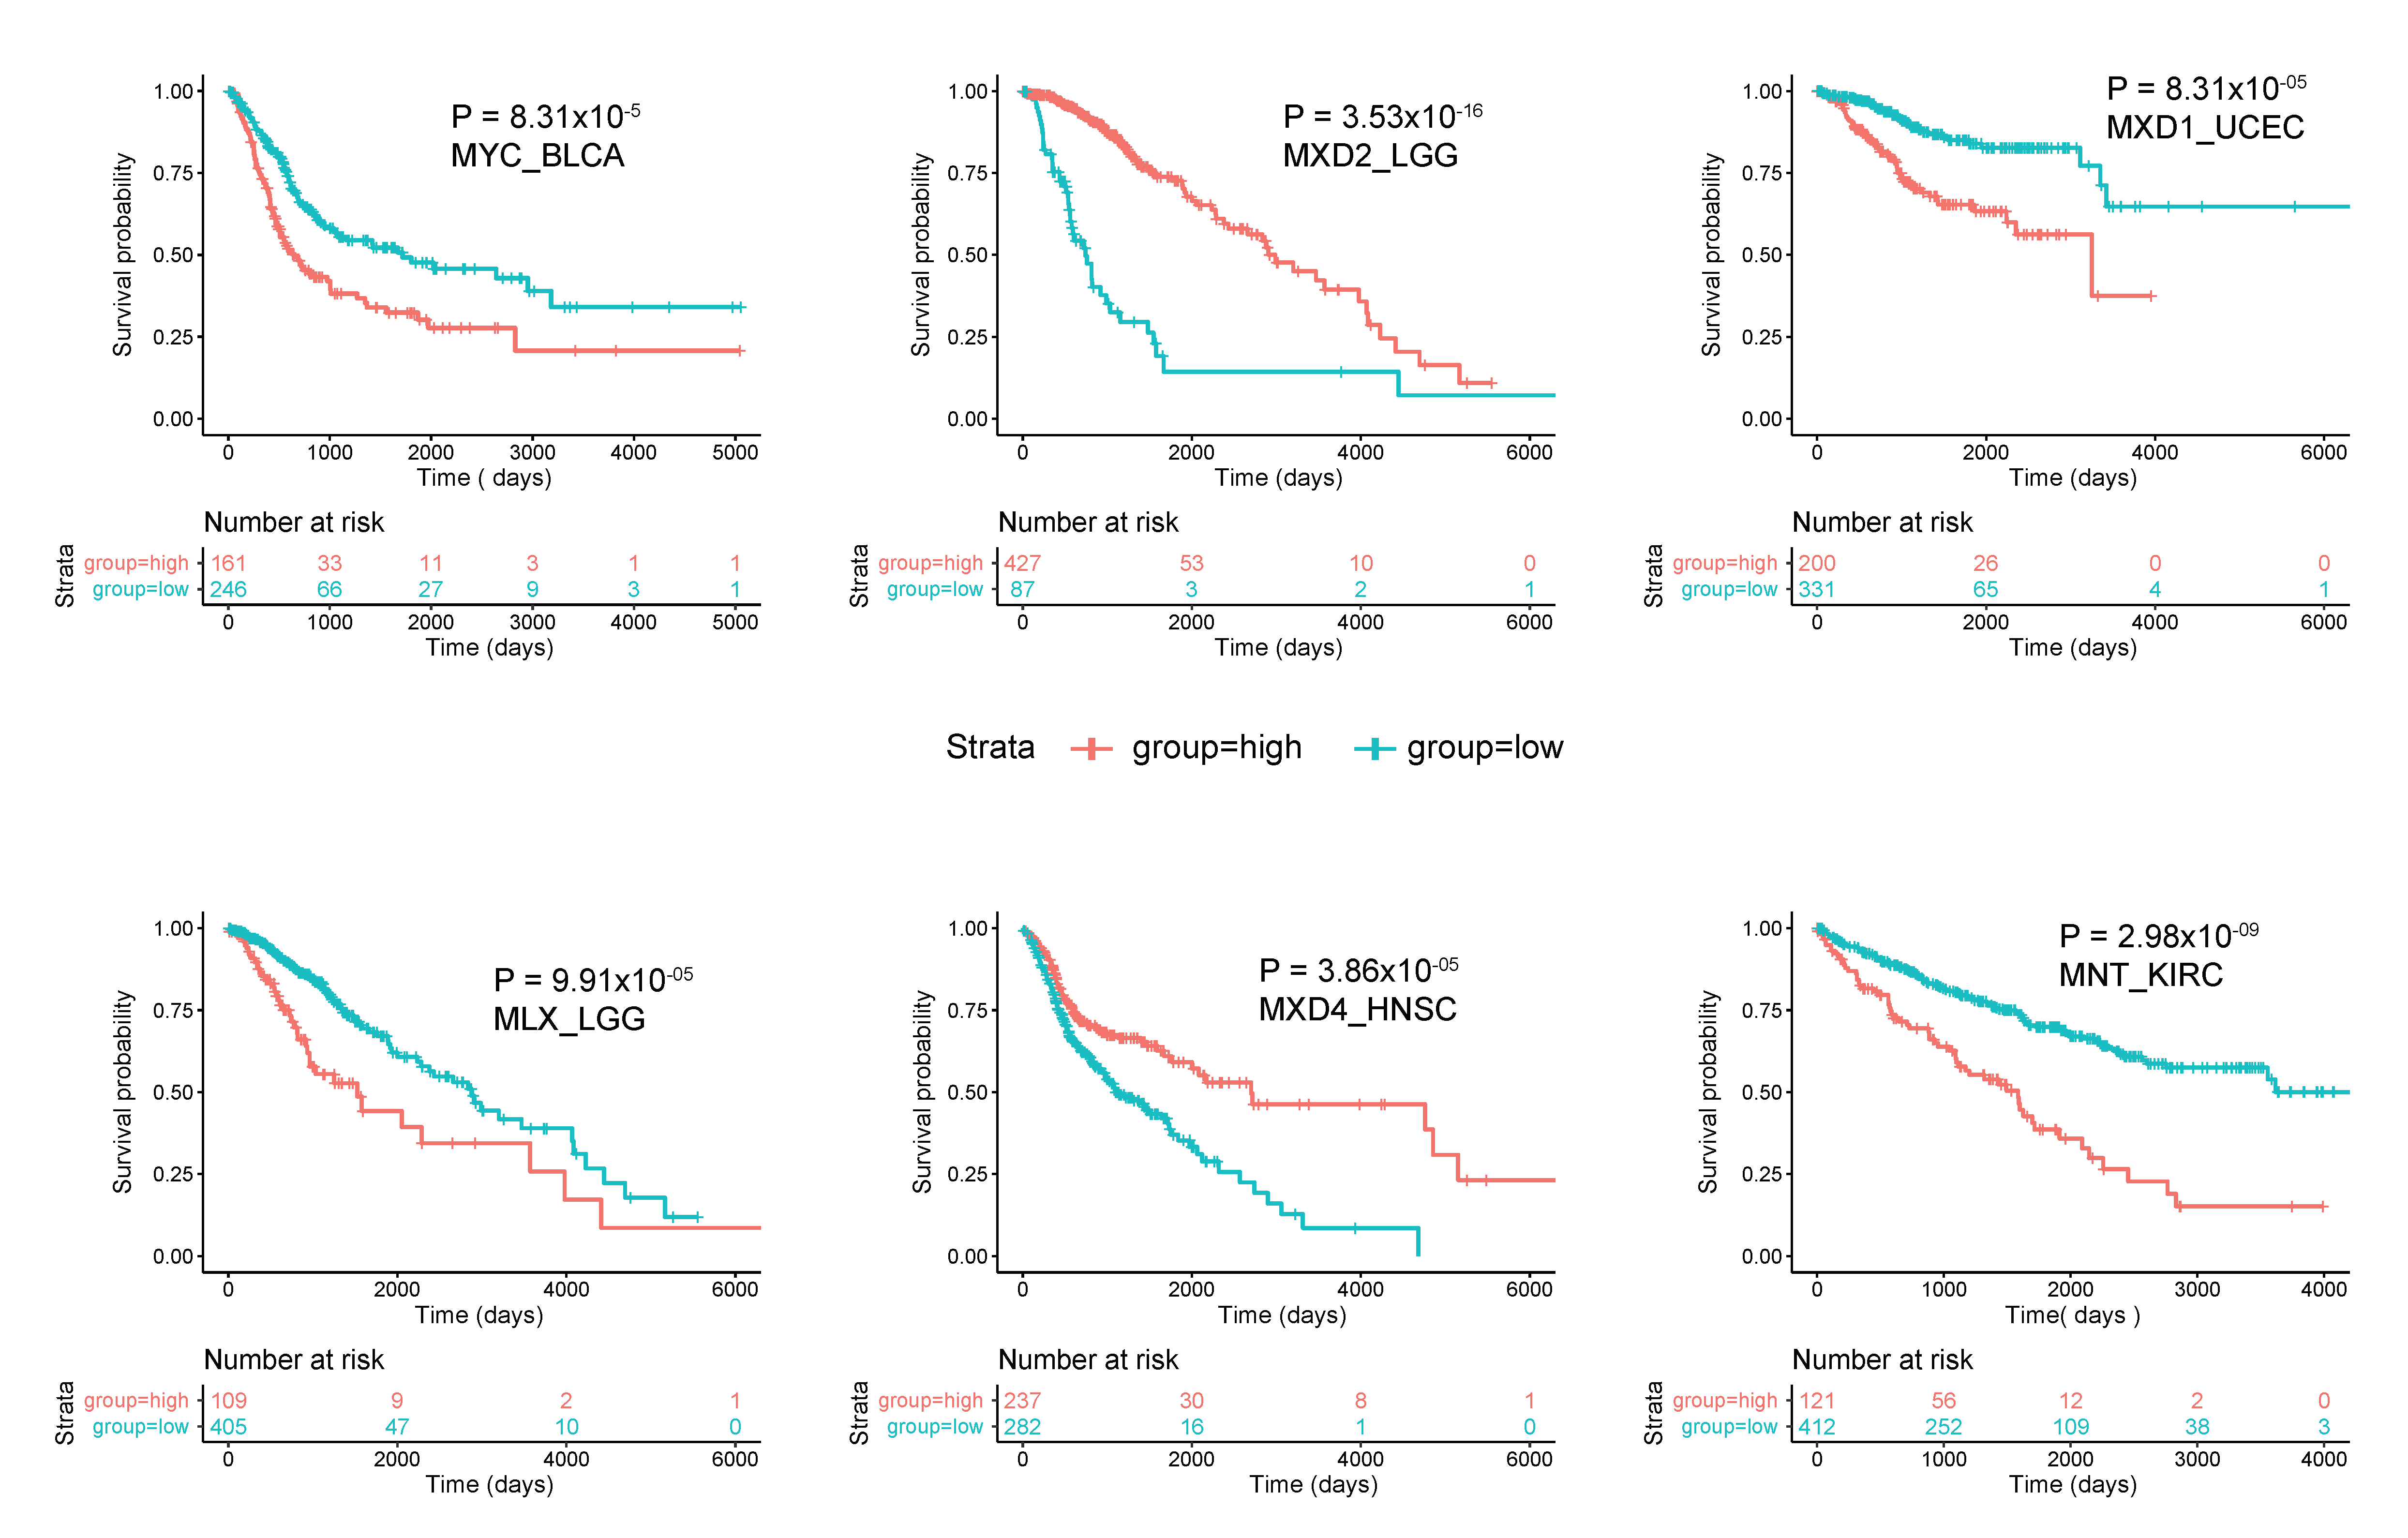
Figure 4. Correlations between survival and expression of select members of the Extended Myc Network. Tumors were chosen from those in TCGA and further subdivided as described in Figure 3. All curves were generated using the “survival” and “survminer” R packages. The number of individuals in the favorable and unfavorable survival groups which provided the greatest significance in survival is depicted in the “0 time point” beneath each survival curve.
The relationships among Extended Myc Network gene CNVs, mutation, expression and survival are in many cases only correlative. Indeed, this cautionary note applies even to an oncogene as unassailable as MYC whose role in tumorigenesis mandated a direct demonstration of its actual causality [113][114][115]. Yet, recent work has indicated that, at least for some tumor types, Myc may function more as a facilitator of tumor growth than as an actual initiator. For example, hepatoblastoma (HB) in mice, induced via the ectopic expression of mutant forms of β-catenin and the Hippo pathway effector protein YAP, is associated with Myc over-expression [78][116][117]. Yet, the rate of tumor induction in livers with hepatocyte-specific knockout of Myc is identical to that seen in wild-type livers [41][78] although tumor growth is slowed. Similarly, tumors induced with different β-catenin mutants express widely different levels of Myc that roughly correlate with growth rates even though they too are initiated at identical frequencies [117]. These results, strongly indicate that the role of Myc in actual tumor induction versus facilitation is quite nuanced and may reflect both the levels at which it is expressed and the tissue environment [118].
A somewhat analogous situation, discussed in greater detail below, occurs with Max. While there is no evidence that MAX is an actual oncogene, it could be viewed as being another tumor facilitator that collaborates with Myc (Figure 1). Yet, the recurrent loss of MAX in pheochromocytomas, parganglioneuromas and several other tumors, as shown in Figure 2 and elsewhere, supports its role as a potent TSG [119][120][121][122][123][124][125]. Similarly, MLX loss dramatically impairs normal hepatocyte proliferation while at the same time serving as a potent suppressor of benign hepatic adenomatosis [76].
2. Myc
Like RAS and PI3K, MYC is a classic example of a dominantly acting oncogene although, unlike the former two, it is seldom mutated in tumors. Rather, its oncogenicity commonly derives from gene amplification, where, along with CCND1 and EGFR, it is among the top three amplified genes across a broad range of cancers (Figure 2) [105]. Such frequent, pronounced and unidirectional changes in gene copy number emphasize this pro-oncogenic role and are rivaled, albeit only modestly so, by similar changes in CHREBP (Figure 2). In other tumors, such as Burkitt’s lymphoma and subsets of diffuse large B-cell lymphoma (DLBCL) and multiple myeloma, MYC’s over-expression is a result of its translocation into immunoglobulin gene loci [126][127][128][129]. Yet these examples, involving alterations in chromosomal architecture, underestimate the true frequency with which MYC is dysregulated in cancer as aberrant signaling by many mutant growth factor pathways converge on MYC and promote its over-expression in the absence of structural changes [130][131][132]. However, as mentioned in the Introduction, it is important to distinguish between MYC’s role as a primary driver oncogene versus that of a tumor facilitator that simply provides metabolic and/or translational support without being necessary for tumor initiation [41][78][113].
Unlike the direct induction of genes mediated by Myc–Max DNA binding mentioned above (Figure 1), Myc’s role in transcriptional suppression is indirect and involves the association of Myc–Max heterodimers with transcription factors such as Miz1 that normally up-regulate genes encoding negative growth regulators such as P15INK4B, P57KIP1 and P21CIP1 [133][134][135][136][137]. Mechanistically, Myc’s bHLH-ZIP domain binds directly to Miz1 and prevents the latter’s binding to initiator (Inr) elements at transcription initiation sites of these target genes. Similarly, Sp1’s binding to multiple GGGCGG sites located in the P21CIP1 promoter is disrupted via the interaction between its C-terminal zinc-finger and a ~200 residue internal region of Myc (amino acids 143–352) [138][139]. This effect is distinct from the suppression mediated by Miz1 since the deletion of P21CIP1’s Inr does not interfere with Myc’s blocking of SP1-mediated induction [138].
Despite its long and storied history as an oncoprotein, Myc may also play a role in tumor suppression. A novel means by which this might occur has been suggested by studies showing that ubiquitylation of several lysine residues in Myc’s C-terminus by the E3 ubiquitin ligase HectH9 is necessary for Myc to activate fully its target gene repertoire [140], possibly by licensing the latter protein’s interaction with and subsequent stabilization by the histone acetyltransferase (HAT) p300 [141]. HectH9 is over-expressed in many tumors and is inhibited by Miz1 [140]. This suggests that HectH9 is required for Myc to achieve its maximal transcriptional activation potential, presumably by optimizing its recruitment of p300 and other co-activators [16]. HectH9 thus represents a potential therapeutic target that could suppress if not entirely eliminate Myc’s impact on tumor growth by dictating its potency as an oncoprotein [140]. This further suggests that Myc toggles between two states of high and low transcriptional activation potential dictated by its degree of HectH9-mediated ubiquitination. Though perhaps not representing a true tumor suppressor in this latter context, the under ubiquitinated form of Myc could potentially behave in a dominant negative-like manner, thereby actively limiting tumor growth. Functionally, this could be viewed as being akin to one of the roles of Mxd proteins which is to functionally “inactivate” Myc by preventing its DNA binding (Figure 1).
Another post-translational modification that may contribute to Myc’s role in tumor suppression involves its direct phosphorylation at Thr358, S373 and Thr400 by the Pak2 Ser/Thr kinase, which inhibits Myc–Max heterodimerization and reduces target gene affinity [142]. In promyelocytic leukemia (PML) cells, this has an additional impact on retinoic acid (RA)-induced differentiation mediated by the RA receptor (RARα) and its induction of genes that inhibit proliferation and promote differentiation [143][144]. Unphosphorylated and phosphorylated Myc differentially contact RARα, with the former blocking RARα‘s transcriptional program and maintaining the proliferation of undifferentiated cells [145]. Unphosphorylated Myc’s binding to RARα decreases the latter’s association with co-activators while increasing its association with co-repressors, whereas the reverse occurs in response to Myc phosphorylation. Among the more prominent of these factors are the co-repressor HDAC3 histone deacetylase and the co-activator HAT CBP. The relationship between Myc and Pak2 is reciprocal in that Pak2 is up-regulated during late-stage RA-induced terminal PML differentiation when Myc levels are declining [146]. Thus, different environmental cues can allow Myc to either block or facilitate PML differentiation and proliferation. The mechanism by which Myc blocks PML differentiation, i.e., by directly interacting with and inhibiting another transcription factor, is formally analogous to the previous described inhibition by Myc of Miz1- and Sp1-mediated transcription.
Pak2-mediated phosphorylation of Myc has also been described in many other normal and neoplastic contexts, including primary hematopoietic cells, keratinocytes, fibroblasts and other leukemias [142][143][144][147][148][149]. It has been proposed that phosphorylated Myc plays a role in maintaining hematopoietic balance by promoting stem cell adherence and limiting expansion. However, the amplification of PAK2 (as well as PAK2-related genes) is considerably more common in cancer than is inactivation and missense mutations of Pak2 phosphorylation sites in Myc are virtually non-existent [143][144][150][151]. Thus, any role for Myc as a TS in primary human cancers is likely to be quite limited. The rare instances in which Myc seems to act as a “TS” are in actuality those in which post-translational modifications (or lack thereof) alter its stability or function in ways that reduce its effectiveness as an oncoprotein.
3. Max
Given Max’s central role in balancing the transcriptional output of the Myc Network (Figure 1), it might be perceived as promoting either pro-oncogenic or TS functions in a manner that depends on the relative abundance of Myc–Max heterodimers on the one hand and Mxd–Max heterodimers on the other [10][11][46][152]. Myc–Max association is needed to maintain both normal and tumor cell proliferation and inhibiting this for therapeutic purposes in cancer, whether by pharmacologic or genetic means, has been a long-desired goal [6][7][8][50][153][154][155][156][157][158]. Thus, disproportionate focus has been placed on Max in the context of its function as an obligatory pro-oncogenic co-factor for Myc-mediated transformation.
The first evidence for Max’s potential as a TS was provided by studies showing that, when co-expressed in relative excess to Myc, it suppressed Myc-mediated target gene activation and/or transformation in vitro [7][8][10][11][159][160]. Evidence for a natural TS function of Max was subsequently suggested by the observation that the PC12 pheochromocytoma (PC) cell line expressed a mutant Max transcript and no functional protein and that the enforced re-expression of wild-type Max inhibited PC12 growth [161].
Adrenal gland PCs and their extra-adrenal gland counterparts, paraganglioneuromas (PGLs), are typically benign tumors, approximately one-third of which are inherited and harbor identifiable germ-line mutations [162]. Additionally, approximately two-thirds of sporadic cases have an underlying genetic cause [119][163] involving at least 14 genes [120][121][122][125][164]. Max mutations are found in ~1–2% of tumors, particularly those which are inherited, display malignant features, arise in younger individuals and/or are associated with higher levels of metanephrine or normetanephrine secretion [120][122][162].
In the largest single study performed to date involving nearly 1700 inherited and sporadic PCs and PGLs, 20 Max mutations were identified, 18 of which were novel [120]. Nine of these were associated with mutations of the methionine initiation codon, with the remainder causing premature termination, aberrant splicing or in-frame deletion of crucial amino acids. The majority of these failed to express Max protein. The remaining 11 tumors contained missense mutations, seven of which were predicted to be deleterious, although all expressed the mutant Max proteins. Loss of heterozygosity (LOH) was observed in 16 of the 18 tumors analyzed.
MAX mutations have subsequently been described in tumors as diverse as multiple myeloma, small-cell lung cancer (SCLC), pituitary adenoma and quadruple wild-type gastrointestinal stromal tumor [165][166][167][168]. Multiple myeloma, in which the MAX mutation rate is ~3%, was a particularly informative source as the Max mutations provided clues into how they impacted the protein’s binding to various epigenetically-modified E-boxes [168]. The fact that methylation at position 5 of the internal cytosine residue (5mC) of the canonical CACGTG E-box inhibits Max binding has been known since the protein’s original discovery [169]. However, the E-box is subject to additional naturally-occurring cytosine modifications mediated by members of the ten-eleven translocation (Tet) family of Fe(II)- and α-ketoglutarate-dependent dioxygenase family, including 5-hydroxymethylation (5hmC), 5-formylation (5fC), and 5-carboxylation (5caC). All these modifications except 5caC have been shown to abrogate Max binding, particularly when the modification is present on both strands of the palindromic sequence [168]. A determination of Max’s crystal structure in homodimeric association with a 5caC-modified E-box showed that the R36 residue demonstrated the largest conformational difference when compared to the structure of Max or Myc–Max bound to the unmodified E-box. The importance of this residue was demonstrated by showing that the myeloma-associated Max mutation R36W completely abolished DNA binding. Moreover, of the 25 unique Max mutations identified among 805 multiple myelomas, 17 involved missense mutations, with five of these directly altering R36 and two altering the adjacent R35 residue. Finally, of the 643 tumor samples for which both mutational status and RNAseq results could be assessed, those harboring Max mutations expressed significantly lower levels of Myc and tended to display more favorable outcomes. The lower-level expression of Myc in these samples was likely due to the loss of its Max-mediated stabilization [168][170]. To explain how Myc drives myelomagenesis in the absence of efficient Max association, the authors suggested that Myc interacts with other E-box-binding proteins such as WDR5 [171][172].
SCLC in humans is often associated with TP53 and RB1 loss/mutation and amplification of MYC or its paralogs MYCN and MYCL [173][174][175]. A recent CRISPR/Cas9-based screen for suppressors of early-stage SCLC found Max to be among the top hits with no enrichment being observed for other members of the Extended Myc Network [176]. Confirmatory studies showed that Max knockdown in these “preSC” cells led to more robust growth and survival during both anchorage-dependent and independent growth in soft agar. When tested in vivo in an autochthonous Rb1/Trp53-deleted mouse model of SCLC [177], Max knockout was associated with significantly larger numbers of tumors and shortened survival. Max re-expression in a cell line derived from these tumor cells significantly suppressed growth. Interestingly, when preSC cells were engineered to over-express Myc, MycN or MycL, the concurrent knockout of Max inhibited growth. These findings suggested that, at least in this model system, Max’s role in SCLC development is context dependent and at least partly reliant upon the level of expression of Myc or its paralogs, particularly MYCL. While Max appeared to serve a pro-oncogenic function by facilitating MYC family-mediated transformation, it could also serve as a TS via one or more Myc-independent pathways.
RNAseq was performed in control preSC cells and SCLCs with or without MAX knockout as well as in SCLCs with MAX knockout and restored Max expression. Common deregulated genes shared by these cohorts included 113 that were up-regulated in response to MAX knockout and 56 that were down-regulated. Among the former were genes previously shown by ChIP to bind Myc–Max and Mxd–Max heterodimers. Collectively, these findings were consistent with the idea that MAX knockout reverses the suppression of genes mediated by the inhibitory arm of the Myc Network (Figure 1). Further analyses of these 113 genes and several hundred additional ones identified using less stringent criteria showed an enrichment for pathways dedicated to one-carbon metabolism along with the metabolism of nucleotide sugars, serine, alanine, aspartate and glutamate. Many of these genes’ promoters were co-occupied by Myc–Max and Mxd–Max heterodimers thus likely representing sites that could bind either heterodimer, depending on the cells’ metabolic and/or proliferative state. It was speculated that up-regulation of these genes in response to MAX knockout was due to the activity of other transcription factors that are otherwise normally impeded by Max–Mxd occupancy of nearby E-boxes. It was further surmised that the over-expression of MYC and its paralogs would displace Max–Mxd heterodimers from these sites, leading to increased Myc–Max binding and even more pronounced target gene induction.
The idea that Max plays a role in TS while also promoting transformation via its association with Myc suggests two simple and non-mutually exclusive ways by which this could occur. First, in some contexts, the loss of transcriptional balance between the positive and negative arms of the Myc Network may favor transformation due to distinct sets of genes whose expression is now altered (Figure 1). In other contexts, these target genes, no longer bound by any Myc Network components, are now excessively bound by other E-box-binding proteins and altered in ways the favor transformation.
This entry is adapted from the peer-reviewed paper 10.3390/cells11040747
This entry is offline, you can click here to edit this entry!