The most valid (i.e., relevant and useful, defined below) and effective indicators are developed consultatively and are relevant to community partners. The involvement of those who are closest to the issue, will be collecting data, and/or using the indicators to inform decision-making, is vital. The word
selection is frequently used in regard to indicators (for example, in
indicator selection criteria [
90,
91]). However, indicator
selection can be misleading as it implies that a valid indicator can be easily chosen from a pre-existing list of candidate indicators. While there are certainly many measures that are common between environment indicators, there is a low likelihood that a fully formed indicator, selected from a repertoire of indicators, would be sufficiently valid for understanding a local issue. This is even more the case for an EJ indicator which must necessarily incorporate two or more context- and issue-relevant measures (most commonly a demographic measure and an environmental measure) if it is to successfully elicit useful information about an issue. Therefore, rather than
selecting an indicator, it is perhaps more accurate to think in terms of
creating an indicator. Consistent with this distinction, the creation of environmental justice indicators can be thought of in two ways;
top-down and
bottom-up. While the frameworks are presented separately, they are not exclusive: ways of thinking from both can be used to inform each occasion that EJ indicators need to be developed. The frameworks are detailed below.
2.1. Top-Down: From Concepts, to Issues, to Indicators
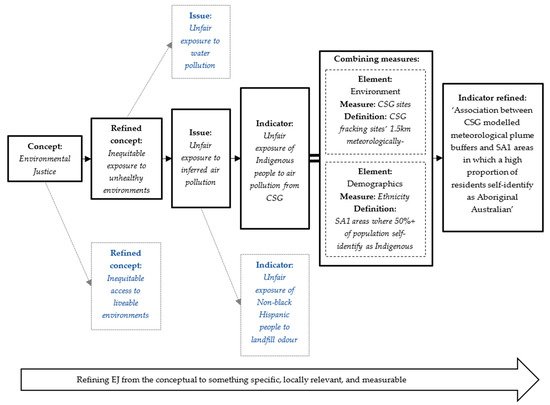
A top-down approach to the development of EJ indicators occurs when environmental justice is successively defined to the point where it becomes measurable. The top-down approach is useful for ensuring that all possible issues of environmental injustice are detected and may be of interest to a local government or an environmental protection agency that needs to establish and demonstrate that it has oversight of EJ issues in its jurisdiction and is monitoring them. Figure 2 illustrates how a hypothetical indicator might be developed using an increasingly focused, top-down approach, moving from the broad and loosely defined concept, into something specific and measurable. The figure illustrates this with the example of coal seam gas (CSG) extraction; or fracking, as it affects Aboriginal Australians. The figure also shows that other divergent refinements can be thought of as branching off to result in indicators that measure quite different aspects of EJ.
Figure 2. A hypothetical example of how the concept environmental justice is moved from the abstract to a locally specific and measurable indicator.
When developing indicators using a top-down approach, careful consideration of data availability, and of the cost implications of sustained monitoring are needed. The approach demonstrates that conceptual refinement (rather than selection) is likely to provide the most useful indicators. Nevertheless, when moving from the broad to the specific, useful indicators can often be created using existing datasets combined in new ways. In other cases, datasets capable of quantifying the elements of interest may not exist, and so new data collection protocols and monitoring programs will need to be established.
2.2. Bottom-Up: A Framework for Environmental Justice Indicators
A top-down approach might be useful for surveilling (e.g., by a government monitoring agency) a region for possible environmental injustices. However, the diversity of EJ indicators used in the literature suggests that it is more common, and practical, for indicators to be developed from the bottom-up, in response to known or suspected issues, and to answer the questions of specific audiences. In a bottom-up approach, a consultative process of problem definition to determine the exact nature of the issue of concern [
92], and therefore which measures should be combined to form the indicator, is used. Thus, a context driven, locally relevant expression of EJ is created. This requires careful consideration of the nature of the issue itself (i.e., problem definition), of existing and new data sources, and of analysis capabilities.
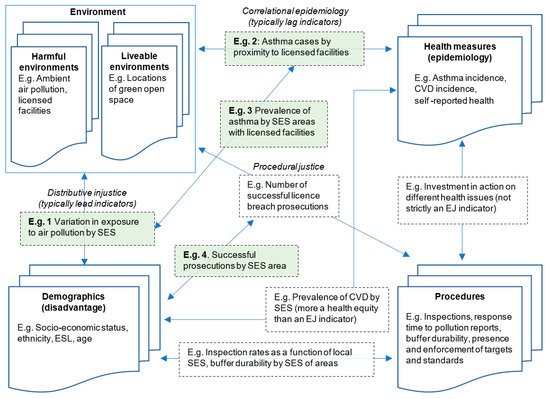
To facilitate the bottom-up approach, Figure 3 shows how constituent measures can be grouped into a theoretical framework of four broad elements. Consistent with the OECD (2008) regarding theoretical frameworks, Figure 3 shows that the elements can be combined to create environmental justice indicators for different purposes. In the upper left, the framework includes both harmful (e.g., pollution) and salutogenic (e.g., liveability) issues under the core element, Environment. The framework is also founded in the idea that an understanding of equity, enabled through demography, is foundational to the issue of environmental justice, and places Demographic measures lower left. Next, because the health of communities is important for understanding many (but not all) environmental justice issues, Epidemiology is included upper right. Finally, Procedures are included lower right because they are important for creating indicators capable of measuring procedural justice (See Figure 3). The framework can thus be thought of as a recipe for creating useful environmental justice indicators, while the example measures are a small selection of possible ingredients. The framework emphasises that the most locally valid EJ indicators will be created by combining existing, or newly created measures, rather than selected. Four of the examples—shaded green in Figure 3—are explored in more detail:
Figure 3. The EJ indicator framework showing the four core elements of EJ. Examples of the ways that the literature has defined each of the four aspects can be found in
Supplementary Materials. Some example indicators are shown in dashed-bordered boxes.
Example indicator 1, ‘Variation in exposure to air pollution by SES’, a lead indicator, can be created by analysing, for example, socio-economic status using the
Index of Relative Socio-economic Disadvantage at SA1 level [
93] as the independent variable, against an air pollution measure such as 24h average PM
2.5 concentrations [
94]. Similarly, Indicator 2; ‘Asthma cases by proximity to licensed facilities’, a lag indicator, can be created by analysing, for example, 1.0 km radial buffer around EPA-licensed polluting sites [
17] as the independent variable against hospitalization rates per 10,000 residents using hospital discharge data [
95] as the dependent variable.
A third example, Indicator 3, combines three measures: asthma from
Epidemiology, low socio-economic status from
Demographics and locations of licensed facilities from
Environment. It is a composite indicator that can identify who is affected and also draw some inferences about why. Composite indicators such as this, especially when they are monitored over time, have the capacity to build evidence and refine knowledge about a specific site-related issue. They can thus move beyond simple correlation to demonstrate causality, where it exists. A fourth example (Indicator 4) is another composite indicator. It would combine data from each of the
Environment,
Demography and
Procedures elements to map the location of facilities for which license breaches were successfully prosecuted, against the socio-economic status of the surrounding area. Such an indicator can detect whether there is equitable provision of legal services to all sectors of the community, or whether service provision favours those who are well-resourced and thus better able to advocate on their own behalf [
96]. More refined indicators such as this (i.e., created by analysing three or more datasets together) have the capacity to answer uniquely local EJ questions.
2.3. Principles for Building and Using Indicators and Indicator Suites
As with all indicators, to be most useful, EJ indicators must be designed with thought and consultation regarding the knowledge that needs to be created [
97]. Both subjective and objective measures may be combined with the resulting indicators of each type thought of as complementary rather than congruent. Regardless of the constituent measures, the analyses that are conducted, or how the data are displayed, it is essential that indicators fulfil their intended purpose and that they use best practice techniques to provide useful information about the issue of concern.
At the most basic level, the data for an indicator must be reliable. This is a relatively straightforward quality meaning that an indicator’s constituent measures, regardless of the elements under investigation, must have been constructed using consistent and trustworthy data collection methods [
98]. Frequent and longitudinal data collection are essential for EJ indicators. Sustained monitoring using reliable methods at a frequency capable of creating longitudinal data that can detect changes as a result of policy is essential. Additionally, indicators must be valid, meaning they must accurately describe the phenomenon of interest. Validity is a multifaceted quality because that is unique for each indicator. The following qualities, derived from Davern, Gunn [
15], and Niemeijer and de Groot [
90] are a summary of best practice principles for helping to ensure validity when either selecting existing candidate indicators or designing new ones. Firstly, indicators should measure what they are intended to measure (
construct validity). This means that clarity about the issue of concern should be created with all stakeholders. Going through the process of refining the issue with stakeholders, e.g., using
Figure 3, can assist with this and will also help ensure that the indicator is policy-relevant; able to both inform decision-making and to detect the effects of policy change. The indicator should also fully represent what it aims to measure (or
content validity). That is, the indicator should be sensitive to change and be able to detect trends over time. Indicators should also be widely understood, correspond to lived reality and should engage the public, e.g., in their design, monitoring and in policy responses (or
face validity) [
99].
For increased accessibility, the information that indicators elicit should be displayed using appropriate data visualisation (e.g., mapping, charts, or simple infographics such as traffic light systems [
5,
100,
101]). Finally, the power of indicators can be increased when they are used in suites, provided that the indicators therein are complementary, rather than overlapping which unnecessarily increases the monitoring burden.
In addition to the values of reliability, validity and complementarity which are indicator specific, environment protection agencies should monitor sites and industries known to be hyper-polluters, or ‘the worst of the worst’ [
102] in terms of pollution. Likewise, environment monitoring should focus on areas of known low socio-economic status as this is a powerful proxy indicator of reduced health and wellbeing due to both negative (e.g., pollution) and absence of positive (i.e., liveability) factors.
3. Conclusions
Globally, significant inequities remain in both exposure to pollution and in access to environments that support health. With evidence suggesting that health equity is at least as important for an efficient and stable society as is a high average level of health [
103,
104], preventing unequal health outcomes attributable to pollution and poor liveability is vital. A range of indicators about
distributive injustice, correlational epidemiology, procedural justice from within the broad discipline of EJ is essential for eliciting different information, detecting the presence of, and enabling a nuanced understanding of EJ issues. However, the capabilities of EJ indicators of various types are not always well-understood, nor are the terms used in the EJ literature always defined. This paper has aimed to define these terms and to offer guidance on the development of suitably valid and reliable indicators of environmental justice.
It is hoped that the frameworks will build indicator literacy amongst those working in the EJ space, including environment protection agencies, local governments and community groups, so that they can quickly develop locally valid indicators for detecting environmental injustices, a first step in redressing such injustices and for creating greater health equity.