Your browser does not fully support modern features. Please upgrade for a smoother experience.
Please note this is an old version of this entry, which may differ significantly from the current revision.
Subjects:
Chemistry, Physical
Lead azide (LA) is a commonly used primary explosive, the detonation growth of which is difficult to study because it is so sensitive and usually has a small charge size in applications.
- lead azide
- detonation growth
- photon Doppler velocimetry
1. Introduction
The detonation growth of explosives has always been the focus and hotspot of detonation and shockwave physics [1,2], which possesses great value for understanding the detonation-reaction mechanism and building reaction models for computer simulations [3]. Although extensive research has been carried out on detonations with large size, few studies which adequately cover the phenomenon at microscale exist, resulting in a lack of novel insights into the miniaturization of pyrotechnics [4,5]. To observe those microdetonations nowadays, various tabletop explosion experiments have been designed with ultrafast diagnostics or advanced techniques [6,7,8].
For primary explosives, such as lead azide (LA), the run distance to detonation and critical diameter are much smaller than in high explosives, showing the potential for microelectro-mechanical system (MEMS) and shock-initiation trains [5,9,10]. So far, however, there has been little discussion about the detonation growth mechanism of LA in microgeometry. Much of the research up until now has been descriptive in nature; for example, little data has been published on the deflagration-to-detonation transition (DDT) process of LA. Those data are fundamental to understanding the mechanism of microdetonation or applications in future pyrotechnics.
2. Steady Detonation Velocity of Lead Azide (LA) Microcharge
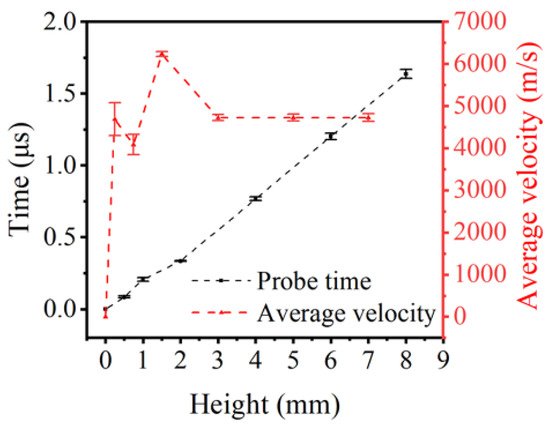
The average detonation velocities at the heights of 0.25, 0.75, 1.5, 3.0, 5.0, and 7.0 mm were calculated by Equations (1) and (2) and shown in Figure 5. The graph reveals that the average velocity has a sharp rise at the height of 0~1.5 mm, then reaches a peak of 6233 m/s at approximately 2.0 mm, and finally decays at a plateau of 4726 ± 8 m/s by 3.0 mm. In contrast to the results obtained in large pellets, a significant drop of velocity was observed in small charges. Another interesting aspect of this graph is the steady detonation velocity of LA with a diameter of 1.2 mm, measured—not calculated—which provides the basis for subsequent calculations. Hence, the detonation process of LA can be roughly described as follows. First, within the height of 3.0 mm, the detonation propagates unsteadily after ignition. Second, after 3.0 mm, the steady detonation has formed. However, the figure cannot provide the precise critical height between unsteady and steady detonation, due to the limitation of the probe size.

Figure 5. Probes signal time as a function of charge height and average velocity as a function of charge height.
3. Output Pressure of LA Microcharge
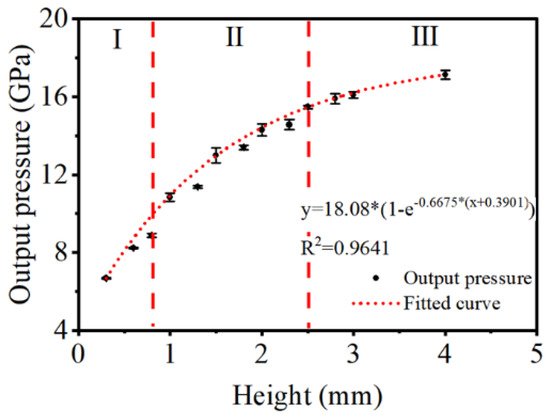
The figure below illustrates the main results of the intercorrelation between output pressure and charge height. The output pressure increases logarithmically with the height and is projected to remain steady at 17~18 GPa. Closer inspection of Figure 5 and Figure 6 show that both velocity and pressure share the same height of reaching stability at approximately 2.5~3.0 mm.

Figure 6. Output pressure as a function of charge height.
In the pressure experiment, after reaching the interface between the LA and PMMA barrier, the front shockwave will decay rapidly and be caught up by the detonation reaction as a consequence of no reaction energy release, which sustains a steady shock profile in PMMA. Therefore, the pressure measured by PVDF gauges corresponds to the CJ pressure, or the maximum pressure generated by detonation reactions.
Taken together, according to data in Figure 5 and Figure 6, we can provide further descriptions of the detonation processes of LA microcharges. First, the detonation reaction starts to accelerate at 0~0.8 mm, as both velocity and pressure rise with height. Second, the detonation attempts to reach a steady state, for there is a significant difference of trend between velocity and pressure. Namely, the velocity peaks at ~1.5 mm, while the pressure increases steadily. Third, stable detonation is formed, as velocity and pressure level off after ~2.5 mm.
4. Particle Velocity Profile of LA Microcharge
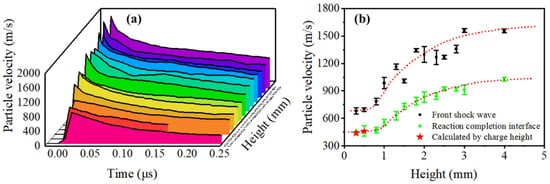
Figure 7a presents an overview of all the particle-velocity profiles at the heights of 0.3, 0.5, 0.8, 1.0, 1.3, 1.5, 1.8, 2.0, 2.3, 2.5, 2.8, 3.0, and 4.0 mm, and each curve is the average of three or more shots. The shape of the profiles is similar to the profile predicted by the ZND model. Slight differences, however, were found between profiles with larger and smaller heights. According to the discussion above, for steady detonations, such as the LA charges with the heights of 2.5, 2.8, 3.0, and 4.0 mm, the shock front (VN spike) and CJ point can be clearly defined and read in the particle-velocity profiles. As for unsteady detonations, such as profiles with lower heights, the shock fronts are not obvious. Interestingly, we can still find the exact point or interface between the reaction zone and Taylor zone in profiles, which does not represent the CJ state but merely the end of detonation reactions. Moreover, the velocity of this interface indicates the propagation of an unsteady detonation reaction directly. Thus, in this paper, both interfaces between the reaction zone and Taylor zone in steady or unsteady detonations will refer to the reaction–completion interface.

Figure 7. (a) Particle-velocity profiles at the heights of 0.3~4.0 mm. (b) Particle velocity of the shock front and reaction–completion interface as function of charge height.
The particle velocity of the VN spike and reaction–completion interface in tests is collected and shown in Figure 7b. The error bars are also given. For unsteady detonation within the height of 0.8 mm, the particle velocity of the reaction–completion interface was obtained by iterative calculations with charge height. Both particle velocity of the reaction–completion interface and the front shockwave increase significantly at the height between 0.8 mm and 2.5 mm, and are expected to remain steady after 3.0 mm, which is in line with results discussed in Figure 5 and Figure 6. The data fluctuation of shock front velocity is more obvious than the experimental data of the reaction–completion interface, stemming from the possible density distribution in microcharges, which is hard to control. It is noteworthy that the particle velocity of the shock front remains unchanged within the height of 0.8 mm, indicating that the initial shock wave does not decay. Furthermore, the particle velocities of the reaction–completion interface within the height of 0.8 mm are also approximately the same.
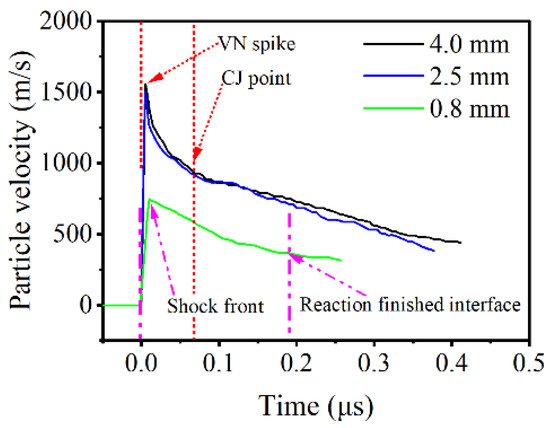
Figure 8 compares the particle-velocity profiles of 0.8 mm, 2.5 mm, and 4.0 mm. The particle-velocity profile at 0.8 mm does not have a VN spike and obvious reaction–completion interface, because the energy released in reactions is not enough to support a steady shock profile. The particle-velocity profiles at 2.5 mm and 4.0 mm have the same particle velocity of the VN spike and CJ point, which indicates that the detonation is stable at 2.5 mm.

Figure 8. Detailed particle-velocity profiles at the heights of 4.0, 2.5, and 0.8 mm.
Taken together, the reaction of LA within the height of 0.8 mm can only be considered as volume explosion, as discussed in previous work [1], for lack of an obvious interface between reaction zone and product-expansion zone and complete detonation profile.
This entry is adapted from the peer-reviewed paper 10.3390/mi13030451
This entry is offline, you can click here to edit this entry!
