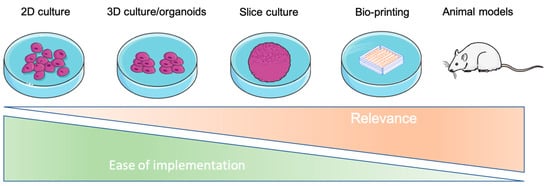
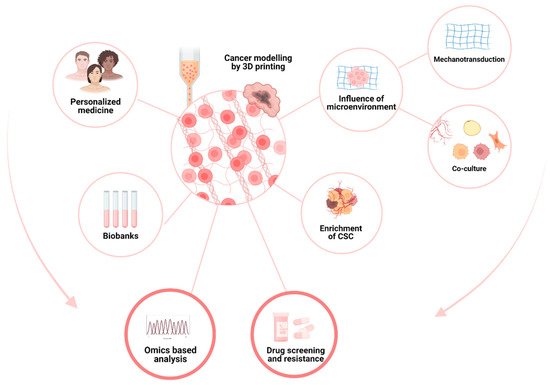
Tumor cells evolve in a complex and heterogeneous environment composed of different cell types and an extracellular matrix. Current 2D culture methods are very limited in their ability to mimic the cancer cell environment. In recent years, various 3D models of cancer cells have been developed, notably in the form of spheroids/organoids, using scaffold or cancer-on-chip devices. However, these models have the disadvantage of not being able to precisely control the organization of multiple cell types in complex architecture and are sometimes not very reproducible in their production, and this is especially true for spheroids. Three-dimensional bioprinting can produce complex, multi-cellular, and reproducible constructs in which the matrix composition and rigidity can be adapted locally or globally to the tumor model studied. For these reasons, 3D bioprinting seems to be the technique of choice to mimic the tumor microenvironment in vivo as closely as possible.
- 3D bioprinting
- 3D printing
- bioink
- cancer
- cell biology
1. 3D Bioprinting at a Glance
1.1. Introduction
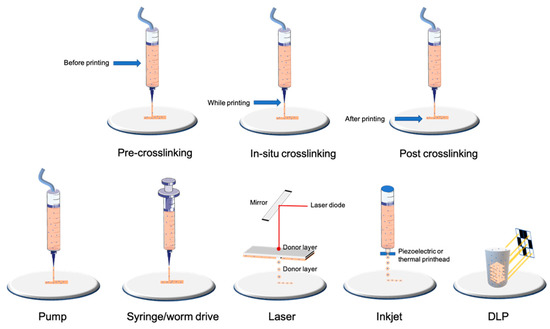
1.2. Bioprinting Technologies
2. Characterization of Cells after Bioprinting
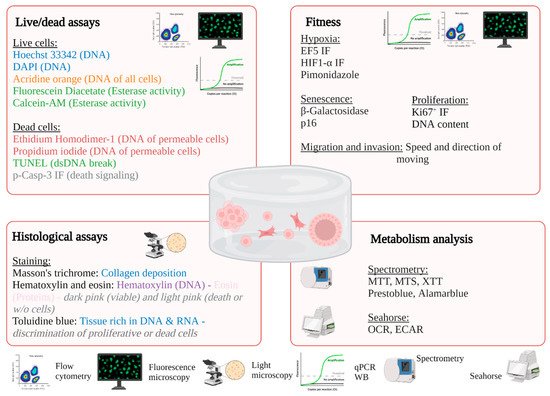
2.1. In Situ Characterization of Cells
2.1.1. Light Microscopy
2.1.2. Fluorescence Microscopy
2.1.3. Electronic Microscopy
2.2. Characterization of Cells after Isolation or Lysis
2.2.1. Molecular Biology
2.2.2. Flow Cytometry
| Methods | Description | Pros and Cons | Markers | REF | |
|---|---|---|---|---|---|
| Microscopy | |||||
| Light | Phase contrast | Monitoring of proliferation and morphology of cells | +: • Nondestructive • No markers are added • Low cost • Easy with transparent gels (GelMA, matrigel) −: • No possibility to identify subcellular structures • Difficult with opaque or non-transparent gels (e.g.,: alginate with nanocellulose) |
Not suitable | [100,101,102] |
| Bright field | The transmission of light is more or less attenuated depending on the density or marking of the sample | +: • Suitable for large samples −: • Requires histological staining • Preparation of sample • Quantification of thick sample |
Hematoxylin–eosin Masson’s trichrome Trypan blue |
[101,102,103] | |
| Fluorescence | LSM Epifluorescence Confocal |
The use of a fluorescent marker is necessary to highlight a subcellular structure; possibility of monitoring structures over time (if vital markers) | +: • Monitoring of many possible structures −: • Requires cutting for oversized constructions for epi and confocal microscopy • Need to fix for certain markers • Important autofluorescence for chitosan or alginate/cellulose hydrogels in UV |
Live/dead staining Or calcein AM/propidium iodide Or ethidium homodimer Active-caspase3/7 green Hoechst 33342 HIF1-α, Ki67 |
[108,109,110,111,144] |
| Electronic | Scanning | Surface is scanned with a beam of electrons, emitted signal provides images | +: • High resolution −: • The preparation procedure is tedious • Frequent preparation artifacts (collapse) |
Not suitable | [102] |
| Transmission | The part of beam of electrons is transmitted into specimens allowed to obtain images | Not suitable | [102,115] | ||
| Flow cytometry | |||||
| Flow cytometry | Analysis of physical parameters (size and granularity) for each cell but also the level of fluorescence | +: • Quantitative analysis −: • Disaggregation can be a problem • Necessity to have a large cell number due to loss of cells during dissociation |
7-AAD CFSE |
[102,139] | |
| Spectroscopy | |||||
| Spectrometry or fluorimetry | Production or utilization of a fluorescent or chromatic compound | +: • Well-described for 2D culture and frequently used • Can be used for kinetic monitoring −: • Ensure that the efficiency is adapted for 3D |
ACP, LDH, prestoblue, alamar blue, DNA content | [112,119,120,121] | |
| Molecular biology | |||||
| RTqPCR Western blot |
Quantification of gene expression at mRNA or protein level | +: • Quantitative analysis • Easier by using the enzymatic method on natural inks (e.g., collagenase for GelMA or ColMA, hyaluronidase for hyaluronic acid) −: •Adaptation of the homogenization and extraction protocol to obtain an adequate quantity and quality of RNA/proteins for analyses |
Bax/Bcl2 HIF1-α, Ki67 |
[103,115,118] | |
| Metabolism | |||||
| GC–MS (Gas chromatography–mass spectrometry) | Detection of molecules of interest according to their mass/charge ratio after ionization | +: • Considerably less cellular material compared to NMR, high sensitivity, −: • Use of radioisotopes, complex sample preparation, high cost |
13C-Glucose | [129,132] | |
| NMR (nuclear magnetic resonance) spectroscopy | Determination of the composition of a sample by applying a magnetic field via the orientation of the nuclear spins of the atoms | +: • High reproducibility, sample can be analyzed directly, low cost −: • Use of radioisotopes, low sensitivity |
[130,131] | ||
| PET scan (positron emission tomography) | Injection of a radiographic tracer and monitoring by imaging to detect localization of [18F]FDG | +: • Classically used in medicine, monitoring over time −: • Low resolution (1.5 mm) |
[18F]FDG | [120,125] | |
| Seahorse | Quantification of the oxygen consumption rate (OCR) and the extracellular acidification rate (ECAR) | +: • High sensitivity (from 5000 cells, theoretically), possibility to test many conditions in parallel −: • Difficulties in normalizing results, limited number of injections, limited sample thickness |
Not suitable | [126,128] | |
2.3. Recapitulate Cancer’s Relation to the Microenvironment
2.3.1. Cells–ECM Interaction
2.3.2. Neoangiogenesis
2.4. Mechanical Environment
2.4.1. Mechanotransduction
This entry is adapted from the peer-reviewed paper 10.3390/ijms23073432