Your browser does not fully support modern features. Please upgrade for a smoother experience.
Please note this is an old version of this entry, which may differ significantly from the current revision.
The possibility of using graphene-based materials as “metal-free” catalysts is attracting enormous interest, since it reduces the need for precious or rare elements currently used in heterogeneous catalysis. However, free standing and perfect graphene is known to be “perfectly inert”, while it is now well established that there is an essential role of defects and dopants in activating its chemical properties.
- graphene
- adsorption
- defect
- heteroatoms
1. Introduction
The possibility of using graphene-based materials as “metal-free” catalysts [1][2] is attracting enormous interest, since it reduces the need for precious or rare elements currently used in heterogeneous catalysis. However, free standing and perfect graphene is known to be “perfectly inert”, while it is now well established that there is an essential role of defects and dopants in activating its chemical properties.
Researchers mention that graphene defects are generally classified as intrinsic and extrinsic. The former includes structural defects (vacancies, carbon adatoms, Stone–Wales defects, grain boundaries), while the latter results from the introduction of heteroatoms, often leading to doping of the layer. Intrinsic defects are prone to be active sites for the insertion of foreign atoms to form extrinsic defects due to the strain energy in the C–C bonds involved. Therefore, the term “defect” will refer generically to both categories, while the specific kinds of defects will be specified whenever necessary.
Various types of intrinsic defects may be present in graphene layers, such as point defects, large vacancies, line defects, and Stone–Wales. Their presence alters the perfect pi-conjugated electronic structure of the C-lattice and hence exposes reactive carbon atoms. Indeed, in some cases, STM images showed an enhanced local density of states at the defects [1]. They are thus responsible for the chemical properties of graphene. Atomic-scale defects were initially considered random imperfections, but nowadays the improved performance of last-generation high-resolution microscopies allows a realistic view of the different types of defects. e.g., Figure 1 shows some typical metastable defects commonly appearing in the graphene network.

Figure 1. HRTEM images show different kinds of defects in graphene sheets. (a) Unperturbed lattice. (b) Stone–Wales (SW) defect with atomic configuration superimposed. This topological defect involves the rotation of carbon–carbon (C–C) bonds by π/2 causing the transformation of four hexagons into two heptagon–pentagon pairs). (c) Reconstructed vacancy with the atomic configuration; a pentagon is indicated in green. (d) Defect image and configuration comprising four pentagons (green) and heptagons (red). The scale bar corresponds to 2 Å. Reprinted and adapted with permission from [2]. Copyright 2008 American Chemical Society.
An increasing number of recent theoretical papers suggest the possible role of graphene vacancies [3], divacancies [4], Stone–Wales defects [5] and heteroatoms [6][7] in the chemical properties of single-layer graphene (SLG). Indeed, they are expected to modify its electronic structure and to allow for chemisorption of atoms [3] and simple molecules [4] (e.g., hydrogen [8], oxygen [5], CO and CO2 [9]) and for a more efficient functionalisation [10], thus turning nearly chemically inert graphene into an active player in chemistry, catalysis and sensoristics [11][12].
An overview of the calculated adsorption energy of the different elements at single vacancies of freestanding graphene is shown in Figure 2. The adsorption energies are relatively high for all the elements, with the only exception being noble gases.

Figure 2. Adsorption energy (in eV/atom) for atoms at single vacancies of graphene calculated using WdW—DF2. Data were taken from Ref. [3].
Similarly, at divacancies, strong adsorption is expected for O2, N2, B2, and CO molecules, for which adsorption energies of −8.44 eV, −4.53 eV, −13.83 eV, and −3.86 eV, respectively, are predicted [4].
These studies prove that unsaturated C bonds at single and double vacancies are potentially reactive sites for the adsorption of atoms and the chemisorption and possible dissociation of molecules. However, theoretical studies often consider freestanding unsupported graphene, or neglect the interaction between the vacancy and the substrate. Such an oversimplification can, unfortunately, lead to wrong predictions since the role of the substrate must be taken into account in the description of the whole system.
A paradigmatic example in this respect is offered by comparing the reactivity of single graphene vacancies (VG) towards water for G/Cu(111) and G/Pt(111) [13] (Figure 3). In both cases, the dangling C bond initially saturates towards the metal substrate. On G/Cu(111), water can break this C−Cu bond by dissociating at the under-coordinated carbon atom of the vacancy. Both partial and complete dissociation are exothermic, with calculated energies of −0.38 eV/molecule and −1.54 eV/molecule, respectively. A different behaviour is predicted for the stronger Pt–C bond, for which dissociation energies of +0.69 eV/molecule and −0.16 eV/molecule are predicted for the first and second O–H bond breaking. Therefore, according to the theoretical prediction, water splitting should occur effectively only at G/Cu(111) vacancies.
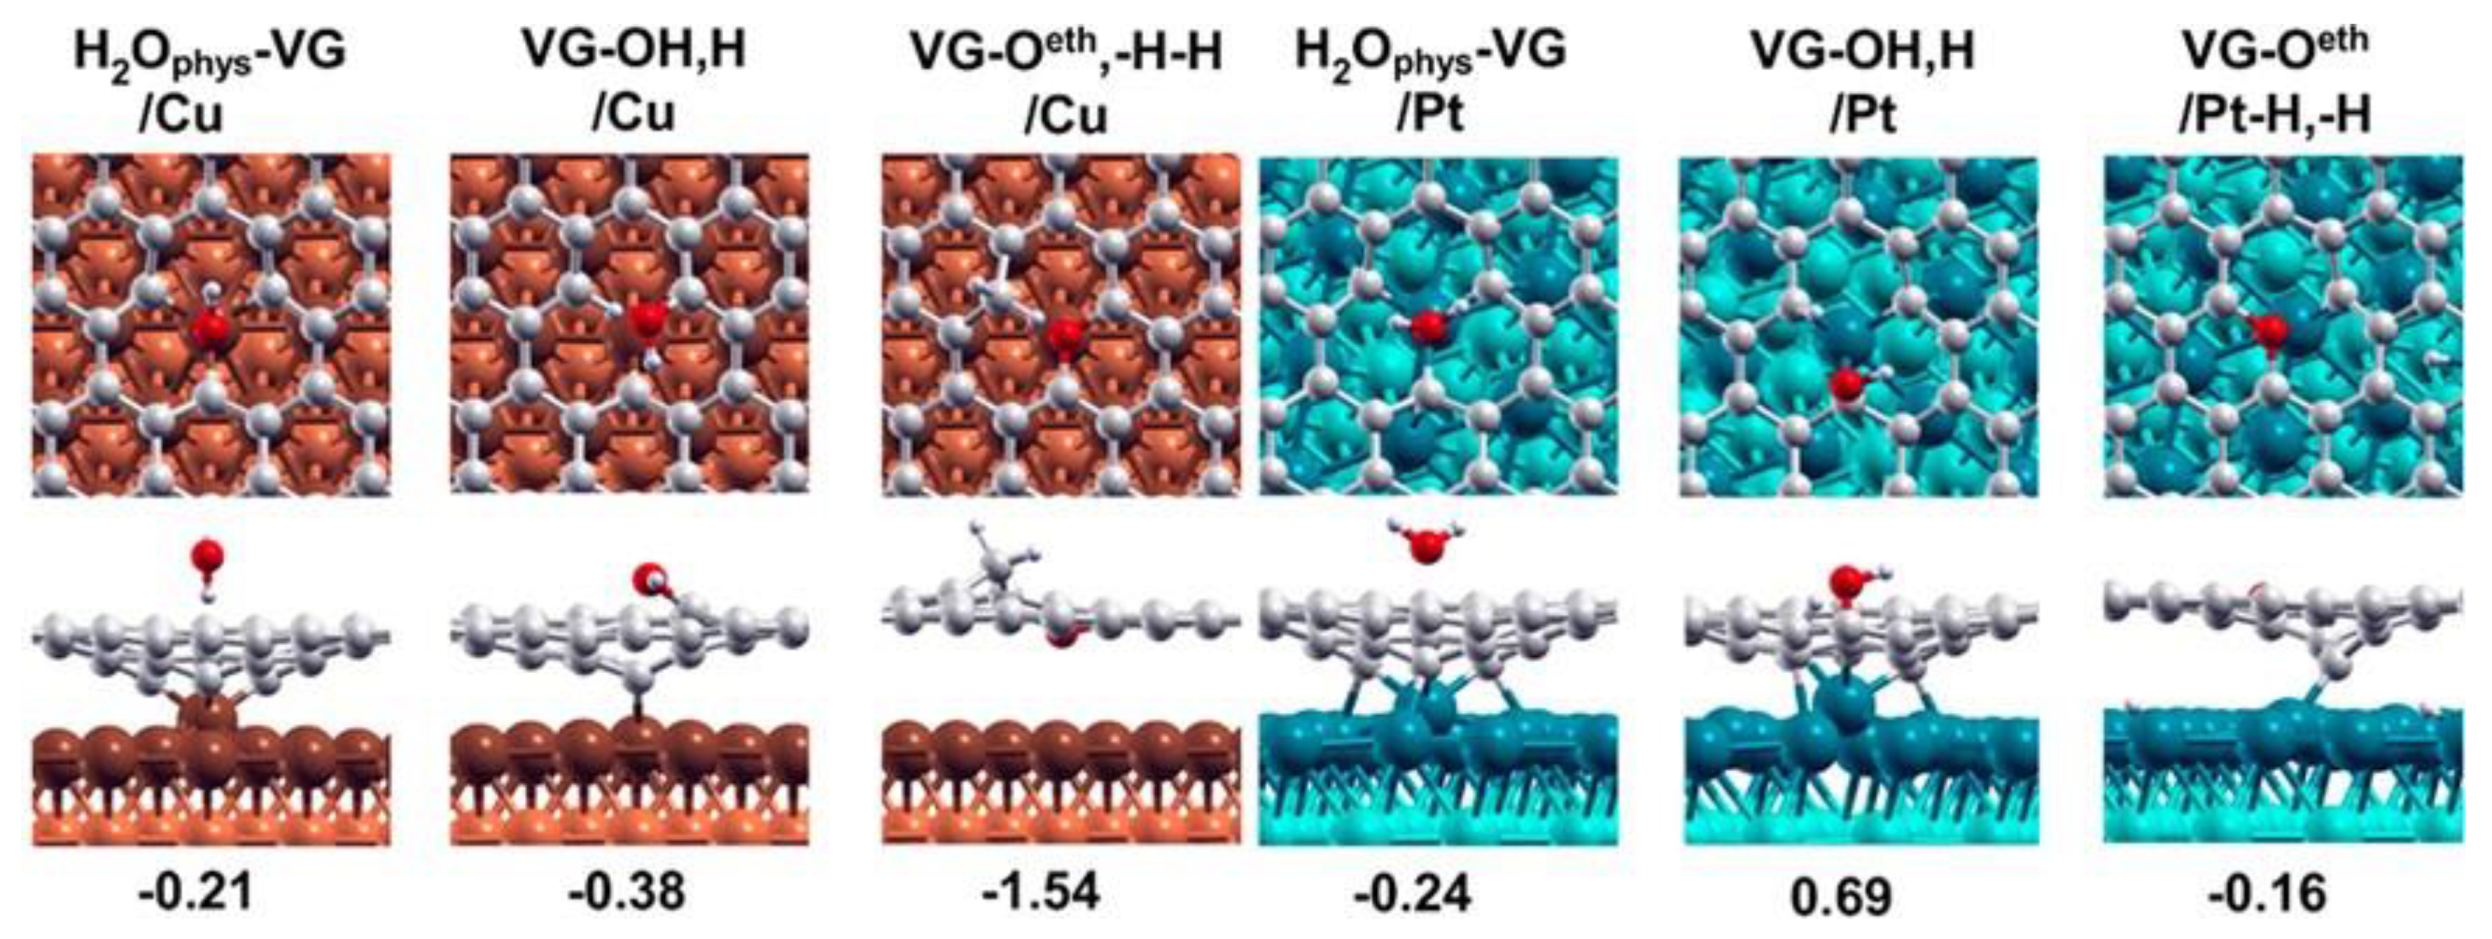
Figure 3. Most stable products along the dissociation path of H2O for (orange, left) VG/Cu and (light blue, right) VG/Pt interfaces. From left to right: physisorbed state, first dissociation (−OH/−H), and complete dissociation (−O/−H/−H). Reprinted and adapted with permission from Ref. [13]. Copyright 2017 American Chemical Society.
In general, it is also not trivial to determine whether adsorption occurs at the vacancy above the graphene layer or at the interface between it and the substrate. The outcome depends on the relative strength of the C-substrate, C–molecule/fragment and substrate-molecule/fragment bonds and on the energetic cost of intercalation, which can be relevant when graphene is strongly interacting with the substrate. e.g., Figure 4 compares the result of ab initio calculation for the dissociation of water at graphene vacancies of freestanding graphene (upper row) or of a G layer supported on TiO2. In the latter case, the water molecule may be above the vacancy (medium row) or at the VG/TiO2 interface (lower row). In the presence of vacancies, it is apparent that the dissociation of water is mainly exothermic, both at the graphene layer (by −4.32 eV/molecule) and at the interface (by −4.29 eV/molecule), so that both processes are permitted from the thermodynamic point of view.
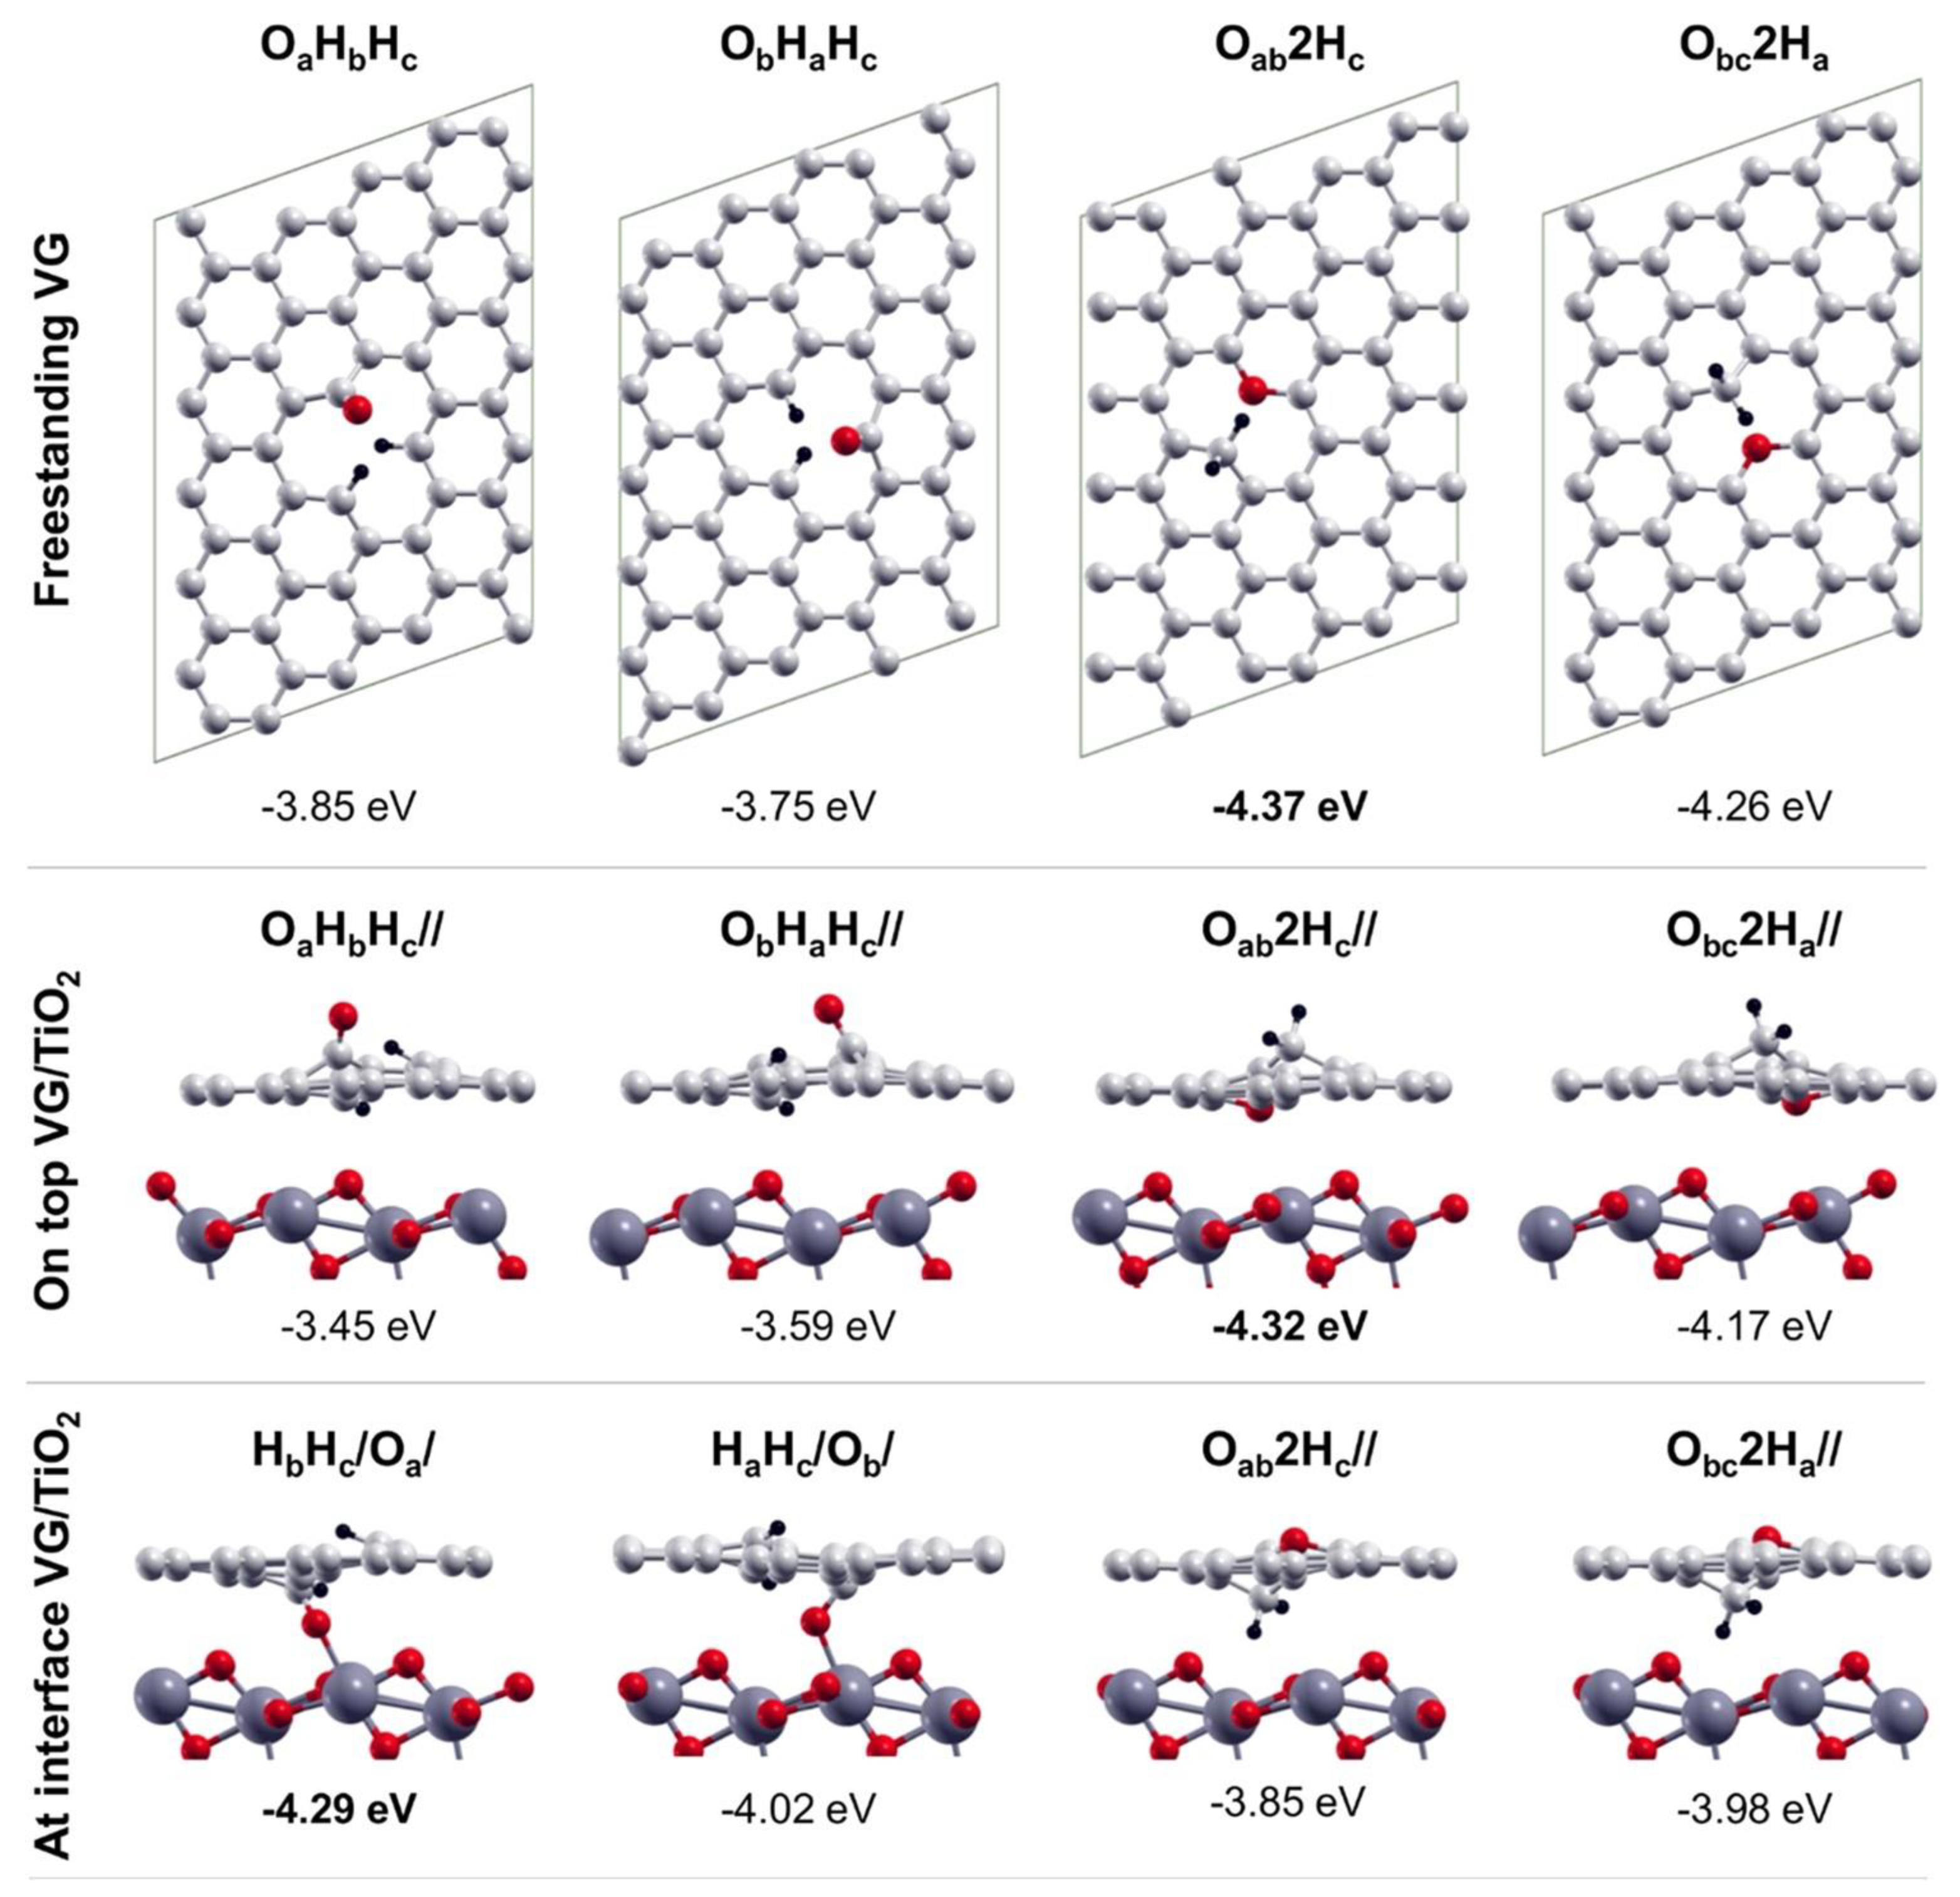
Figure 4. Top views of the fully dissociated products of water on freestanding VG (top line); side views of the fully dissociated products of water (O + H + H) on top of VG/TiO2 (middle line), and at the interfaces of VG/TiO2 (bottom line). Small red, light grey, and black balls represent O, C, and H atoms, respectively. Big dark grey balls represent Ti atoms. Reprinted with permission from Ref. [14]. Copyright 2018 American Chemical Society.
Despite a large amount of theoretical data, only a relatively low number of experimental studies investigated the adsorption of simple molecules at graphene defects. The reason for this lies in the experimental difficulties to obtain a well-defined majority defect.
For example, low energy ion bombardment is a widely available tool to produce defects in single-layer graphene, but different kinds of defects can be generated depending on the mass, energy, and angle of incidence of the ion.
The simulation of the effect of impact of an inert gas ion on graphene is reported in Figure 5, which shows low ion energy should be used to produce mainly single vacancies, but that production of some double vacancies cannot be excluded. This prediction is confirmed experimentally in the case of G/Pt(111): upon bombardment with 140 eV Ar+ ions, a majority of single vacancies [15] and also divacancies [16] are produced. With increasing energy, more complex defects are produced and significant damage to the substrate must also be taken into account. e.g., H+ and N+ implantation into 6H–SiC (0001) was observed using 100 keV ions [17].
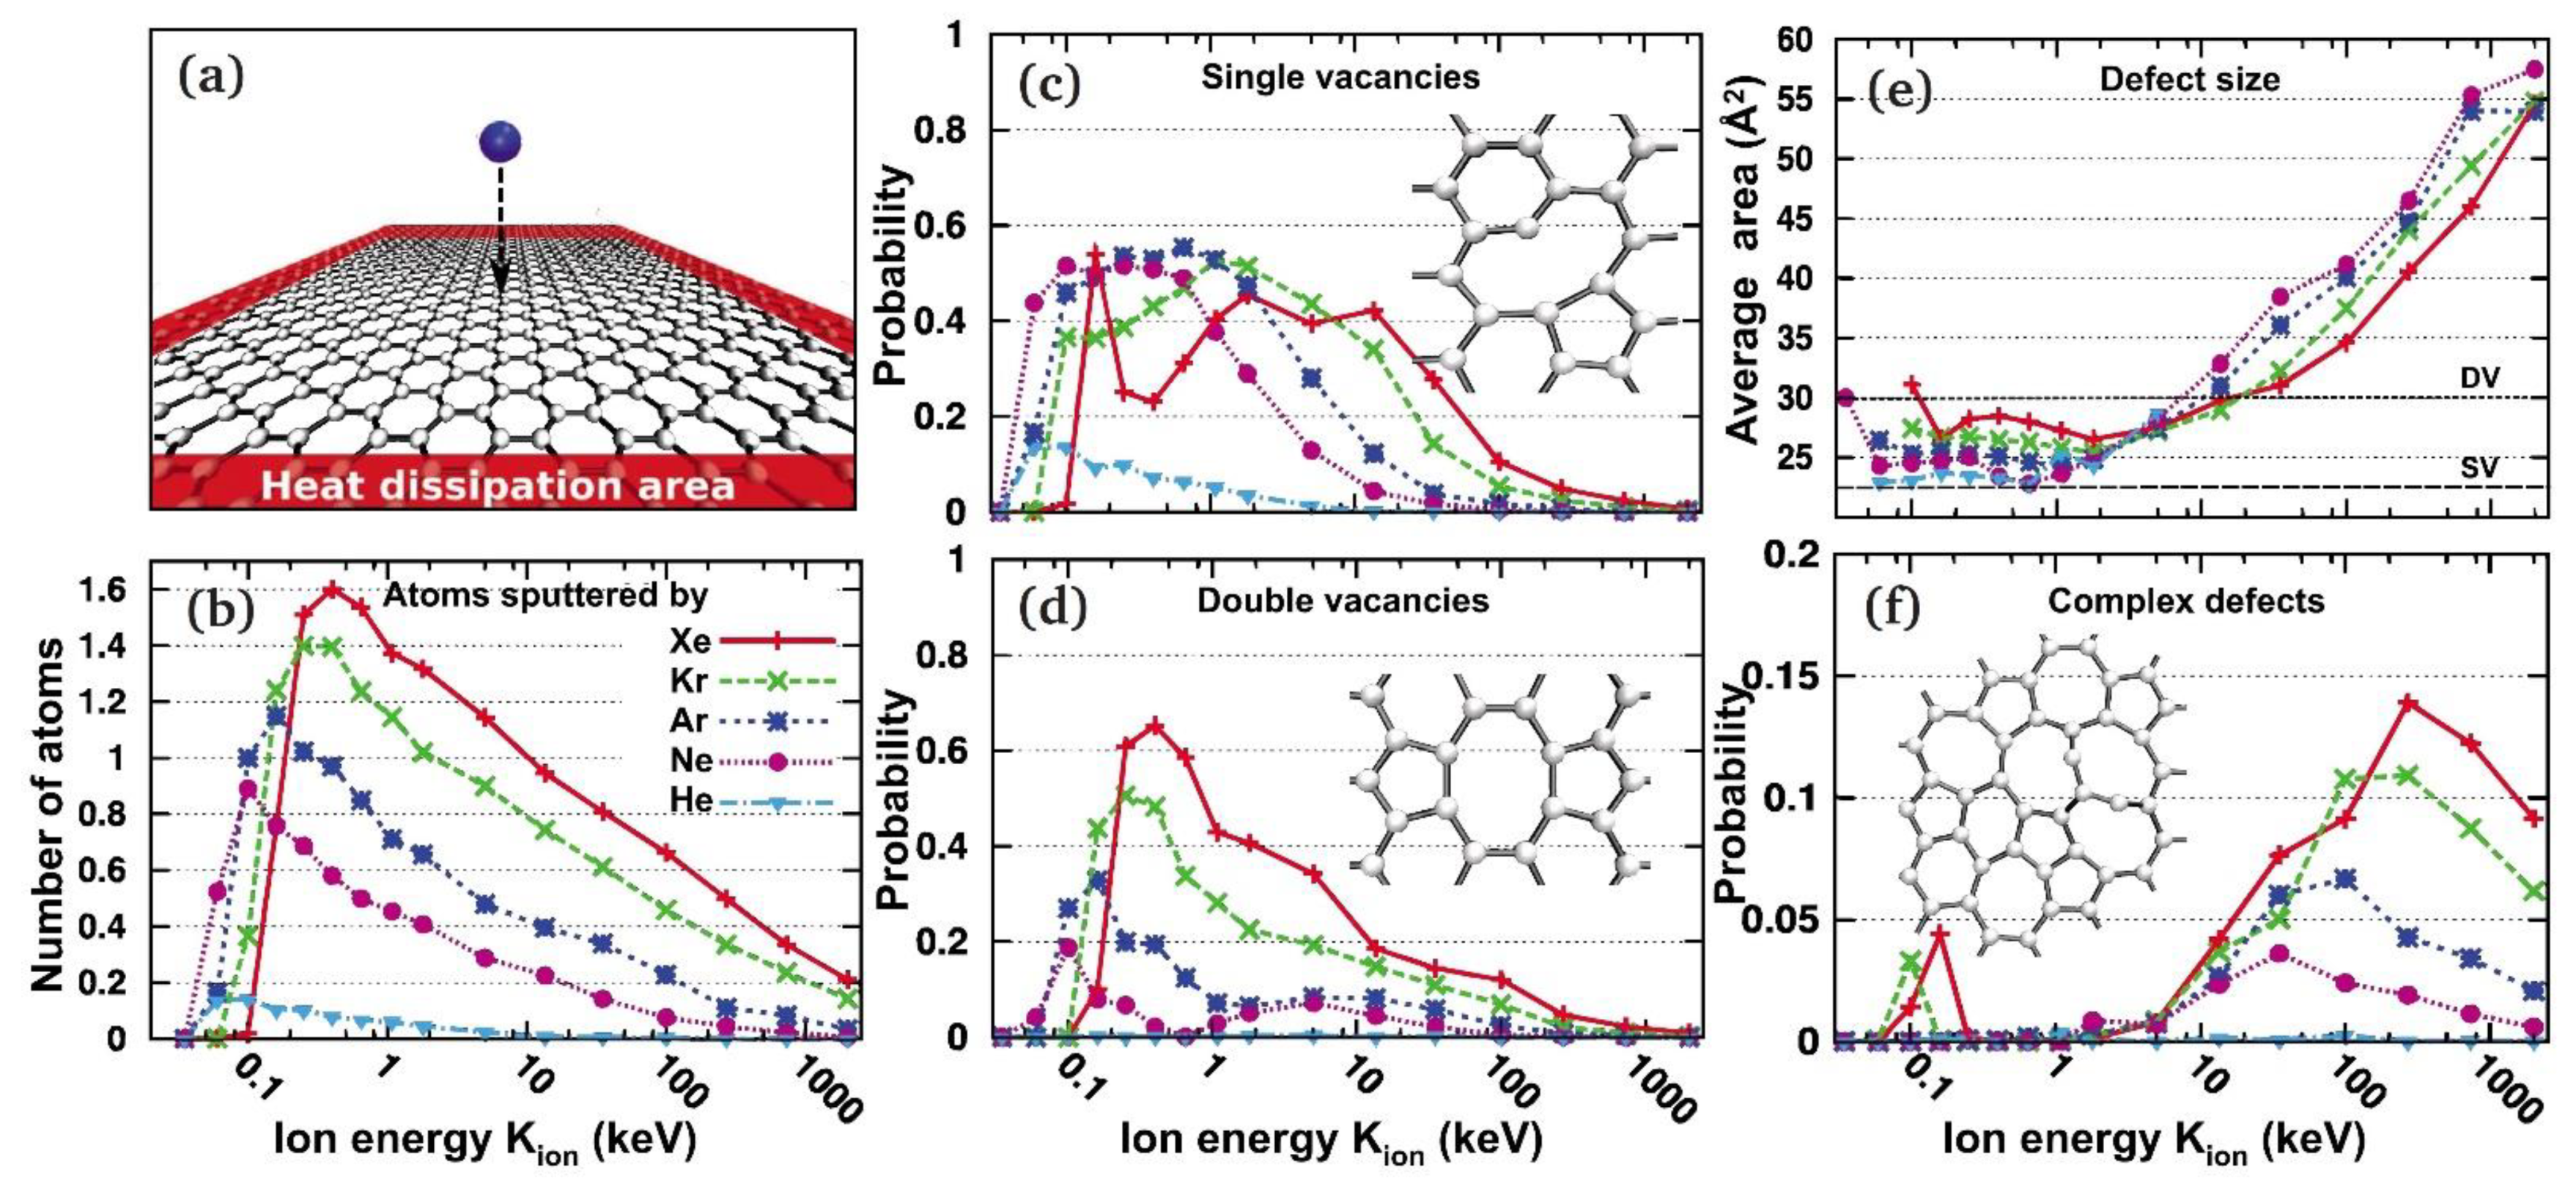
Figure 5. Production of defects in graphene under ion irradiation as revealed by the analytical potential molecular dynamics. (a) Simulation setup. (b) The number of sputtered atoms per ion impact as a function of ion energy. (c,d) Probability for single and double vacancy formation as a function of ion energy. The insets show the atomic structures of the reconstructed vacancies. (e) Average area covered by a single defect (when formed)—typically still an sp2-bonded network of carbon atoms. The areas corresponding to an SV and DV are marked. (f) Probability for creating defects other than SV/DV. Reprinted with permission from Ref. [18]. Copyright 2010 by the American Physical Society.
2. Reactivity at Graphene Vacancies
Structural defects can be introduced in graphene, during or after the growth, by ion or electron bombardment of the G layer or by chemical oxidation [19]. An intrinsic difficulty when studying how structural defects affect graphene’s electronic and chemical properties is to determine if a majority defect has been produced and to identify and quantify it. For example, Costa et al. [20] probed experimentally the influence of the defect concentration on the fluorination reaction of mono and bilayer graphene supported on SiO2/Si. Defects were induced by plasma treatment and quantified by Raman spectroscopy, but the authors admit that their nature is not well defined and that “the defects prepared by oxygen plasma represent “typical” defects found in typical graphene samples.” They conclude that the fluorination rate is poorly affected by the concentration of defects for SLG, while for the bilayer, a lower degree of fluorination is observed at low defect concentration, which increases for the more defective samples. The presence of two competitive mechanisms rationalises the observed results as follows: on one side, defects make graphene more reactive, on the other side the reactivity of specific defects also plays a role.
The influence of defects produced by Ar+ plasma on the chemical functionalisation of single-layer G was also investigated by Xiao-Liang et al. [10], who developed a geometrical model to correlate the defects density (nd) to the adsorption of aryl radicals on the surface. The exact nd value of each SLG was determined from the intensity ratio of the D and G bands in Raman spectra. Functionalisation of these layers was then performed via diazonium salt-promoted radical addition reactions from solution [21][22]. The presence of covalently grafted pyridinyl groups was proved by correlating the number of defects with the intensity of specific N 1s and C 1s peaks at 400.0 eV and 286.1 eV, respectively, assigned to the pyridinyl group and sp3-hybridised carbon. This behaviour confirms that the presence of the defects can enhance the reactivity of SLG toward chemical functionalisation.
Theoretical calculations [13][23] and vibrational spectroscopy [24] have demonstrated that water can dissociate at defect sites on graphene, forming C−H and C−OH bonds. Feng et al. [25] investigated the effect of water, oxygen, hydrogen, and ammonia adsorbing and reacting on G/Ru(0001) and G/Cu(111) by STM. On Ru(0001), water easily attacks the line defects of graphene and splits it into multiple fragments already at 90 K, opening a pathway for water intercalation. On Cu(111), the effect of water is milder, indicating that there is a strong influence of the substrate chemical nature on reactivity of the C–C bonds in epitaxial graphene. Surprisingly, the other molecules investigated did not show such effects.
While the studies mentioned so far did not focus on a punctual and specific defect, some efforts have been made to produce surfaces with a well-defined, majority defect, the simplest of which is the single vacancy produced by sputtering, as mentioned above [18].
Li et al. [26] investigated the reactivity of graphene vacancies on Ru(0001) by low energy ion scattering (LEIS). Vacancies were created by low energy (around 50 eV) Ar+ bombardment. The sample was then exposed to O2 at room temperature (RT). Figure 6 compares LEIS spectra recorded after dosing O2 on pristine G/Ru(0001) (a) and on G after mild sputtering of the surface for 3 min (b). The new peak appearing at 2580 eV corresponds to the oxygen single scattering peak (SSP), while the area of the carbon peak does not change. Such a spectrum indicates that randomly distributed single vacancies are present at the surface of graphene and that adsorbed oxygen sits on or near the defect. Subsequent annealing to 600 K for ten minutes (spectrum c) causes the disappearance of the oxygen peak and the increase of the Ru signal. This indicates that oxygen either desorbs or diffuses underneath, reducing the shadowing effects on the Ru sites near the G vacancy.
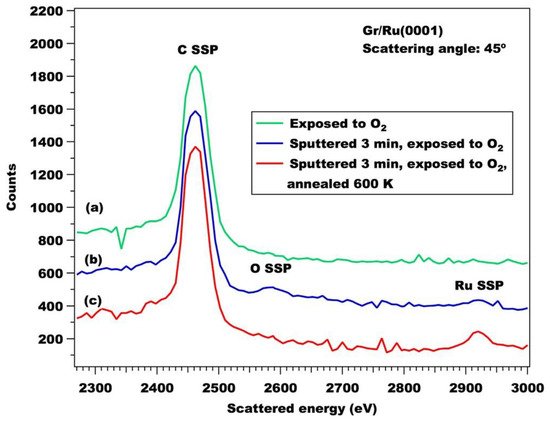
Figure 6. 3000 eV He+ LEIS spectra collected at a scattering angle of 45° from (a) as-prepared Gr/Ru(0001) exposed to 8000 L of O2 at 300 K, (b) Gr/Ru(0001) pre-sputtered for 3 min and then exposed to 1500 L of O2 at 300 K, and (c) after annealing spectrum (b) to 600 K for 10 min. Taken with permission from [26]. Copyright by Elsevier.
The identification of the adsorption site for the ad-molecules is, in general, not trivial; it is indeed difficult to determine whether adsorption takes place at the vacancy or on the underlying substrate. In the case of CO adsorption on G/Ni(111), another system characterised by strong interaction with the substrate, it was possible to conclude that the molecule adsorbs below the vacancy site based on vibrational analysis. Figure 7 shows HREEL spectra (red) recorded after dosing CO on G/Ni(111) (A) and on G/Cupolycrystalline (B) [27]. For each system, the figure compares the spectra recorded on the pristine and on the defected sample (indicated as G*). Mainly single vacancies were produced by 150 eV Ne+ sputtering. CO exposure at RT causes the presence of additional peaks at 52 meV, 237 meV and 253 meV on the defected G*/Ni(111). Such losses are ascribed to the molecule–surface vibration and to the internal C–O stretch mode for CO at bridge and atop sites, respectively, and they are compatible with those reported for CO adsorbed on Ni(111). Notably, they do not show up for G*/Cu, even after exposure to CO at 90 K, thus ruling out that the lack of CO related features at RT is due to lower adsorption energy. It has to be ascribed to a real inertness of the surface.
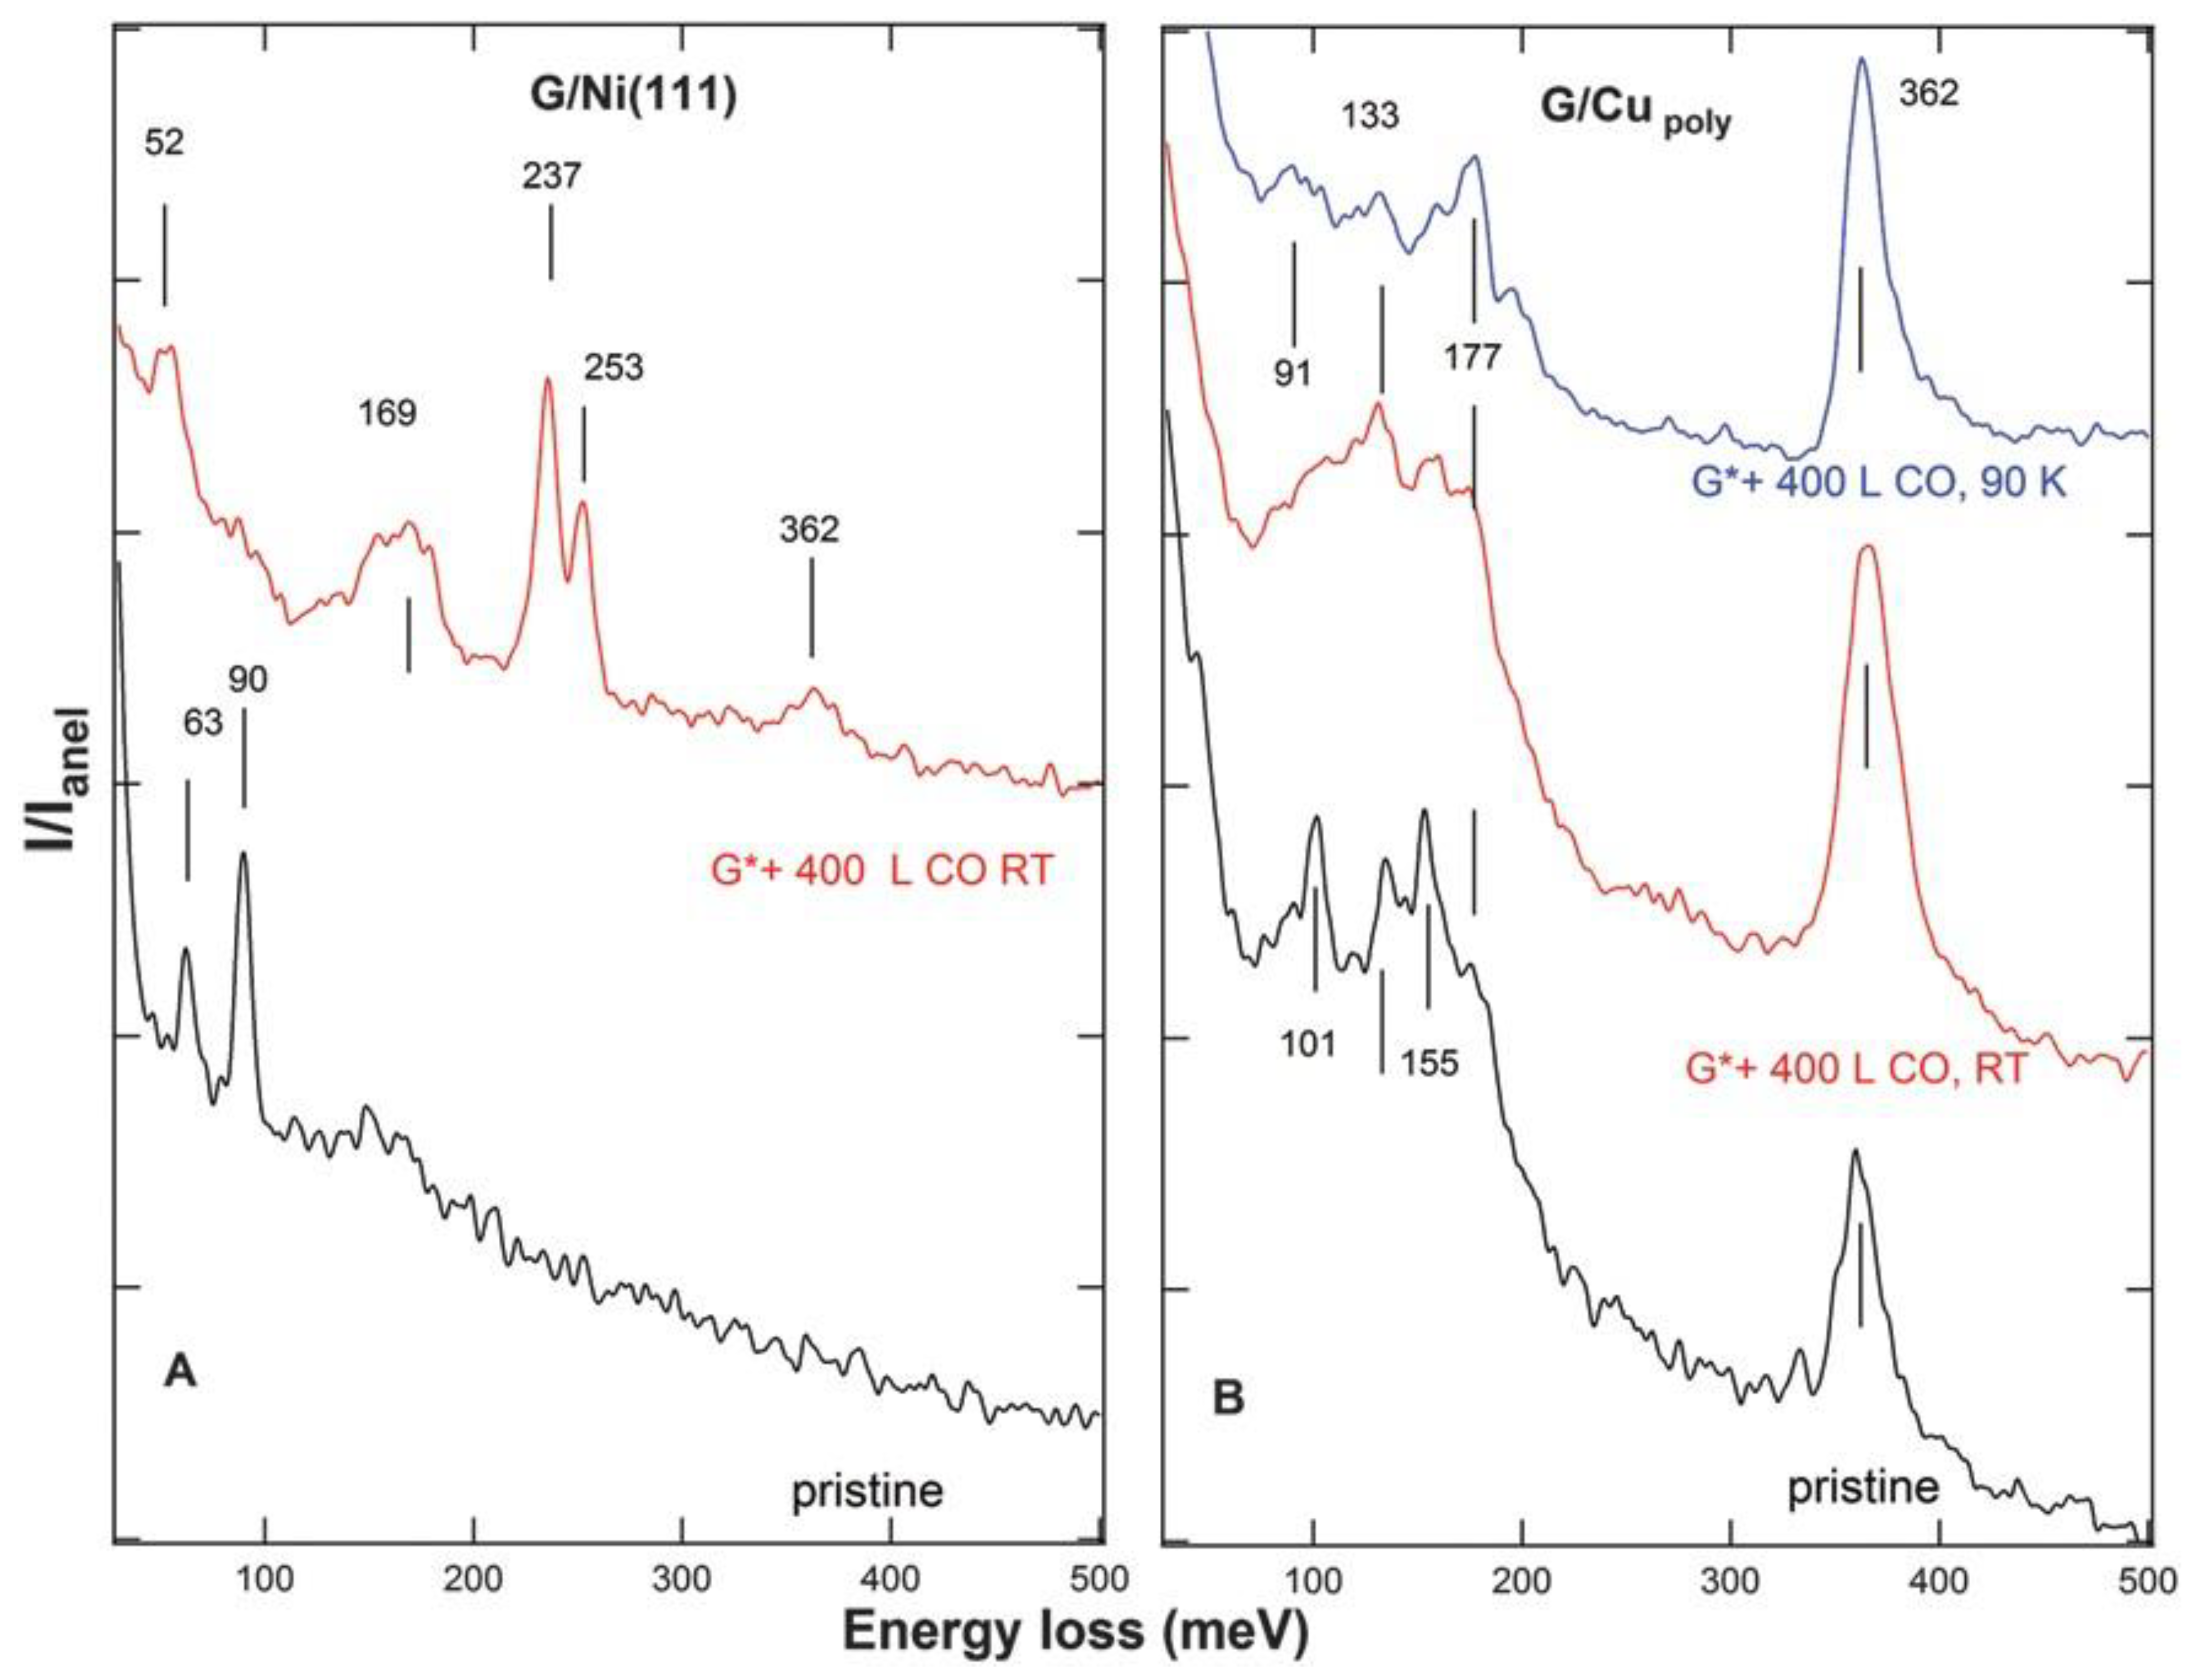
Figure 7. HREEL spectra of G/Ni(111) (panel (A)) and G/Cupolycrystalline (panel (B)). The bottom traces (black) refer to the pristine samples, the top ones to the layer after sputtering (χNe+ = 3.2 × 10¹⁴ Ne+/cm2) and exposure to 400 L of CO at RT (red, (A,B)) ad at 90 K (blue, (B) only). Reproduced from Ref. [27] with permission from the Royal Society of Chemistry.
Therefore, this result indicates that CO ad-molecules are not just adsorbed at the vacancy but that the presence of the vacancy enables them to chemisorb on the reactive Ni(111) substrate. If the vacancy itself were reactive, adsorption would take place also for G*/Cu, contrary to experimental evidence.
This conclusion is supported by a recent combined experimental and theoretical study demonstrating the occurrence of CO intercalation through vacancies following exposure in the mbar pressure range; in this case the process is more efficient if the G layer is doped with N atoms [23]. Almost in parallel, in-operando experiments revealed that intercalated CO reacts undercover to produce CO2 via the Boudouard reaction [28].
Artificially created defects can be used for functionalisation. Besides the example of functionalisation with aryl radicals mentioned above [10], researchers mention that C vacancies produced by low energy Ar+ bombardment on G/SiC(0001) can adsorb p-aminophenol (p-AP), a model molecule with an aromatic ring and two different ending groups (see Figure 8a–c for STM images and Figure 8d–f for the corresponding models) [29]. The change in the line scan profile across the vacancy upon absorption is shown in Figure 8g, while Figure 8h reports the XPS spectrum of the N 1s region recorded after exposure to p-AP. The presence of a peak at 399.5 eV on the defected layer demonstrates p-AP adsorption through its nitrogen atom in a substitutional site of the graphene network. Even if pure N in a graphitic network is expected at 400.5 eV [30], it remains bonded to the p-AP molecule in an sp3 configuration, causing a decrease in the binding energy.
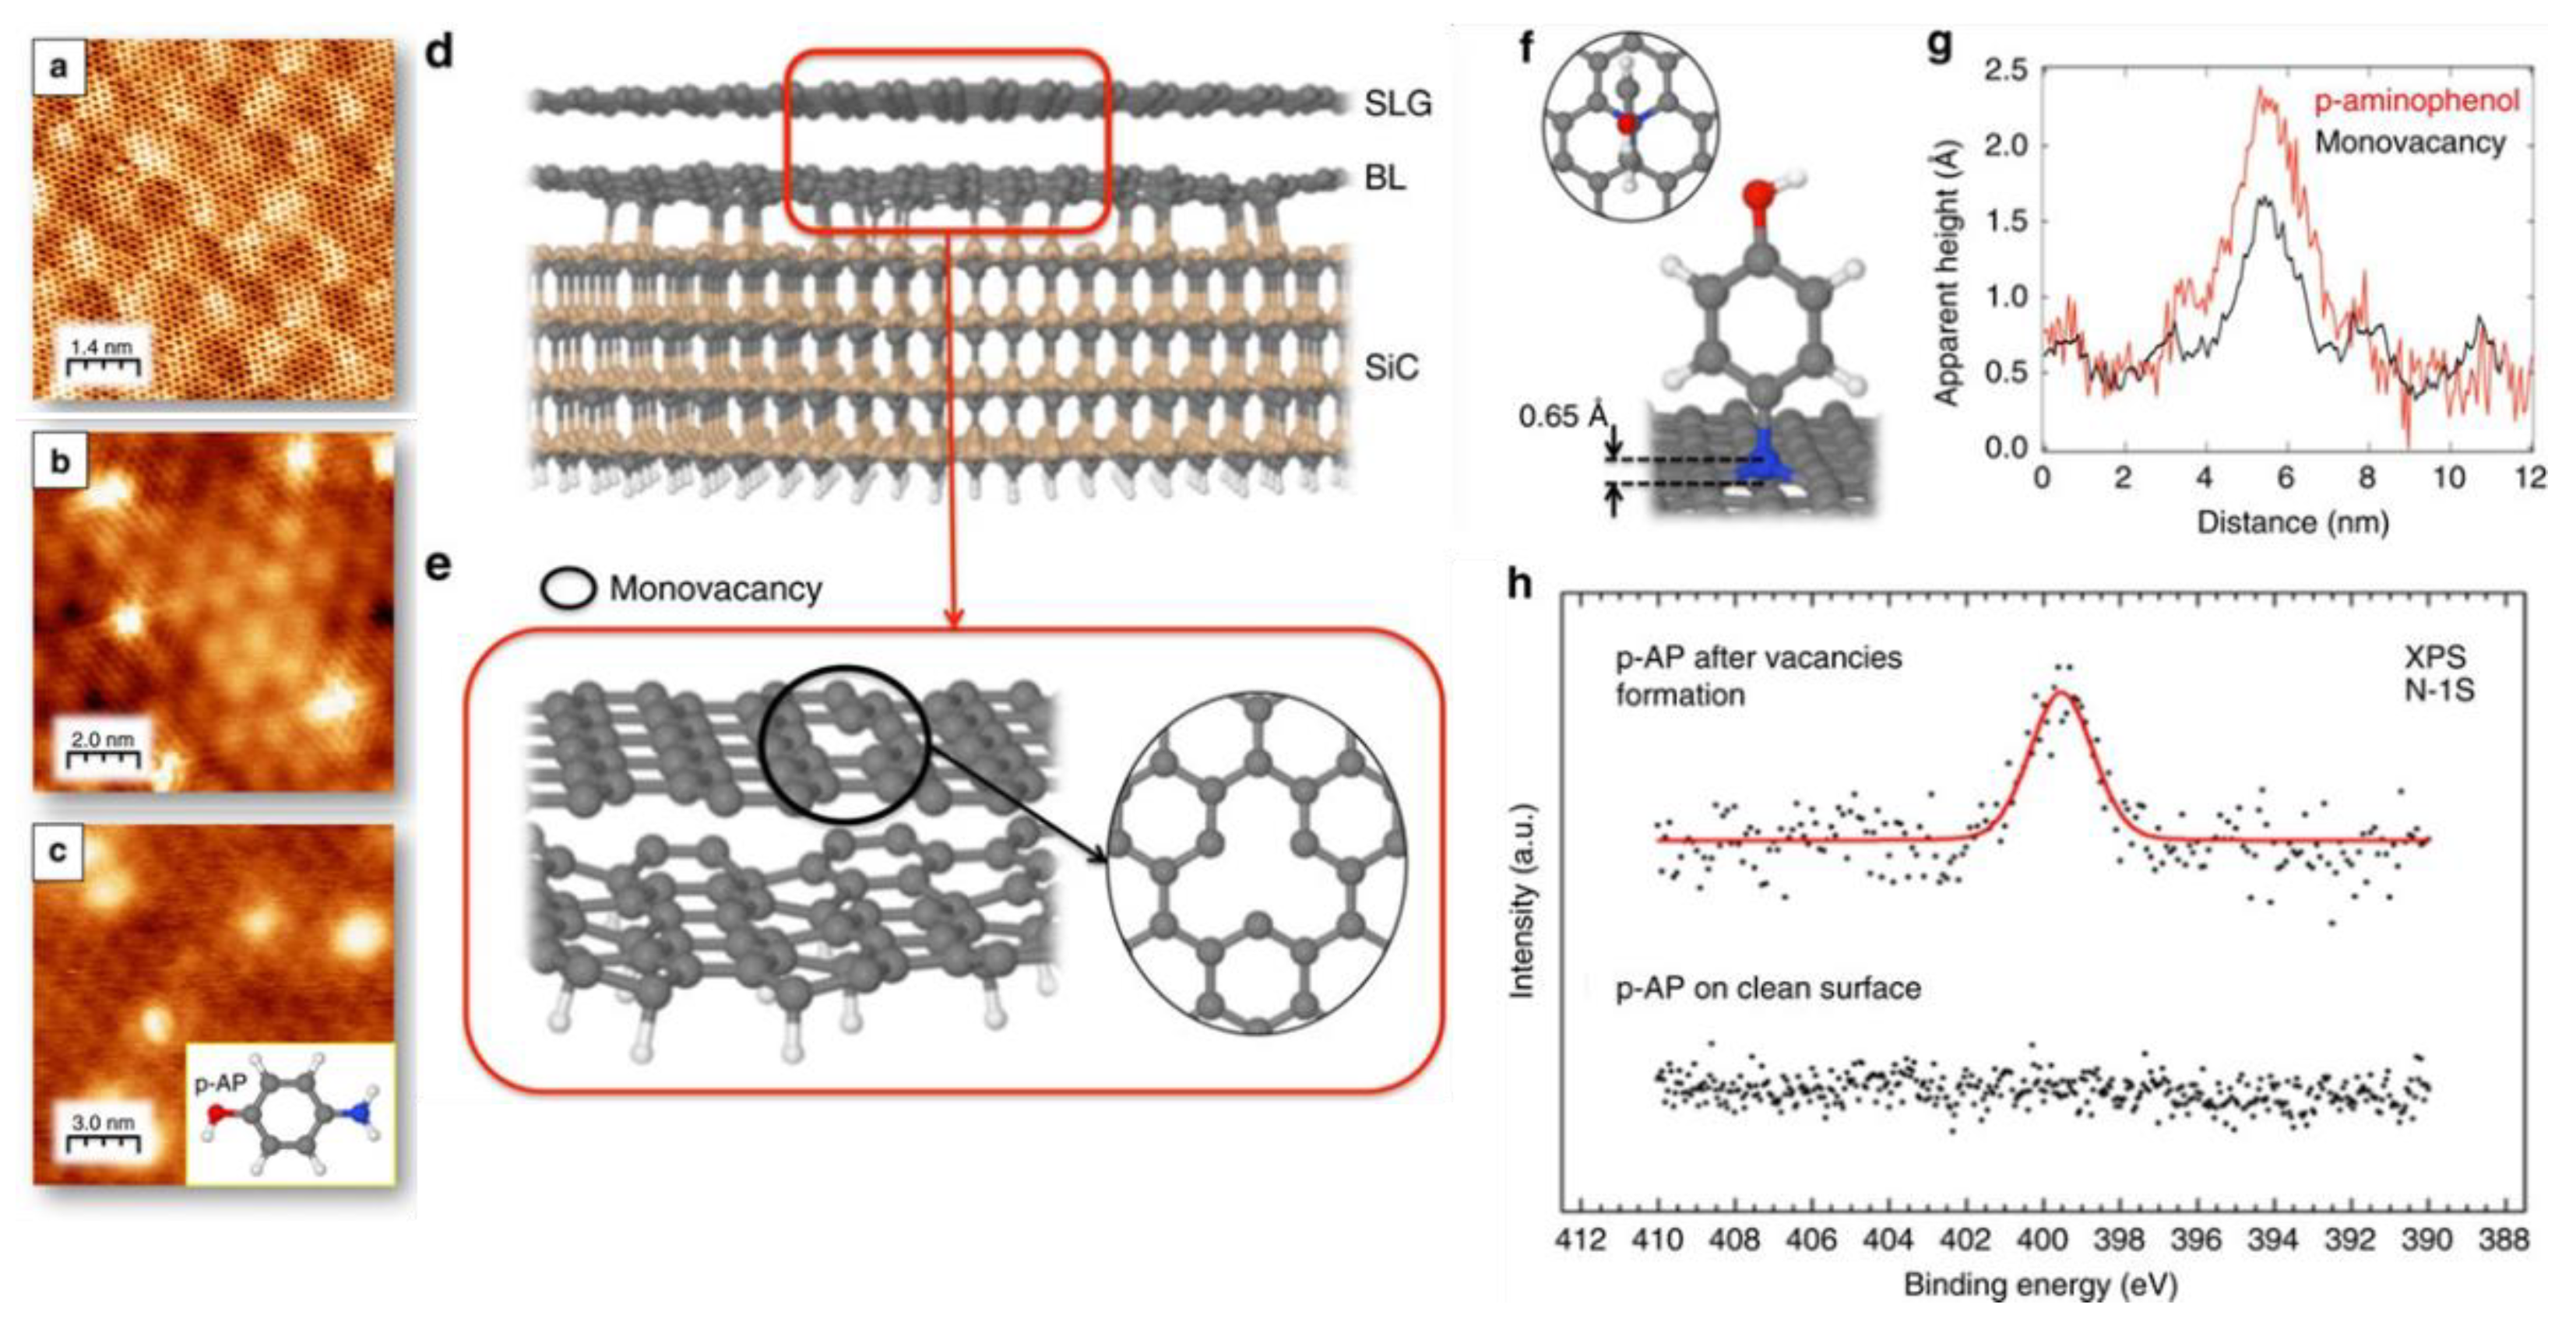
Figure 8. (a) Atomically resolved STM image of the (6 3 × 6 √3)R30° reconstruction of the single-layer epitaxial graphene grown on SiC(0001) (I = 0.36 nA, V = −510.9 mV). (b) STM image of single-atom vacancies formed upon Ar+ irradiation on the surface. (I = 2 nA, V = −289mV) (c) STM image obtained after exposing defected layer to 4L of p-AP (I = 0.09 nA, V = −1240 mV). (d) Pictorial representation of a fully relaxed model of 4H-SiC(0001) SLG/(6√3 × 6√3)R30° unit cell. (e) The optimised model’s top and side views for a single vacancy created within a SLG on a graphene buffer layer. In this model, the anchoring points between the graphene buffer layer and the SiC(0001) are saturated with H atoms with respect to the model shown in (d). (f) Top and side views of the optimised geometry of a doubly dehydrogenated p-AP molecule with the nitrogen atom integrated into the SLG lattice within a single vacancy. Average perpendicular to the surface distance between the nitrogen atom and the SLG is also shown. (g) Typical STM Profiles on images (b,c), along with a single-atom vacancy and a p-AP anchored molecule, respectively; (h) N 1s core-level spectra after dosing p-AP on an SLG surface without and with atomic vacancies. The N 1s binding energy corresponds to a C atom substitutional in the graphene network. Caption and figure were taken with permission and adapted from [29] Copyright 2017 by Springer Nature.
3. Reactivity in the Presence of Heteroatoms
An effective method to influence the chemical reactivity of graphene consists of the controlled introduction of foreign atoms (heteroatoms) in the carbon lattice. This chemical doping method has the advantage of forming highly stable compounds, as the heteroatoms bind covalently to the graphene. It is also quite efficient, as a low doping concentration is sufficient to dramatically influence the properties of graphene.
Though a detailed description of the doping methods is beyond the scope of the present document, researchers mention that, recently, the following methods were developed to produce doped graphene layers: low energy ion implantation [32], CVD [33], thermal annealing [34], arc discharge [35], plasma treatment [36][37], solvothermal [38] and hydrothermal [39][40] methods. Strategies were also developed to obtain materials with mono-dopants [41] or co-dopants [42][43][44][45].
The most common non-metallic elements used as heteroatoms are those of the III (B) and V (N, P) groups [46], though some papers reporting about doping with S also appeared in the literature. N-doped samples are probably the most investigated samples.
Figure 9 compares the reactivity of a single layer of G/Ni(111) pristine or doped with N heteroatoms introduced in the layer by low energy N2+ bombardment. HREEL spectra, recorded after exposing CO on the pristine sample at 87 K under controlled UHV conditions, show losses at 48 meV, 97 meV, and 260 meV (Figure 9a, bottom trace). They were assigned to the CO-graphene stretch, to some water contamination and to the internal CO stretch, respectively. In the presence of N heteroatoms, no CO adsorption is detected at RT under UHV conditions (Figure 9a, red, middle trace), while an additional feature appears at 237 meV after exposure at 87 K (Figure 9a, top traces) [47]. Therefore, researchers can identify the 256 meV and 237 meV losses with CO molecules adsorbed at regular graphene sites or at/close to the heteroatoms, respectively. The thermal evolution of the CO-stretch region is reported in panels b and c. It is clear that the 256 meV species desorbs at a lower temperature than the one related to N-doped sites. Therefore, there is no doubt that the presence of N causes the appearance of a more strongly bound CO moiety [48]. Assuming a pre-factor value for desorption of 1013 Hz, the adsorption energy in the low coverage limit was estimated to be ~0.85 eV and ~0.54 eV for N-doped and regular graphene sites, respectively.
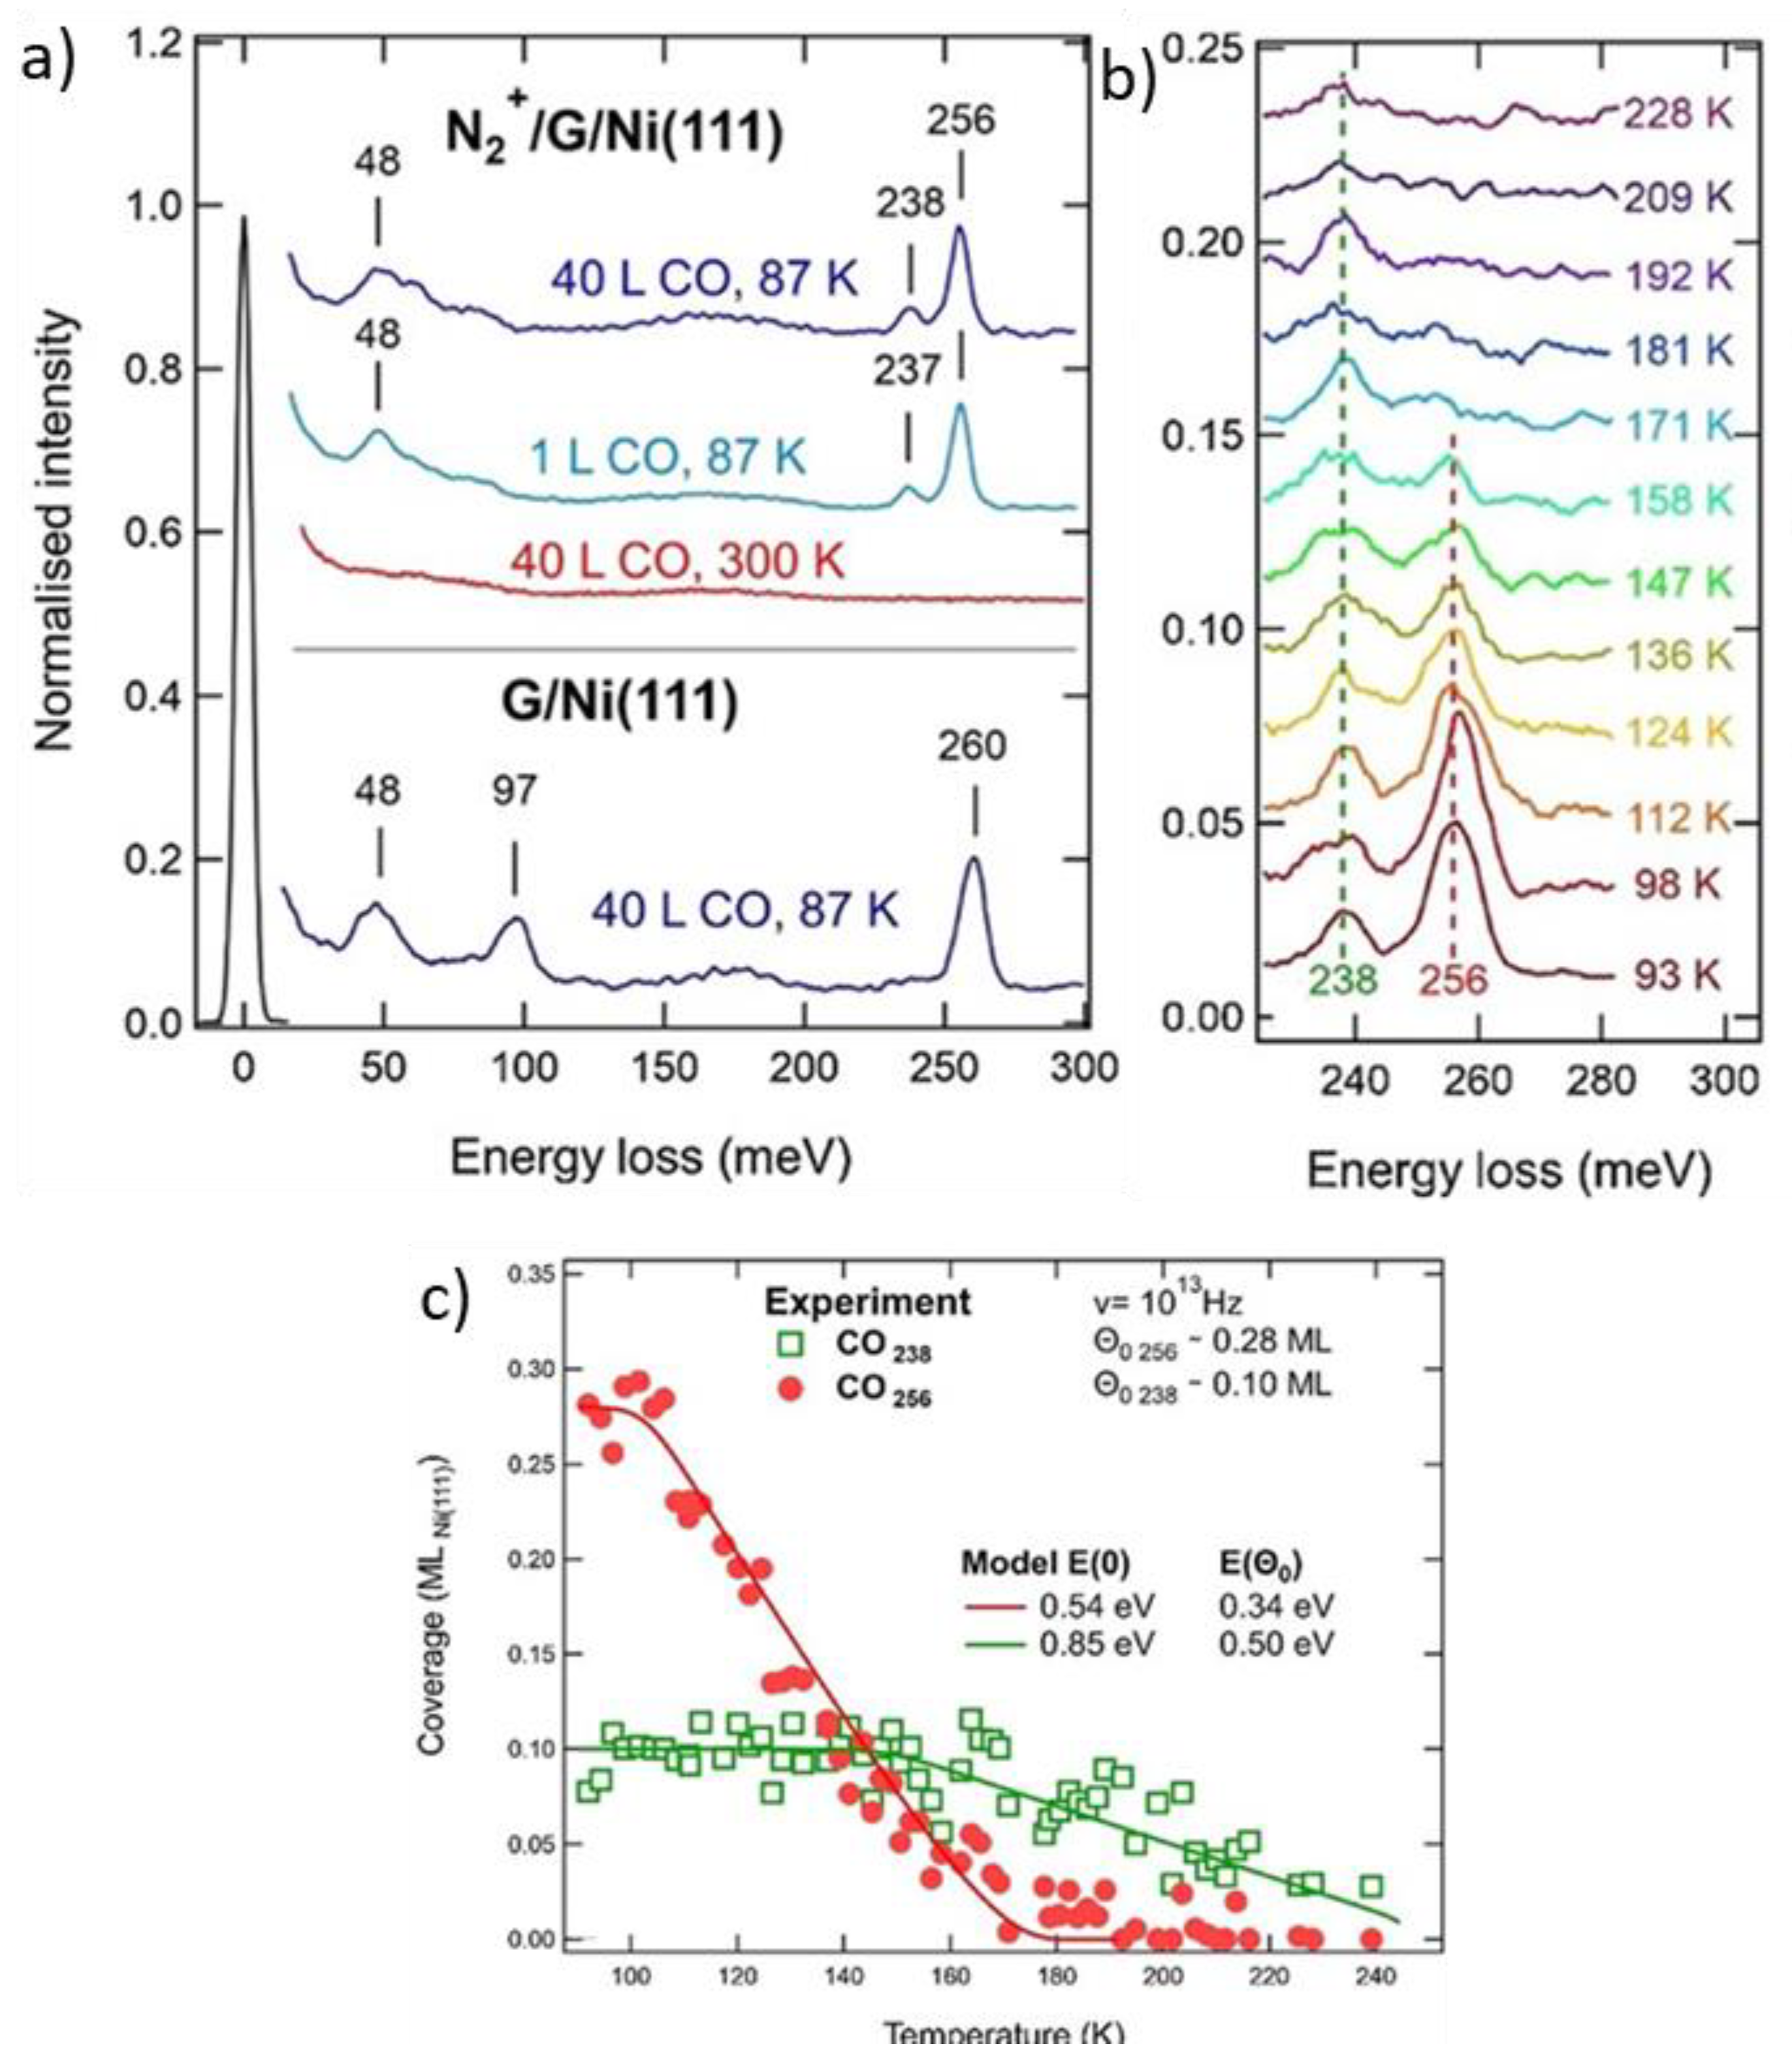
Figure 9. (a): HREEL spectra recorded in specular after dosing CO on pristine graphene on Ni(111) at 87 K (blue, lower spectrum), N-doped G/Ni(111) at RT (red, middle trace), N-doped G/Ni(111) at 87 K (blue, top traces). (b): Thermal evolution of the HREEL spectra of the N-doped graphene after exposure to CO at 87 K. (c): Intensity of the 234 meV and 256 meV peaks vs. annealing temperature. Reprinted from Ref. [47] Copyright 2018 with permission from Elsevier.
N-doped graphene has been proposed as a candidate metal-free catalyst for the oxygen reduction reaction (ORR).
Lai et al. [49] described how to produce nitrogen-doped graphene either by annealing graphene oxide (G-O) under ammonia or by annealing an N-containing polymer/reduced graphene oxide (RG-O) composite (polyaniline/RG-O or polypyrrole/RG-O). They also demonstrated that such metal-free catalysts could be used for ORR. By comparing cyclovoltammetry measurements performed on different electrodes, the authors investigated the effects of the N precursors and annealing temperature on the catalyst’s performance. Their findings show a strong dependence on the selectivity and catalytic activity for ORR, depending on the bonding state of the N atoms. The graphitic N directly affected the reactivity by determining the current density, while the pyridinic N improved the onset potential for ORR [49]. However, the total N content in the graphene-based non-precious metal catalyst does not play an essential role in the efficiency of the ORR process.
Jiao et al. [50] compared the activity of graphene doped with different heteroatoms towards ORR. In Figure 10a–f, researchers report the XPS spectra of the main line of the dopants, while Figure 10g shows a “volcano”-like plot correlating the theoretically expected current j0theory to ΔGOOH*.
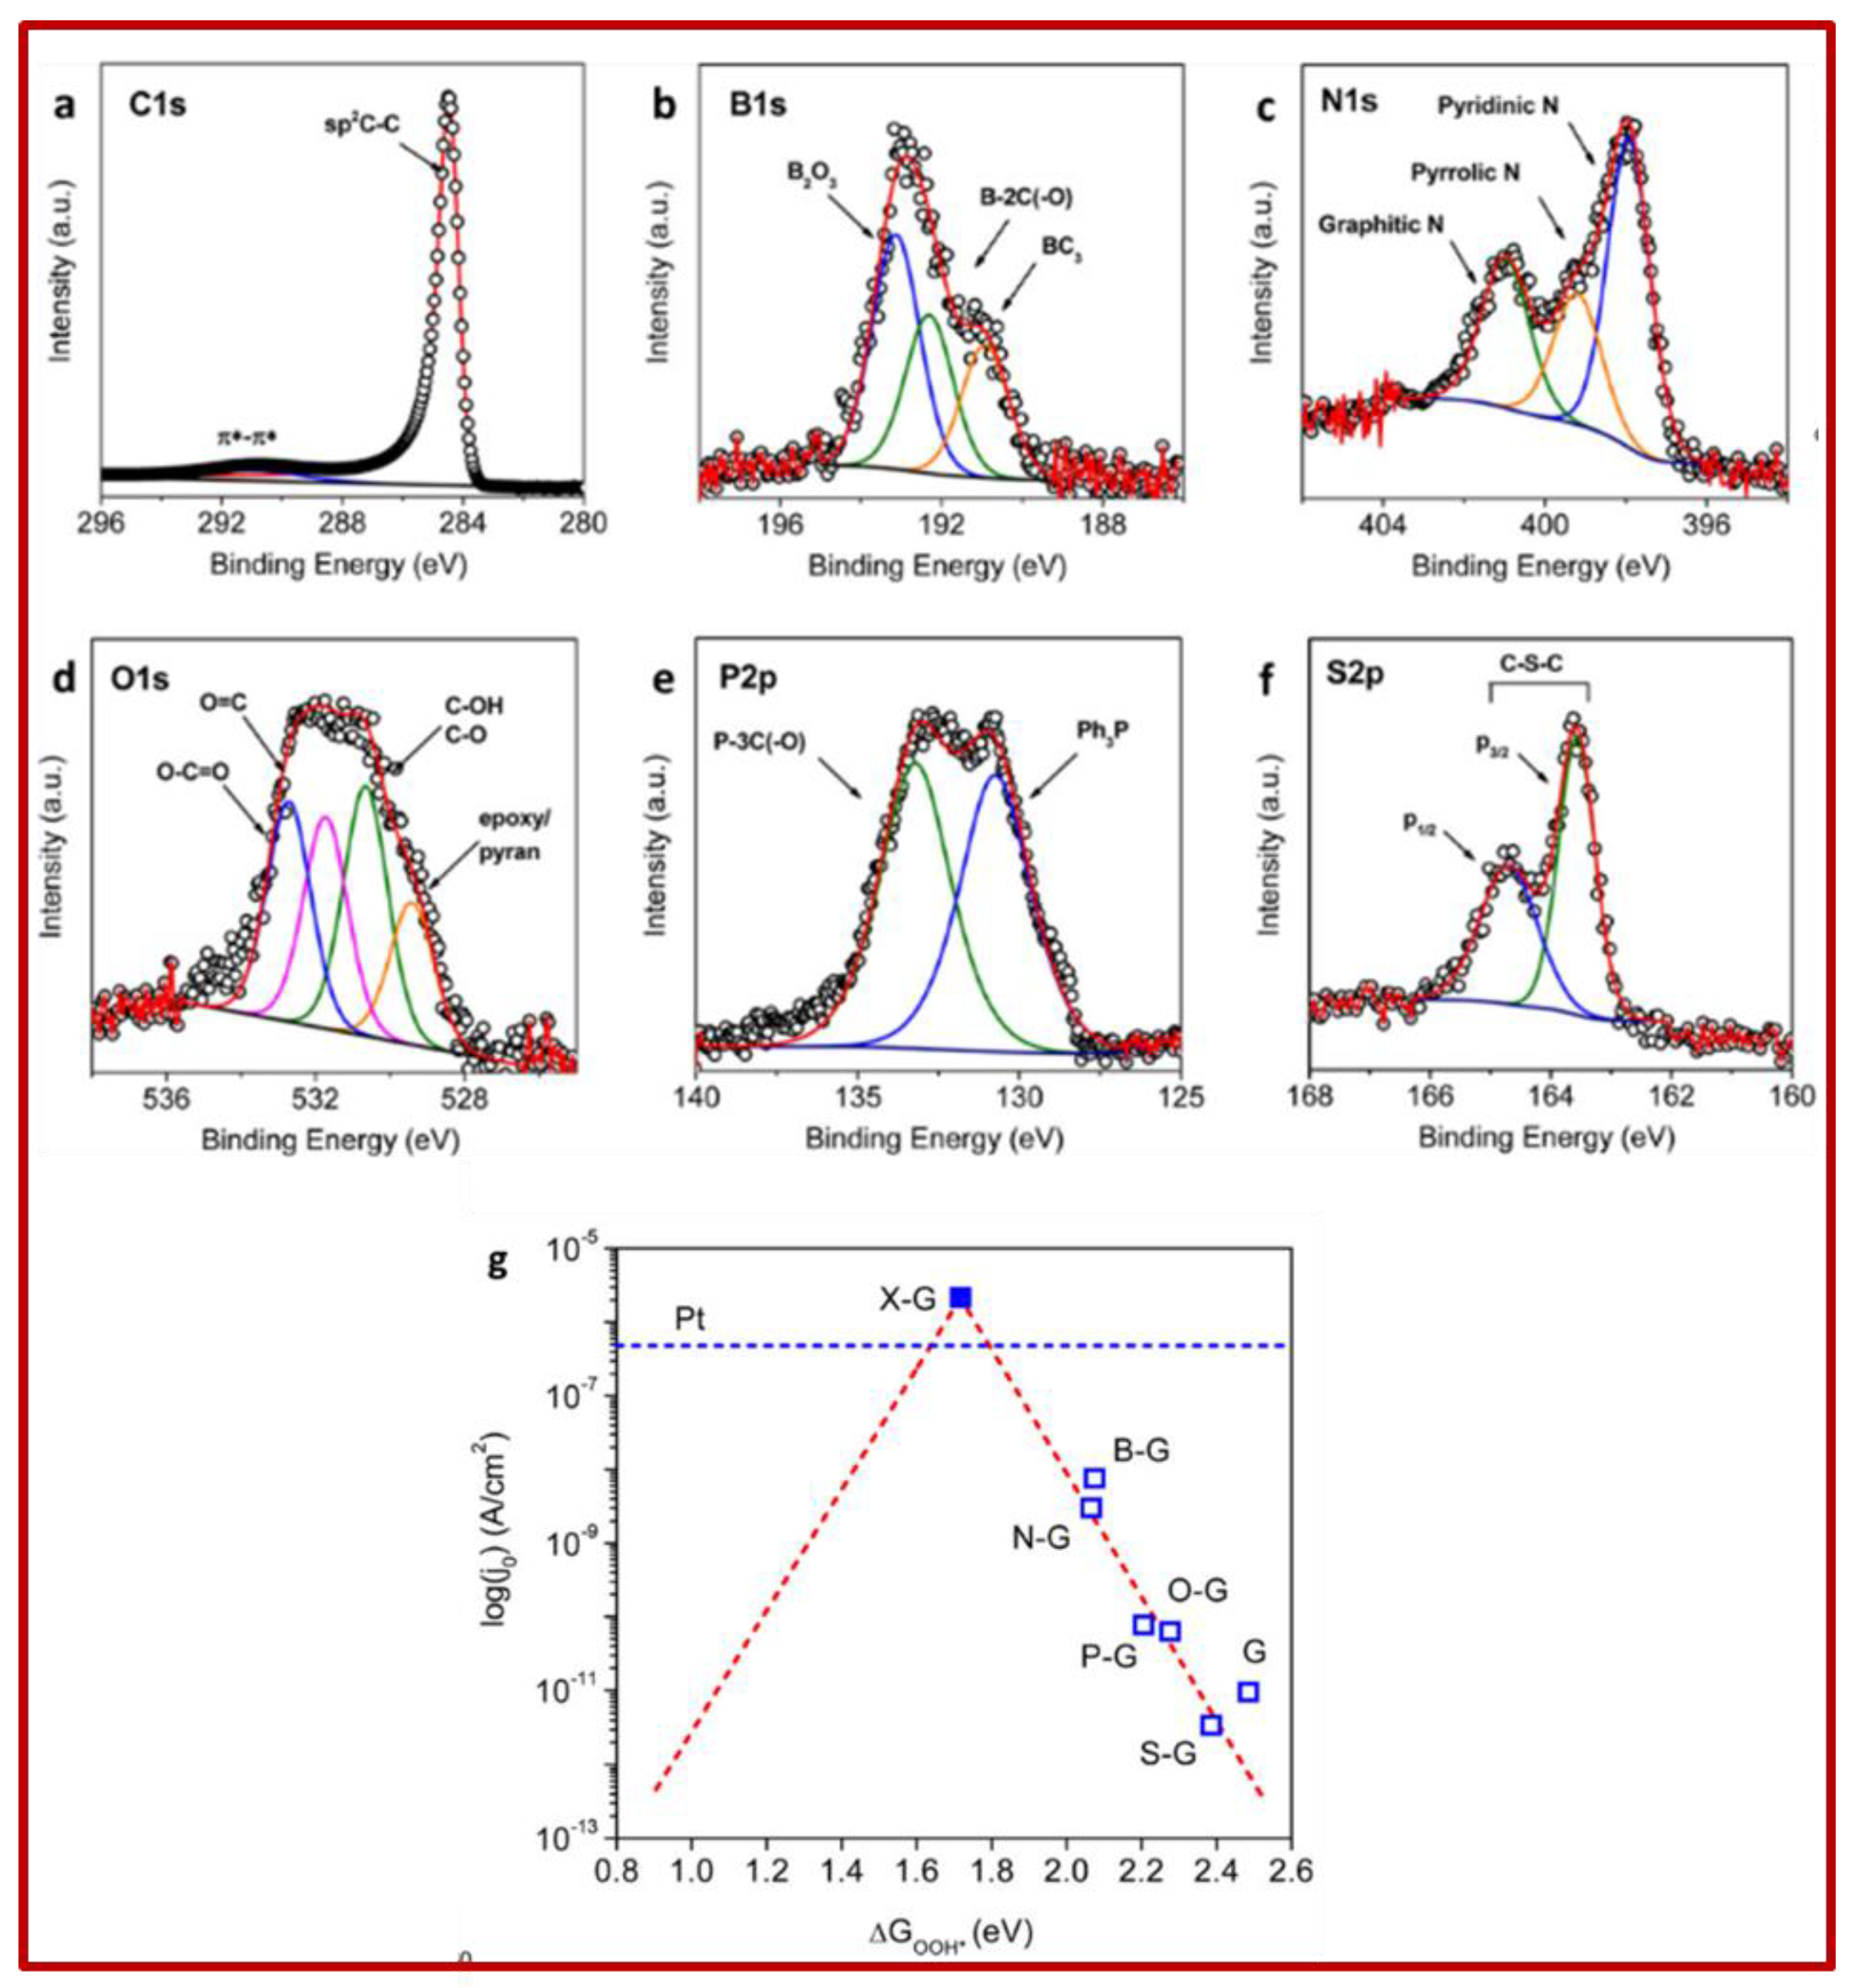
Figure 10. Left panels: High-resolution XPS spectra of different heteroatoms in doped graphene layers: (a) graphite. The main peak is due to sp2 C–C bonds, the lower intensity peak is due to the π plasmon; (b) B-graphene with contributions of B2O3 (blue), B–2C–O (green), BC3 (yellow); (c) N-graphene with graphitic (green), pyrrolic (yellow) and pyridinic (blue) contributions; (d) O-graphene with O-C=O (blue), O=C (pink). C–OH and C–O (green) and epoxyl pyran (yellow) contributions; (e) P-graphene with P–3C(–O) (green) and Ph3P (blue) contributions; (f) S-graphene with the S doublet of the C–S–C group. Right panel (g): Volcano plot between j0 theory and ΔGOOH* with charge-transfer coefficient α = 0.5 (red dashed line). Blue hollow squares are j0expt obtained from Tafel plots, and DFT derived ΔGOOH* for each doped graphene catalyst. Reprinted with permission from Ref. [50]. Copyright 2014 American Chemical Society.
The ORR reaction can be written as:
O2 + 2H2O + 4e− → 4OH−
Moreover, it can follow one associative and two dissociative reaction pathways. However, since the surface of doped graphene presents a relatively high energy barrier (>1.2 eV) in the dissociative pathway, the associative mechanism below:
is dominant, and was considered in their calculations to estimate ΔGOOH*.
O2(g) + 2 H2O(l) + 4e− +* → OOH* + OH− + H2O(l) + 3 e− → O* + 2 OH− + H2O(l) + 2e− → OH* + 3OH− + e− → 4OH
ΔGOOH* is the free energy change between the initial state and the one showing the OOH* intermediate. For each synthesised sample, j0expt (blue squares) closely follows the trend predicted in the plot. Moreover, due to the weak binding of OOH* on graphene-based surfaces, the calculated points are all on the right branch of the volcano plot. An optimal catalyst should have a higher current density j0, corresponding to a ΔGOOH* closer to the centre of the volcano-like plot. The “ideal” X-graphene should be at the summit of the volcano, with a calculated value of 2.12 × 10⁻⁶ A/cm2, i.e., ∼5 times higher than that of Pt/C catalyst under the same testing conditions.
N-doped graphene, together with MoS2, was demonstrated to have also photocatalytic activity resulting in the degradation of ammonia under near-infrared irradiation, a frequency range corresponding to about 54% of the solar spectrum. The activity of this new catalyst (99.6%) is significantly higher than the one (64%) attainable using only MoS2 and extremely stable since it is still as high as 90.7% after five runs [51].
Guo et al. [52] investigated the active site for ORR in N-doped G by preparing HOPG model catalysts with well-defined N-doping. They observed that the ORR reactivity linearly correlates with the pyridinic N concentration. From comparing pre- and post-ORR XPS spectra and from the analysis of the TPD results for the model HOPG exposed to CO2 at RT, they deduced that the active site is not the pyridinic N itself but, more precisely, a Lewis base site created in the carbon atoms neighbouring the N atom.
Finally, researchers mention that the presence of heteroatoms such as N may affect also the magnetic properties of the graphene layer. As an example, researchers cite the case of N-doped graphene (N content: 9.8%) produced by treating fluorographene with hydroxylamine (NH2OH) at 130 °C in dimethylformamide (DMF). Such treatment avoids high-temperature or the use of highly reactive reagents. This material features both localised spin centres and spin-containing sites with itinerant electron properties and exhibits a spin-switch behaviour (on–off–on) controlled by microwave irradiation at X-band frequency [53].
This entry is adapted from the peer-reviewed paper 10.3390/coatings12030397
This entry is offline, you can click here to edit this entry!
